Home > Comparison > Technology > AVGO vs MPWR
The strategic rivalry between Broadcom Inc. and Monolithic Power Systems defines the semiconductor sector’s competitive landscape. Broadcom operates as a diversified technology behemoth with a broad product portfolio across wired infrastructure and wireless communications. In contrast, Monolithic Power Systems specializes in high-margin power electronics ICs for niche markets. This analysis assesses which company’s operational model and growth trajectory yield a superior risk-adjusted return for a diversified technology portfolio.
Table of contents
Companies Overview
Broadcom and Monolithic Power Systems stand as pivotal players in the semiconductor market, each shaping distinct niches within the industry.
Broadcom Inc.: Global Semiconductor and Infrastructure Leader
Broadcom dominates as a global technology firm specializing in semiconductor and infrastructure software solutions. Its diverse revenue streams come from four segments: Wired Infrastructure, Wireless Communications, Enterprise Storage, and Industrial applications. In 2026, Broadcom sharpens its strategic focus on expanding integrated subsystems and enhancing firmware interfaces, reinforcing its broad product portfolio used in data centers, telecommunications, and industrial automation.
Monolithic Power Systems, Inc.: Power Electronics Innovator
Monolithic Power Systems leads in semiconductor-based power electronics solutions for computing, automotive, and industrial sectors. It generates revenue primarily through DC-to-DC integrated circuits and lighting control ICs that serve various electronic devices and systems. The company’s 2026 strategy centers on extending its footprint in automotive and consumer electronics markets, emphasizing energy-efficient power management technologies.
Strategic Collision: Similarities & Divergences
Both firms excel in semiconductor innovation, yet Broadcom adopts a broad, multi-segment approach while Monolithic Power targets specialized power electronics. They compete primarily in the high-growth communications and industrial segments, with Broadcom leveraging scale and Monolithic Power focusing on niche, energy-efficient solutions. Their investment profiles diverge sharply: Broadcom offers diversified exposure with sizeable market cap, whereas Monolithic Power presents a focused, growth-oriented proposition.
Income Statement Comparison
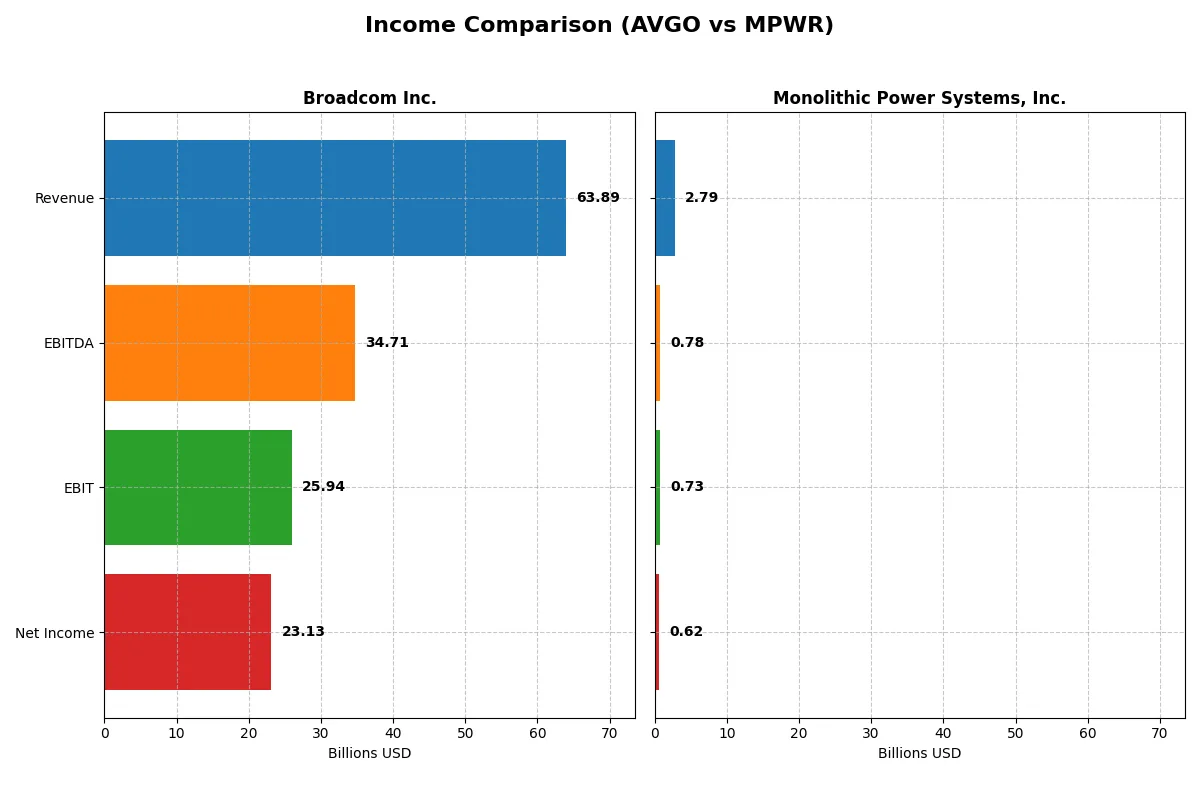
This data dissects the core profitability and scalability of both corporate engines to reveal who dominates the bottom line:
| Metric | Broadcom Inc. (AVGO) | Monolithic Power Systems, Inc. (MPWR) |
|---|---|---|
| Revenue | 63.9B | 2.79B |
| Cost of Revenue | 20.6B | 1.25B |
| Operating Expenses | 17.8B | 811M |
| Gross Profit | 43.3B | 1.54B |
| EBITDA | 34.7B | 780M |
| EBIT | 25.9B | 729M |
| Interest Expense | 3.21B | 0 |
| Net Income | 23.1B | 616M |
| EPS | 4.91 | 12.82 |
| Fiscal Year | 2025 | 2025 |
Income Statement Analysis: The Bottom-Line Duel
This income statement comparison reveals which company operates with superior efficiency and profitability in the current market environment.
Broadcom Inc. Analysis
Broadcom’s revenue surged from $27.5B in 2021 to $63.9B in 2025, with net income climbing from $6.4B to $23.1B. Its gross margin stands strong at 67.8%, and net margin at 36.2%, both favorable. The latest year shows exceptional momentum, with a 23.9% revenue growth and a 217% net margin expansion, signaling outstanding operational leverage and capital allocation.
Monolithic Power Systems, Inc. Analysis
Monolithic Power’s revenue grew from $1.2B in 2021 to $2.79B in 2025, while net income rose from $242M to $616M. Its gross margin of 55.2% and net margin of 22.1% remain solid but below Broadcom’s. Despite a 26.4% revenue increase in 2025, net margin sharply declined by 72.7%, reflecting margin pressure or one-off impacts that dampen profitability momentum.
Margin Dominance vs. Growth Resilience
Broadcom outperforms Monolithic Power with higher margins and stronger net income growth, demonstrating superior scale and efficiency. Monolithic Power shows healthy revenue growth but weaker margin sustainability. For investors, Broadcom’s profile offers a compelling blend of scale and profitability, while Monolithic Power suits those focused on growth with a tolerance for margin volatility.
Financial Ratios Comparison
These vital ratios act as a diagnostic tool to expose the underlying fiscal health, valuation premiums, and capital efficiency of the companies compared below:
| Ratios | Broadcom Inc. (AVGO) | Monolithic Power Systems, Inc. (MPWR) |
|---|---|---|
| ROE | 28.4% | 16.6% |
| ROIC | 16.4% | 14.9% |
| P/E | 73.9 | 70.7 |
| P/B | 21.0 | 11.7 |
| Current Ratio | 1.71 | 5.91 |
| Quick Ratio | 1.58 | 4.38 |
| D/E | 0.80 | 0.00 |
| Debt-to-Assets | 38.1% | 0.0% |
| Interest Coverage | 7.94 | 0.00 |
| Asset Turnover | 0.37 | 0.65 |
| Fixed Asset Turnover | 25.3 | 4.45 |
| Payout Ratio | 48.2% | 46.2% |
| Dividend yield | 0.65% | 0.65% |
| Fiscal Year | 2025 | 2025 |
Efficiency & Valuation Duel: The Vital Signs
Financial ratios serve as a company’s DNA, uncovering hidden risks and highlighting operational excellence critical for informed investment decisions.
Broadcom Inc.
Broadcom delivers robust profitability with a 28.45% ROE and a commanding 36.2% net margin, signaling operational strength. However, its lofty 73.87 P/E and 21.01 P/B ratios mark the stock as expensive and stretched. Shareholders receive modest 0.65% dividends, while substantial R&D investment (17.2% of revenue) fuels future growth.
Monolithic Power Systems, Inc.
Monolithic Power posts solid profitability, with a 16.55% ROE and a 22.07% net margin, reflecting efficiency. Its P/E of 70.69 and P/B of 11.7 also indicate a high valuation, though less extreme than Broadcom’s. The company retains earnings for growth and R&D (13.7% of revenue), offering no dividend but maintaining strong financial health with zero debt.
Premium Valuation vs. Operational Safety
Broadcom’s superior returns come at a higher valuation premium and moderate leverage, while Monolithic Power offers a balanced profile with strong financial health and growth focus. Investors seeking aggressive growth might prefer Broadcom; those favoring financial prudence and steady expansion may lean toward Monolithic Power.
Which one offers the Superior Shareholder Reward?
I see Broadcom (AVGO) offers a 0.65% dividend yield with a 48% payout ratio, well-covered by free cash flow. It pairs steady dividends with aggressive buybacks, enhancing shareholder value. Monolithic Power (MPWR) yields 0.65% too but with a lower payout ratio (46%), reflecting reinvestment in growth. MPWR’s buyback program is less prominent, focusing on R&D and expansion. Historically, Broadcom’s balanced dividends and buybacks produce more sustainable returns, while MPWR’s growth model is riskier. In 2026, I favor Broadcom for superior total shareholder reward due to its disciplined capital allocation and stronger cash flow coverage.
Comparative Score Analysis: The Strategic Profile
The radar chart reveals the fundamental DNA and trade-offs of Broadcom Inc. and Monolithic Power Systems, Inc., highlighting their core financial strengths and weaknesses:
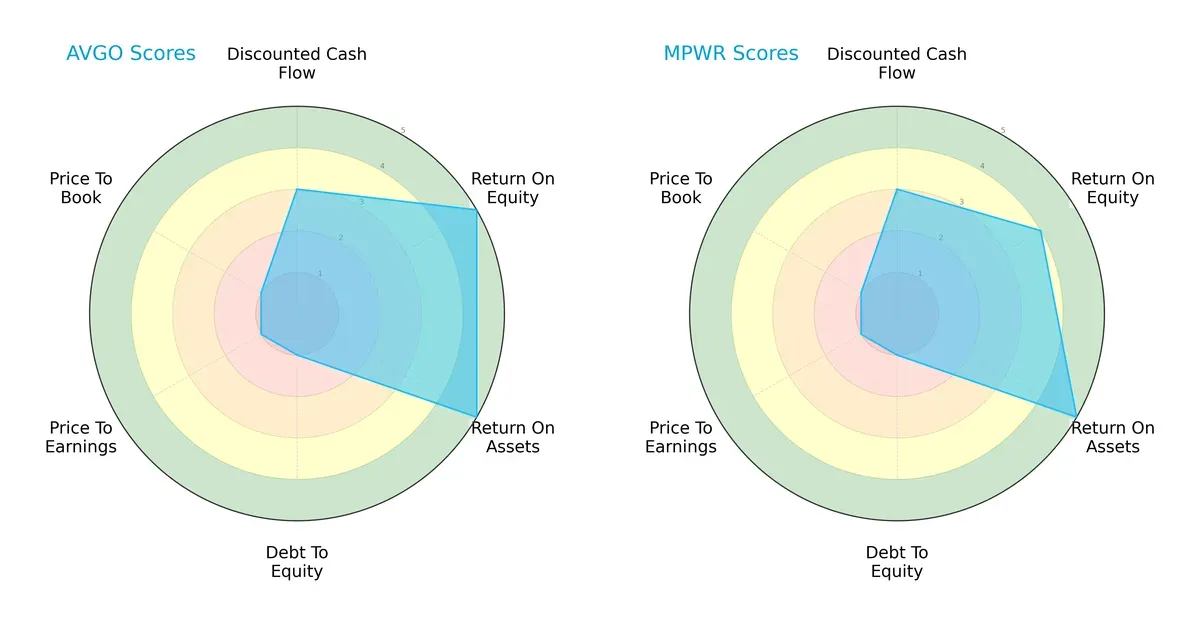
Broadcom excels in return on equity (ROE) with a very favorable score of 5, slightly above Monolithic Power’s 4. Both companies share top marks on return on assets (ROA) at 5. However, both struggle with debt-to-equity and valuation metrics, scoring very unfavorably at 1 across price-to-earnings (P/E) and price-to-book (P/B) ratios. Broadcom’s profile is more unbalanced, relying heavily on profitability, while Monolithic Power shows a steadier operational efficiency with a slightly more favorable ROE.
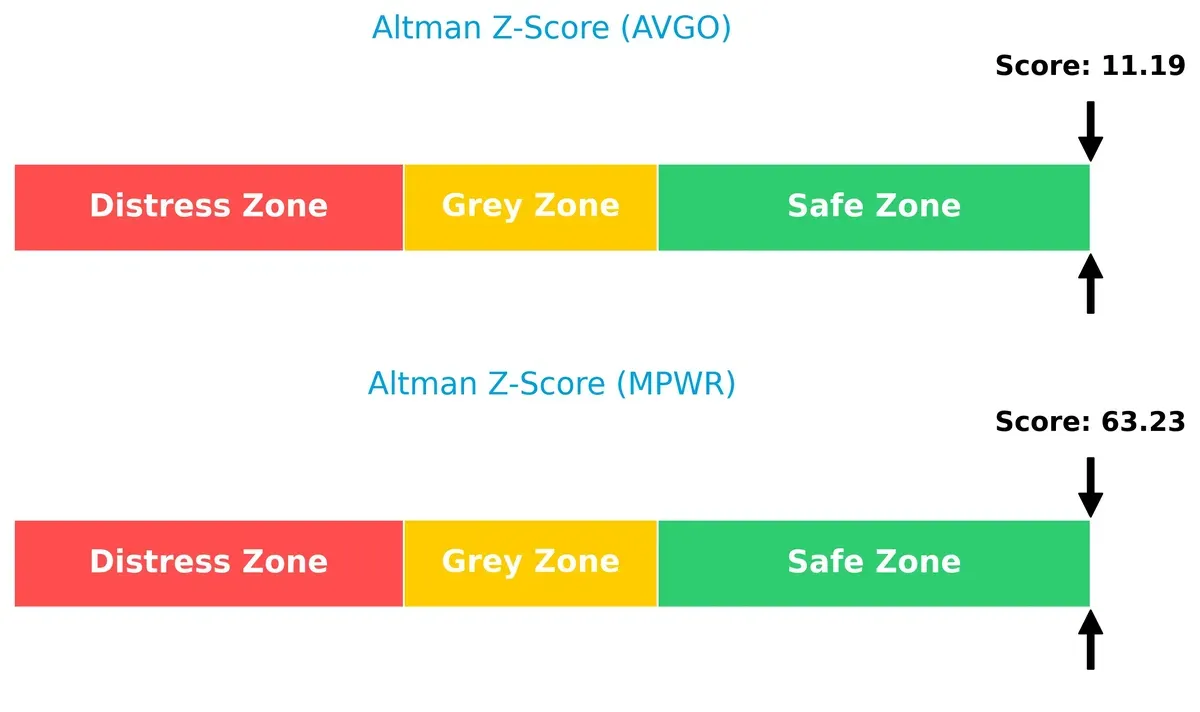
Bankruptcy Risk: Solvency Showdown
Broadcom’s Altman Z-Score of 11.19 versus Monolithic Power’s 63.23 signals both firms are in an exceptionally safe zone, with Monolithic Power showing a remarkably stronger buffer against bankruptcy risk in this cycle:
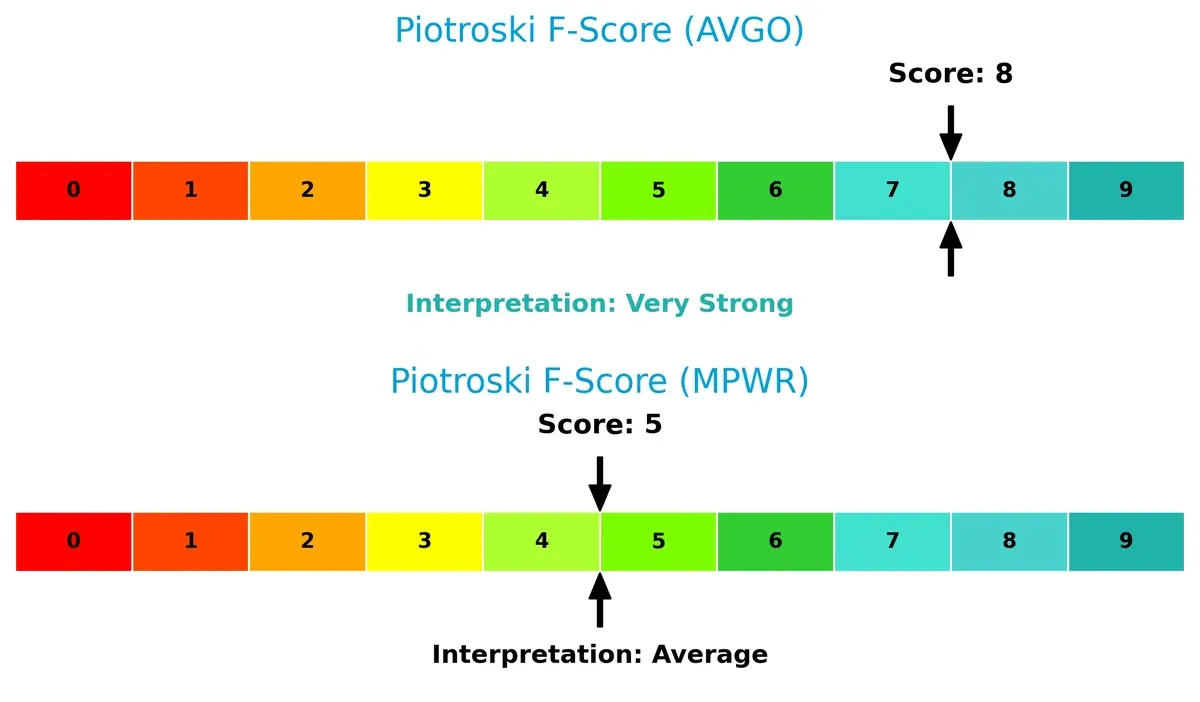
Financial Health: Quality of Operations
Broadcom’s Piotroski F-Score of 8 reflects very strong financial health, outperforming Monolithic Power’s average score of 5. This indicates Broadcom’s operational metrics are more robust, with fewer red flags in profitability, leverage, and liquidity:
How are the two companies positioned?
This section dissects the operational DNA of Broadcom and Monolithic Power by comparing their revenue distribution and internal dynamics. The goal is to confront their economic moats and identify which model delivers the most resilient, sustainable advantage today.
Revenue Segmentation: The Strategic Mix
This visual comparison dissects how Broadcom Inc. and Monolithic Power Systems diversify their income streams and where their primary sector bets lie:
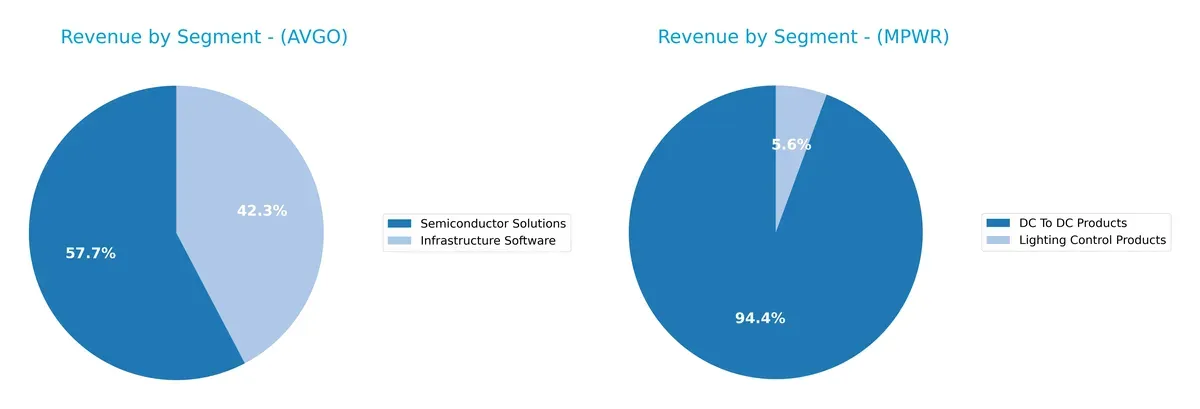
Broadcom Inc. dwarfs Monolithic Power Systems with $36.9B in Semiconductor Solutions and $27B in Infrastructure Software, showing a balanced two-segment mix. In contrast, Monolithic Power pivots heavily on DC To DC Products, generating $1.72B, with Lighting Control trailing at $102M. Broadcom’s dual focus signals ecosystem lock-in and infrastructure dominance, whereas Monolithic Power’s concentration exposes it to higher segment risk despite steady growth.
Strengths and Weaknesses Comparison
This table compares the Strengths and Weaknesses of Broadcom Inc. and Monolithic Power Systems, Inc.:
Broadcom Inc. Strengths
- High net margin at 36.2%
- Strong ROE at 28.45%
- Favorable ROIC of 16.36%
- Robust current and quick ratios
- Large global revenue, especially Asia Pacific
- Diversified segments in software and semiconductors
Monolithic Power Systems Strengths
- Solid net margin at 22.07%
- Favorable ROE of 16.55%
- Strong ROIC of 14.93%
- Zero debt and infinite interest coverage
- High quick ratio at 4.38
- Consistent product revenue growth in DC to DC products
Broadcom Inc. Weaknesses
- Unfavorable high P/E of 73.87 and P/B of 21.01
- Unfavorable asset turnover at 0.37
- Moderate debt-to-assets ratio at 38%
- Low dividend yield at 0.65%
- Moderate fixed asset turnover disparity
Monolithic Power Systems Weaknesses
- Unfavorable high P/E of 70.69 and P/B of 11.7
- Unfavorable WACC at 10.63%
- Unfavorable current ratio at 5.91
- Limited geographic diversification compared to Broadcom
- Low dividend yield at 0.65%
Broadcom excels in profitability and geographic scale but carries valuation and asset efficiency concerns. Monolithic Power Systems shows strong balance sheet health and operational efficiency but faces valuation pressures and geographic concentration risks. Both companies reflect distinct strategic profiles within the semiconductor sector.
The Moat Duel: Analyzing Competitive Defensibility
A structural moat is the only reliable barrier protecting long-term profits from relentless competition erosion. Let’s examine two key players in semiconductors:
Broadcom Inc.: Dominant Cost and Scale Advantage
Broadcom leverages a powerful cost advantage and extensive product integration. Its 7% ROIC premium over WACC and robust 67.8% gross margin confirm strong value creation. Expansion into infrastructure software in 2026 could deepen its moat.
Monolithic Power Systems, Inc.: Specialized Innovation Edge
MPWR’s moat stems from specialized power electronics innovation, differentiating it from Broadcom’s scale. Despite a 4.3% ROIC premium, its declining ROIC trend signals pressure on profitability. Growth in automotive and industrial markets offers upside.
Cost Leadership vs. Innovation Specialization
Broadcom’s wider and growing moat outpaces MPWR’s narrower one, driven by scale and integrated offerings. I see Broadcom better positioned to defend and expand market share amid 2026’s intensifying competition.
Which stock offers better returns?
Over the past 12 months, Broadcom Inc. (AVGO) and Monolithic Power Systems, Inc. (MPWR) showed strong price gains with differing recent momentum and volume dynamics.
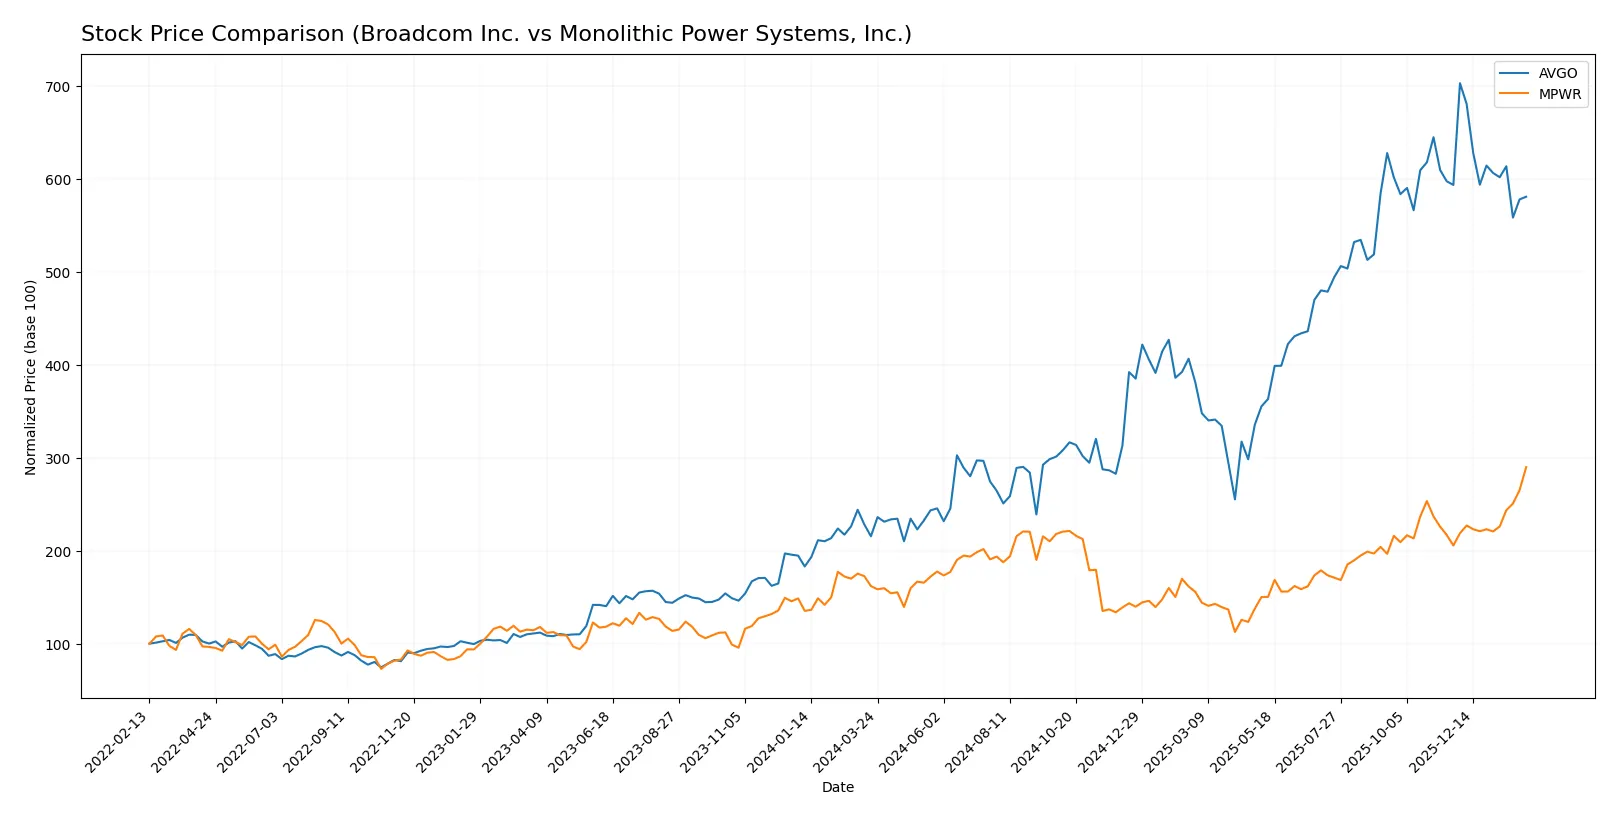
Trend Comparison
Broadcom’s stock rose 169.46% over the last year, marking a bullish trend with decelerating momentum. Notable high was 403; recent months show a slight bearish pullback of -2.14%.
Monolithic Power Systems gained 79.02%, also bullish with accelerating momentum and higher volatility. Its recent trend reversed sharply upward with a 40.98% gain, reflecting renewed strength.
Broadcom outperformed Monolithic Power Systems over the year, despite recent weakness. MPWR’s recent acceleration contrasts with AVGO’s deceleration in the latest months.
Target Prices
Analysts project solid upside potential for Broadcom Inc. and Monolithic Power Systems, reflecting confidence in the semiconductor sector.
| Company | Target Low | Target High | Consensus |
|---|---|---|---|
| Broadcom Inc. | 370 | 510 | 450.12 |
| Monolithic Power Systems, Inc. | 1200 | 1500 | 1313.71 |
Broadcom’s consensus target of 450 implies a 35% upside from the current 333 price. Monolithic Power’s 1314 target suggests roughly 7% growth potential from 1230.

Don’t Let Luck Decide Your Entry Point
Optimize your entry points with our advanced ProRealTime indicators. You’ll get efficient buy signals with precise price targets for maximum performance. Start outperforming now!
How do institutions grade them?
The following grades from reputable institutions summarize the outlook for Broadcom Inc. and Monolithic Power Systems, Inc.:
Broadcom Inc. Grades
This table shows recent institutional grades and rating actions for Broadcom Inc.:
| Grading Company | Action | New Grade | Date |
|---|---|---|---|
| Wells Fargo | Upgrade | Overweight | 2026-01-15 |
| Mizuho | Maintain | Outperform | 2026-01-09 |
| Truist Securities | Maintain | Buy | 2025-12-19 |
| UBS | Maintain | Buy | 2025-12-15 |
| Rosenblatt | Maintain | Buy | 2025-12-12 |
| Morgan Stanley | Maintain | Overweight | 2025-12-12 |
| Barclays | Maintain | Overweight | 2025-12-12 |
| Bernstein | Maintain | Outperform | 2025-12-12 |
| Citigroup | Maintain | Buy | 2025-12-12 |
| Mizuho | Maintain | Outperform | 2025-12-12 |
Monolithic Power Systems, Inc. Grades
This table displays recent institutional grades and rating actions for Monolithic Power Systems, Inc.:
| Grading Company | Action | New Grade | Date |
|---|---|---|---|
| Truist Securities | Maintain | Buy | 2026-02-06 |
| Keybanc | Maintain | Overweight | 2026-02-06 |
| Rosenblatt | Maintain | Neutral | 2026-02-06 |
| Needham | Maintain | Buy | 2026-02-06 |
| Wells Fargo | Maintain | Overweight | 2026-02-06 |
| Stifel | Maintain | Buy | 2026-02-04 |
| Wells Fargo | Maintain | Overweight | 2026-01-26 |
| Wells Fargo | Upgrade | Overweight | 2026-01-15 |
| Truist Securities | Maintain | Buy | 2025-12-19 |
| Citigroup | Maintain | Buy | 2025-11-03 |
Which company has the best grades?
Broadcom Inc. consistently receives Buy to Outperform grades with upgrades, reflecting strong institutional confidence. Monolithic Power Systems, Inc. also holds mainly Buy and Overweight ratings but includes some Neutral assessments. Investors may perceive Broadcom’s steadier, higher grades as a sign of broader analyst conviction.
Risks specific to each company
The following categories identify the critical pressure points and systemic threats facing both firms in the 2026 market environment:
1. Market & Competition
Broadcom Inc.
- Operates in a highly competitive semiconductor sector with diversified segments, facing pressure from large global peers.
Monolithic Power Systems, Inc.
- Focuses on power electronics niche, competing with larger firms but with less diversification, increasing market vulnerability.
2. Capital Structure & Debt
Broadcom Inc.
- Moderate leverage with debt-to-assets at 38%, interest coverage strong at 8x, showing controlled financial risk.
Monolithic Power Systems, Inc.
- Zero debt, excellent balance sheet, no interest burden, providing financial flexibility and lower default risk.
3. Stock Volatility
Broadcom Inc.
- Beta at 1.22 suggests moderate volatility, aligned with semiconductor industry trends.
Monolithic Power Systems, Inc.
- Higher beta at 1.46 indicates greater stock price swings, reflecting higher risk and sensitivity to market shifts.
4. Regulatory & Legal
Broadcom Inc.
- Operates globally with exposure to complex regulatory regimes, increasing compliance costs and legal risk.
Monolithic Power Systems, Inc.
- Also global, but smaller scale may lower regulatory scrutiny and legal complexity relative to Broadcom.
5. Supply Chain & Operations
Broadcom Inc.
- Complex supply chain spanning multiple segments; susceptible to semiconductor shortages and logistics disruptions.
Monolithic Power Systems, Inc.
- Smaller, focused supply chain for power electronics; less complexity but still exposed to component shortages.
6. ESG & Climate Transition
Broadcom Inc.
- Large footprint with growing ESG initiatives; transition risks from energy-intensive manufacturing remain significant.
Monolithic Power Systems, Inc.
- Smaller scale limits direct ESG impact; still faces pressure to adapt products and processes for sustainability.
7. Geopolitical Exposure
Broadcom Inc.
- Operations across Asia, US, Europe expose it to US-China trade tensions and sanctions risk.
Monolithic Power Systems, Inc.
- International sales concentrated in Asia and the US; geopolitical tensions pose supply and market access challenges.
Which company shows a better risk-adjusted profile?
Broadcom’s biggest risk lies in its complex global supply chain and regulatory exposure, which could impact operational continuity. Monolithic Power faces elevated stock volatility and narrower market focus, increasing its business risk. Despite moderate leverage, Broadcom’s diversified segments and strong interest coverage provide resilience. Monolithic Power’s pristine balance sheet and higher profitability ratios offer financial strength but come with higher market sensitivity. Recent data shows Monolithic Power’s zero debt and excellent Altman Z-score bolster its credit safety, yet its higher beta warns of price swings. Overall, Broadcom’s balanced risk profile and scale make it slightly better positioned for risk-adjusted stability in 2026.
Final Verdict: Which stock to choose?
Broadcom Inc. (AVGO) excels as a cash-generating powerhouse with a very favorable moat. Its superpower lies in superior capital efficiency and sustained profitability growth. A point of vigilance is its lofty valuation multiples, which may temper near-term upside. Best suited for aggressive growth portfolios willing to pay for quality dominance.
Monolithic Power Systems, Inc. (MPWR) builds a strategic moat around its robust balance sheet and consistent value creation. Its safety profile outshines Broadcom’s with zero debt and strong liquidity, offering a cushion during market volatility. Fits well in GARP portfolios seeking measured growth with durable financial health.
If you prioritize high return on invested capital and growth momentum, Broadcom is the compelling choice due to its scalable competitive advantage and cash flow strength. However, if you seek better stability and balance sheet safety, Monolithic Power Systems offers superior financial resilience and less valuation risk. Each scenario addresses distinct investor appetites for growth versus prudence.
Disclaimer: Investment carries a risk of loss of initial capital. The past performance is not a reliable indicator of future results. Be sure to understand risks before making an investment decision.
Go Further
I encourage you to read the complete analyses of Broadcom Inc. and Monolithic Power Systems, Inc. to enhance your investment decisions: