Home > Comparison > Technology > AVGO vs MXL
The strategic rivalry between Broadcom Inc. and MaxLinear, Inc. shapes the semiconductor industry’s evolution. Broadcom operates as a diversified technology powerhouse with broad infrastructure software and semiconductor solutions. MaxLinear focuses on high-performance analog and mixed-signal SoCs for communications systems. This head-to-head highlights a battle between scale-driven diversification and specialized innovation. This analysis will determine which company offers a superior risk-adjusted return for a well-balanced portfolio.
Table of contents
Companies Overview
Broadcom Inc. and MaxLinear, Inc. both play critical roles in the semiconductor industry, shaping modern connectivity and communication infrastructure.
Broadcom Inc.: Global Semiconductor Powerhouse
Broadcom Inc. dominates as a global technology leader designing and supplying semiconductor and infrastructure software solutions. Its core revenue stems from four segments: Wired Infrastructure, Wireless Communications, Enterprise Storage, and Industrial applications. In 2026, Broadcom’s strategic focus remains on expanding its complex product portfolio, integrating firmware and mechanical hardware to service diverse sectors including data centers and telecommunications.
MaxLinear, Inc.: High-Performance Communications Innovator
MaxLinear, Inc. specializes in radiofrequency and mixed-signal SoCs for connected home, wired and wireless infrastructure, and industrial applications. Its revenue engine hinges on highly integrated communication platform solutions like broadband radio transceivers and data converters. In 2026, MaxLinear prioritizes enhancing its end-to-end system designs for 4G/5G networks and data center modules, targeting OEMs and ODMs globally.
Strategic Collision: Similarities & Divergences
Both companies are entrenched in semiconductor innovation but diverge in scale and product complexity. Broadcom pursues a broad, diversified technology stack, while MaxLinear focuses on specialized, high-performance communication chips. Their primary battleground lies in wireless infrastructure and data center networking. Broadcom’s vast market cap and product breadth contrast with MaxLinear’s niche agility, defining distinct investment profiles shaped by scale and growth potential.
Income Statement Comparison
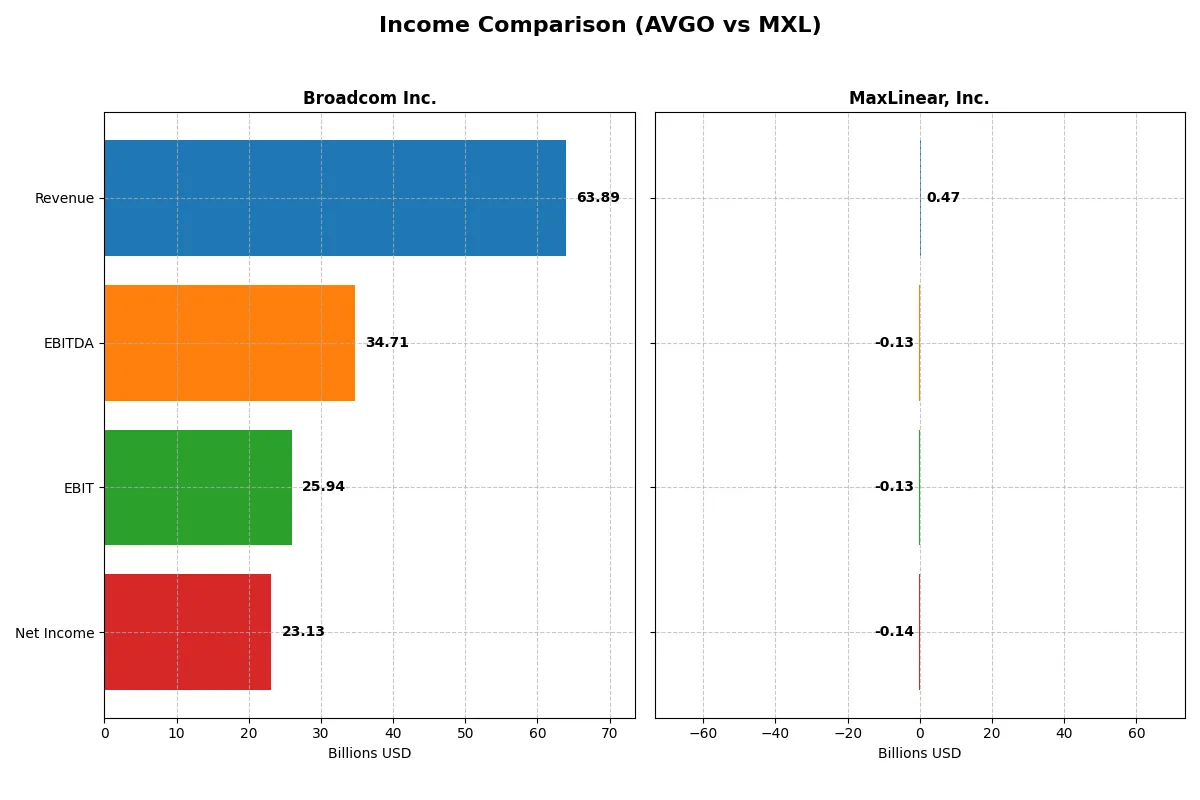
This data dissects the core profitability and scalability of both corporate engines to reveal who dominates the bottom line:
| Metric | Broadcom Inc. (AVGO) | MaxLinear, Inc. (MXL) |
|---|---|---|
| Revenue | 63.9B | 468M |
| Cost of Revenue | 20.6B | 202M |
| Operating Expenses | 17.8B | 393M |
| Gross Profit | 43.3B | 266M |
| EBITDA | 34.7B | -131M |
| EBIT | 25.9B | -131M |
| Interest Expense | 3.2B | 10.1M |
| Net Income | 23.1B | -137M |
| EPS | 4.91 | -1.58 |
| Fiscal Year | 2025 | 2025 |
Income Statement Analysis: The Bottom-Line Duel
This income statement comparison reveals which company runs a more efficient and profitable corporate engine over recent years.
Broadcom Inc. Analysis
Broadcom’s revenue surged from $27.5B in 2021 to $63.9B in 2025, while net income jumped from $6.4B to $23.1B. The gross margin holds strong at 67.8%, and a net margin of 36.2% signals robust profitability. In 2025, Broadcom accelerates earnings growth with a 216.7% net margin improvement, showcasing powerful operational leverage and cost control.
MaxLinear, Inc. Analysis
MaxLinear’s revenue peaked at $1.12B in 2022 but declined to $468M in 2025, reflecting a shrinking top line. Despite a favorable gross margin near 56.8%, the company posts a negative net margin of -29.2%, with losses narrowing but still deep in 2025. The EBIT margin remains unfavorable at -28%, indicating ongoing operating inefficiencies and a challenging path to profitability.
Verdict: Profitability Juggernaut vs. Recovery Struggles
Broadcom dominates with robust revenue and net income growth, superior margins, and efficient cost management. MaxLinear faces revenue contraction and persistent losses despite margin improvements. For investors prioritizing financial strength and consistent profit growth, Broadcom’s profile is clearly more attractive.
Financial Ratios Comparison
These vital ratios act as a diagnostic tool to expose the underlying fiscal health, valuation premiums, and capital efficiency of the companies compared below:
| Ratios | Broadcom Inc. (AVGO) | MaxLinear, Inc. (MXL) |
|---|---|---|
| ROE | 28.4% | -47.5% |
| ROIC | 16.4% | -24.3% |
| P/E | 73.9 | -6.7 |
| P/B | 21.0 | 3.20 |
| Current Ratio | 1.71 | 1.77 |
| Quick Ratio | 1.58 | 1.28 |
| D/E | 0.80 | 0.29 |
| Debt-to-Assets | 38.1% | 17.2% |
| Interest Coverage | 7.94 | -15.5 |
| Asset Turnover | 0.37 | 0.42 |
| Fixed Asset Turnover | 25.3 | 4.65 |
| Payout ratio | 48.2% | 0% |
| Dividend yield | 0.65% | 0% |
| Fiscal Year | 2025 | 2024 |
Efficiency & Valuation Duel: The Vital Signs
Financial ratios serve as a company’s DNA, unveiling hidden risks and operational strengths beyond surface-level metrics.
Broadcom Inc.
Broadcom delivers strong profitability with a 28.45% ROE and a robust 36.2% net margin, signaling operational excellence. However, its valuation is stretched, marked by a high P/E of 73.87 and a P/B of 21.01. The company favors shareholder returns through a modest 0.65% dividend yield, balancing payout with heavy reinvestment in R&D.
MaxLinear, Inc.
MaxLinear struggles with deep losses, reflected in a negative 47.49% ROE and a -68.01% net margin, exposing significant operational challenges. Its valuation appears attractive with a negative P/E, yet the modest market cap and no dividend highlight risk. The firm focuses on growth via heavy R&D spending, but financial stability remains a concern.
Premium Profitability vs. Distressed Growth Profile
Broadcom offers a superior balance of profitability and operational health despite a stretched valuation. MaxLinear’s negative returns and unfavorable ratios signal higher risk. Investors seeking stable earnings and moderate income may prefer Broadcom, while risk-tolerant growth seekers might consider MaxLinear’s turnaround potential.
Which one offers the Superior Shareholder Reward?
I compare Broadcom Inc. (AVGO) and MaxLinear, Inc. (MXL) on shareholder return through dividends and buybacks. Broadcom yields 0.65% with a 48% payout ratio, well covered by free cash flow at nearly 98%. It also aggressively repurchases shares, enhancing total returns. MaxLinear pays no dividends and posts negative free cash flow, focusing capital on R&D and growth amid losses. Its buyback activity is negligible. I see Broadcom’s balanced dividend and robust buybacks as a more sustainable model for long-term value. MaxLinear’s reinvestment carries higher risk without immediate shareholder cash returns. In 2026, Broadcom offers the superior total return profile for investors seeking both income and capital appreciation.
Comparative Score Analysis: The Strategic Profile
The radar chart reveals the fundamental DNA and trade-offs of Broadcom Inc. and MaxLinear, Inc., highlighting their distinctive financial strengths and weaknesses:
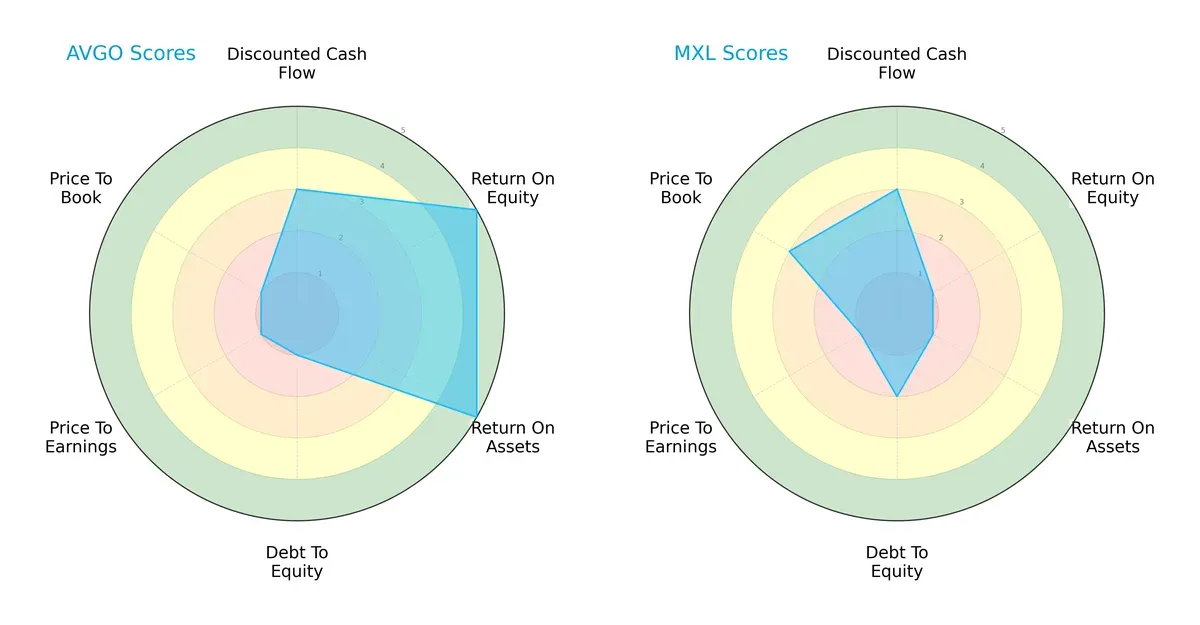
Broadcom exhibits strong operational efficiency with top ROE and ROA scores (5 each), signaling excellent profit generation and asset utilization. However, its debt and valuation metrics (Debt/Equity, P/E, P/B scores of 1) indicate financial leverage risk and expensive pricing. MaxLinear, by contrast, has weaker profitability scores (ROE and ROA at 1) but a more moderate balance sheet risk (Debt/Equity score of 2) and better relative value on price-to-book (score of 3). Overall, Broadcom’s profile is more unbalanced but leverages operational excellence, while MaxLinear presents a more cautious but less profitable stance.
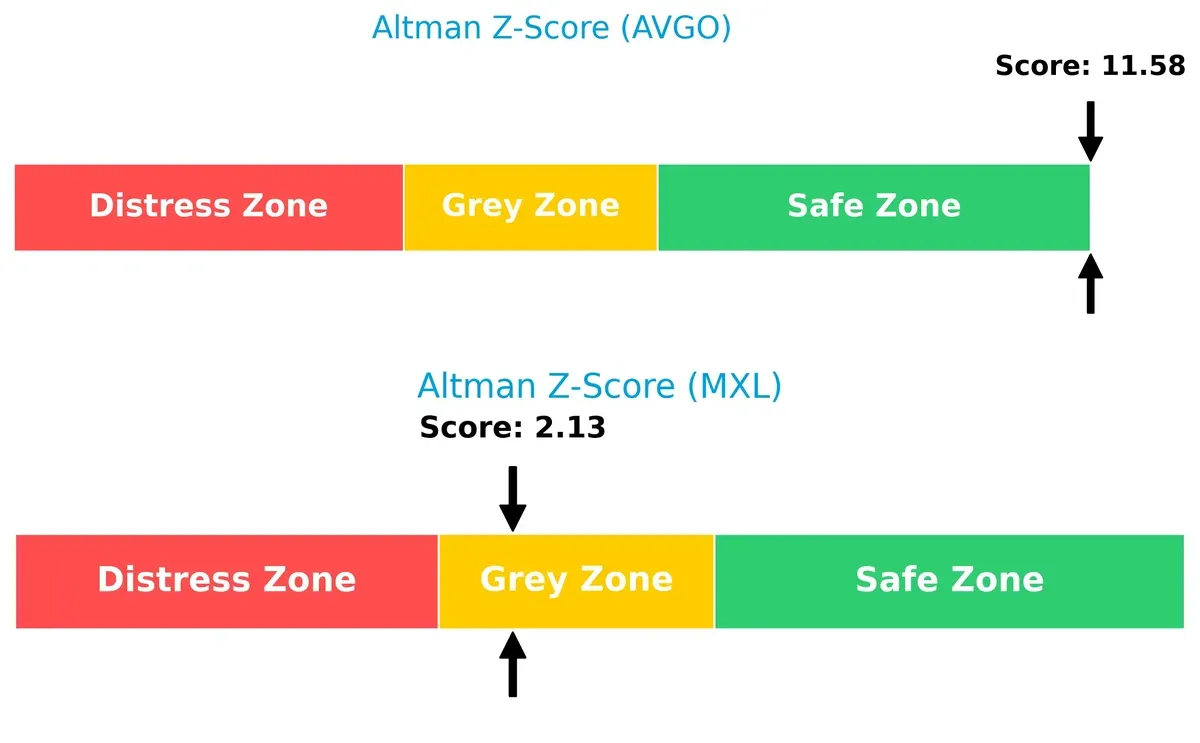
Bankruptcy Risk: Solvency Showdown
Broadcom’s Altman Z-Score of 11.58 places it firmly in the safe zone, indicating a very low bankruptcy risk. MaxLinear’s score of 2.13 situates it in the grey zone, reflecting moderate financial distress risk in this cycle:
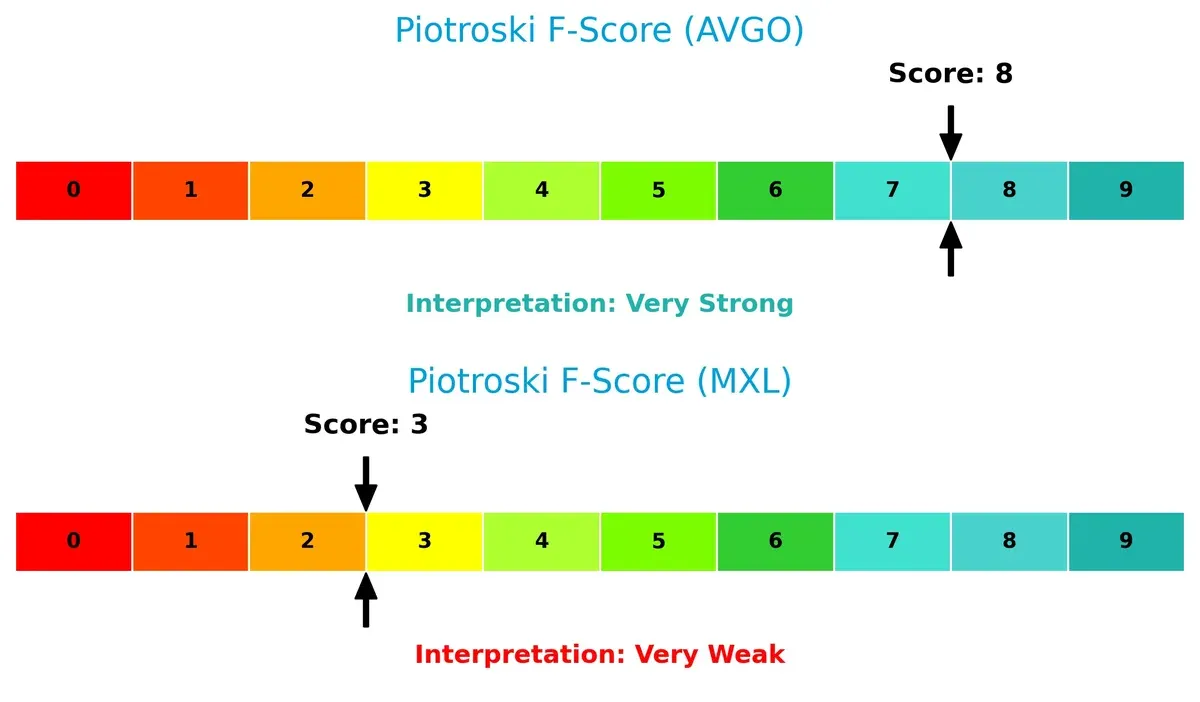
Financial Health: Quality of Operations
Broadcom scores an 8 on the Piotroski F-Score, demonstrating very strong financial health and operational quality. MaxLinear’s score of 3 signals weak internal metrics and potential red flags in its financial stability:
How are the two companies positioned?
This section dissects the operational DNA of Broadcom and MaxLinear by comparing their revenue distribution and internal dynamics. The goal is to confront their economic moats and identify which business model offers the most resilient, sustainable competitive advantage today.
Revenue Segmentation: The Strategic Mix
The following visual comparison dissects how Broadcom Inc. and MaxLinear, Inc. diversify their income streams and reveals their primary sector bets:
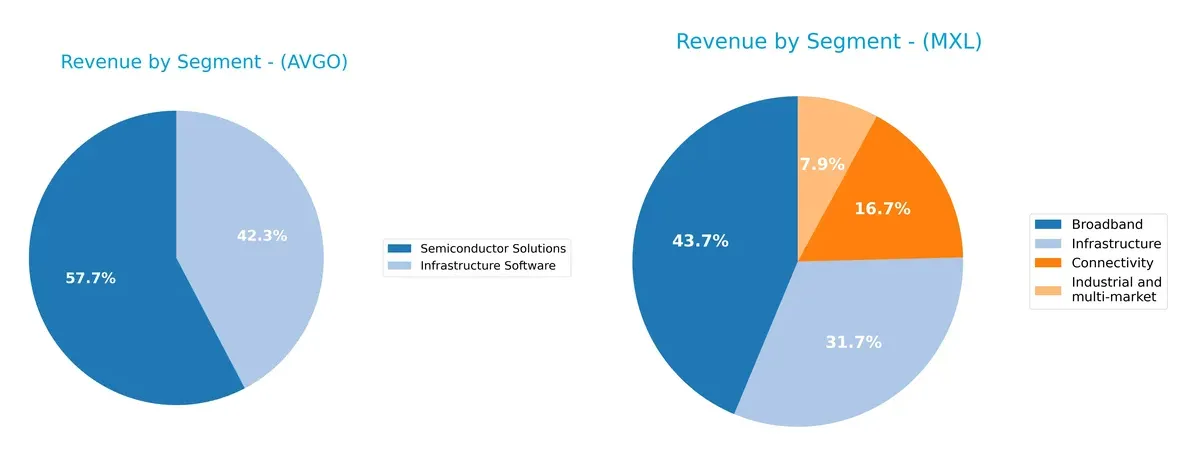
Broadcom Inc. anchors its revenue with $36.9B from Semiconductor Solutions and $27B from Infrastructure Software, showing a focused, high-value dual-segment dominance. MaxLinear, Inc. exhibits a more balanced mix across Broadband ($204M), Infrastructure ($148M), Connectivity ($78M), and Industrial ($37M). Broadcom’s concentration suggests strong ecosystem lock-in and scale advantages, while MaxLinear’s diversity mitigates single-segment risks but lacks Broadcom’s infrastructure heft.
Strengths and Weaknesses Comparison
This table compares the Strengths and Weaknesses of Broadcom Inc. and MaxLinear, Inc.:
Broadcom Inc. Strengths
- High net margin at 36.2%
- Strong ROE of 28.45%
- Favorable ROIC at 16.36%
- Solid current and quick ratios above 1.5
- Low debt-to-equity at 0.8
- Significant global presence with $35.9B Asia Pacific sales
MaxLinear, Inc. Strengths
- Favorable current ratio at 1.77
- Low debt-to-equity of 0.29
- Positive fixed asset turnover 4.65
- Diverse product segments including broadband and connectivity
- Favorable P/E ratio despite losses
- Moderate asset turnover 0.42
Broadcom Inc. Weaknesses
- High P/E at 73.87 signals overvaluation risk
- Unfavorable price-to-book at 21.01
- Asset turnover low at 0.37
- Dividend yield low at 0.65%
- Moderate interest coverage at 8.08
- Neutral debt-to-assets at 38%
MaxLinear, Inc. Weaknesses
- Negative net margin at -68%
- Negative ROE and ROIC
- WACC high at 11.7%
- Negative interest coverage at -13
- Unfavorable PB at 3.2
- No dividend yield
Broadcom shows strong profitability and financial resilience with a broad global footprint, but valuation metrics suggest caution. MaxLinear faces profitability and financial stress despite good liquidity and low leverage, highlighting operational challenges.
The Moat Duel: Analyzing Competitive Defensibility
A structural moat is the only barrier protecting long-term profits from relentless competition erosion. Let’s dissect the moats of two semiconductor players:
Broadcom Inc. (AVGO): Durable Cost and Scale Moat
Broadcom’s competitive edge stems from scale-driven cost advantage and diversified infrastructure software. Its 40.6% EBIT margin and 7%+ ROIC spread show sustained value creation. Expanding 5G and cloud markets will deepen this moat in 2026.
MaxLinear, Inc. (MXL): Emerging Niche Innovation Moat
MaxLinear relies on specialized mixed-signal SoCs for connectivity but shows a negative ROIC and shrinking margins. Its innovation focus contrasts Broadcom’s scale, but profitability and value creation remain weak, limiting moat durability despite growth opportunities.
Scale and Profitability vs. Innovation and Risk
Broadcom holds a deeper, more durable moat, proven by its robust ROIC and margin stability. MaxLinear’s niche innovation is promising but financially fragile. Broadcom is better positioned to defend market share amid intensifying semiconductor competition.
Which stock offers better returns?
The past year shows Broadcom Inc. surging over 150%, then decelerating recently, while MaxLinear, Inc. endured a 17% drop but saw a recent uptick in price.
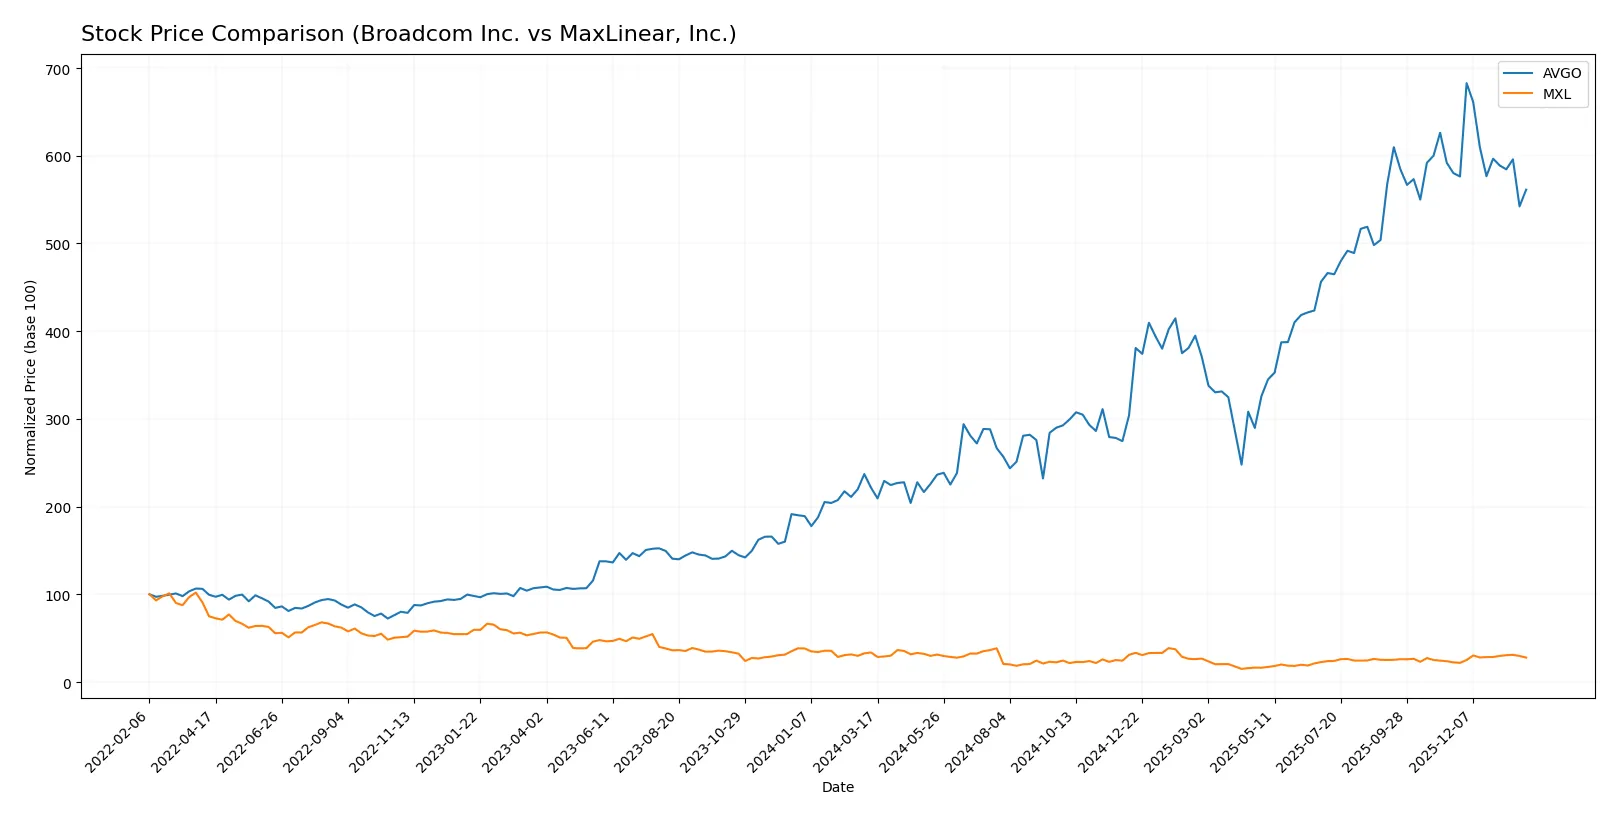
Trend Comparison
Broadcom Inc. posted a strong 153.15% gain over the past year, marking a bullish trend with decelerating momentum and a high volatility of 78.96. The stock peaked at 402.96 and bottomed at 120.47.
MaxLinear, Inc. experienced a 17.26% decline over the same period, indicating a bearish trend but with accelerating downside. The stock’s range was 9.31 to 24.05, showing low volatility of 3.37.
Comparing both, Broadcom delivered the highest market performance despite recent weakness, while MaxLinear’s overall trend remains negative despite recent recovery signs.
Target Prices
Analysts present a clear consensus on target prices for Broadcom Inc. and MaxLinear, Inc., reflecting moderate upside potential.
| Company | Target Low | Target High | Consensus |
|---|---|---|---|
| Broadcom Inc. | 370 | 510 | 450.12 |
| MaxLinear, Inc. | 15 | 25 | 21 |
Broadcom’s consensus target of $450 stands 36% above its current $331 price, indicating strong analyst confidence. MaxLinear’s $21 target suggests a 21% upside from $17.35, implying cautious optimism.

Don’t Let Luck Decide Your Entry Point
Optimize your entry points with our advanced ProRealTime indicators. You’ll get efficient buy signals with precise price targets for maximum performance. Start outperforming now!
How do institutions grade them?
Broadcom Inc. Grades
The following table summarizes recent institutional grades for Broadcom Inc.
| Grading Company | Action | New Grade | Date |
|---|---|---|---|
| Wells Fargo | Upgrade | Overweight | 2026-01-15 |
| Mizuho | Maintain | Outperform | 2026-01-09 |
| Truist Securities | Maintain | Buy | 2025-12-19 |
| UBS | Maintain | Buy | 2025-12-15 |
| B of A Securities | Maintain | Buy | 2025-12-12 |
| Mizuho | Maintain | Outperform | 2025-12-12 |
| TD Cowen | Maintain | Buy | 2025-12-12 |
| Benchmark | Maintain | Buy | 2025-12-12 |
| Keybanc | Maintain | Overweight | 2025-12-12 |
| Rosenblatt | Maintain | Buy | 2025-12-12 |
MaxLinear, Inc. Grades
This table presents recent institutional grades for MaxLinear, Inc.
| Grading Company | Action | New Grade | Date |
|---|---|---|---|
| Wells Fargo | Maintain | Equal Weight | 2026-01-30 |
| Benchmark | Maintain | Buy | 2026-01-16 |
| Benchmark | Maintain | Buy | 2025-10-24 |
| Benchmark | Maintain | Buy | 2025-10-17 |
| Benchmark | Maintain | Buy | 2025-09-02 |
| Loop Capital | Maintain | Hold | 2025-08-04 |
| Wells Fargo | Maintain | Equal Weight | 2025-07-24 |
| Benchmark | Maintain | Buy | 2025-07-24 |
| Susquehanna | Maintain | Neutral | 2025-07-24 |
| Susquehanna | Maintain | Neutral | 2025-07-22 |
Which company has the best grades?
Broadcom Inc. consistently receives strong buy and outperform ratings, including an upgrade to overweight. MaxLinear’s grades cluster around buy, hold, and neutral. Broadcom’s superior grading could signal greater institutional confidence, potentially influencing investor sentiment and portfolio allocations.
Risks specific to each company
The following categories identify the critical pressure points and systemic threats facing both firms in the 2026 market environment:
1. Market & Competition
Broadcom Inc.
- Dominates semiconductor infrastructure with a broad product portfolio but faces intense competition from large incumbents and new entrants.
MaxLinear, Inc.
- Operates in niche RF and mixed-signal SoCs but struggles with negative margins and a smaller market share against larger competitors.
2. Capital Structure & Debt
Broadcom Inc.
- Maintains moderate leverage (D/E 0.8) with solid interest coverage (8.08x), balancing growth and financial stability.
MaxLinear, Inc.
- Low leverage (D/E 0.29) reduces financial risk, but negative interest coverage (-13x) signals distress in servicing debt.
3. Stock Volatility
Broadcom Inc.
- Beta 1.22 indicates moderate volatility, typical for a large-cap tech stock with steady cash flows.
MaxLinear, Inc.
- Beta 1.77 reflects higher volatility, increasing risk for investors amid operational challenges.
4. Regulatory & Legal
Broadcom Inc.
- Faces regulatory scrutiny typical of large semiconductor firms, including antitrust and export controls.
MaxLinear, Inc.
- Smaller scale limits exposure but regulatory shifts in telecom and security standards could hinder growth.
5. Supply Chain & Operations
Broadcom Inc.
- Complex global supply chain with potential risks from geopolitical tensions and component shortages.
MaxLinear, Inc.
- More agile supply chain but dependent on third-party manufacturers, increasing operational risk.
6. ESG & Climate Transition
Broadcom Inc.
- Invests in ESG initiatives; however, energy-intensive semiconductor manufacturing poses transition risks.
MaxLinear, Inc.
- ESG efforts less transparent; as a smaller firm, may face rising pressure to align with climate policies.
7. Geopolitical Exposure
Broadcom Inc.
- Significant exposure to US-China tensions affecting semiconductor exports and technology access.
MaxLinear, Inc.
- Limited global footprint reduces direct geopolitical risk but supply chain vulnerabilities persist.
Which company shows a better risk-adjusted profile?
Broadcom’s dominant market position and strong financial metrics outweigh MaxLinear’s operational and financial distress risks. MaxLinear’s negative margins, weaker interest coverage, and greater stock volatility undermine its risk profile. Broadcom’s Altman Z-Score of 11.6 versus MaxLinear’s 2.1 confirms Broadcom’s safer financial footing. The most critical risk for Broadcom is geopolitical exposure, while MaxLinear’s financial instability is paramount. Broadcom’s better risk-adjusted profile aligns with its robust capital structure and operational scale.
Final Verdict: Which stock to choose?
Broadcom Inc. possesses a formidable superpower in its ability to generate consistently high returns on invested capital well above its cost of capital. This translates into durable competitive advantages and robust profitability. Its point of vigilance lies in its premium valuation multiples, which demand cautious timing. Broadcom suits investors with an appetite for aggressive growth anchored in quality.
MaxLinear, Inc. offers a strategic moat rooted in its niche market focus and ongoing investment in R&D, which could fuel future innovation. Relative to Broadcom, it presents a more cautious risk profile but currently struggles with profitability and value creation. MaxLinear might fit investors seeking growth at a reasonable price with a tolerance for turnaround risk.
If you prioritize durable value creation and proven profitability, Broadcom stands out due to its strong economic moat and expanding returns. However, if you seek a potential rebound play with lower valuation and a focus on innovation, MaxLinear offers better upside in a more speculative profile. Each represents an analytical scenario tailored to distinct investor strategies.
Disclaimer: Investment carries a risk of loss of initial capital. The past performance is not a reliable indicator of future results. Be sure to understand risks before making an investment decision.
Go Further
I encourage you to read the complete analyses of Broadcom Inc. and MaxLinear, Inc. to enhance your investment decisions: