In the fast-evolving semiconductor industry, Broadcom Inc. (AVGO) and Marvell Technology, Inc. (MRVL) stand out as key players driving innovation and growth. Both companies specialize in advanced chip design and infrastructure solutions, targeting overlapping markets such as data centers, networking, and storage. This comparison will explore their strategies and financial health to help you decide which company is the more compelling investment opportunity in 2026.
Table of contents
Companies Overview
I will begin the comparison between Broadcom and Marvell Technology by providing an overview of these two companies and their main differences.
Broadcom Overview
Broadcom Inc. is a global technology firm specializing in semiconductor and infrastructure software solutions. Headquartered in Palo Alto, California, it operates through four segments: Wired Infrastructure, Wireless Communications, Enterprise Storage, and Industrial & Other. Broadcom’s products serve diverse markets, including data center networking, telecommunications, smartphones, and factory automation, employing roughly 37,000 people.
Marvell Technology Overview
Marvell Technology, Inc., based in Wilmington, Delaware, develops and sells analog, mixed-signal, and digital integrated circuits. Its portfolio includes Ethernet solutions, storage controllers for HDDs and SSDs, and ASICs, supporting various storage interfaces and server connectivity. With around 7,000 employees, Marvell has a global presence across the US and Asia, focusing on semiconductor innovation since 1995.
Key similarities and differences
Both companies operate in the semiconductor industry, providing critical components for data storage, networking, and communications. Broadcom is significantly larger, with a broader product range and workforce, while Marvell focuses more narrowly on integrated circuits and storage solutions. Broadcom’s diversified segment structure contrasts with Marvell’s emphasis on Ethernet and storage technologies, reflecting their distinct business models and market strategies.
Income Statement Comparison
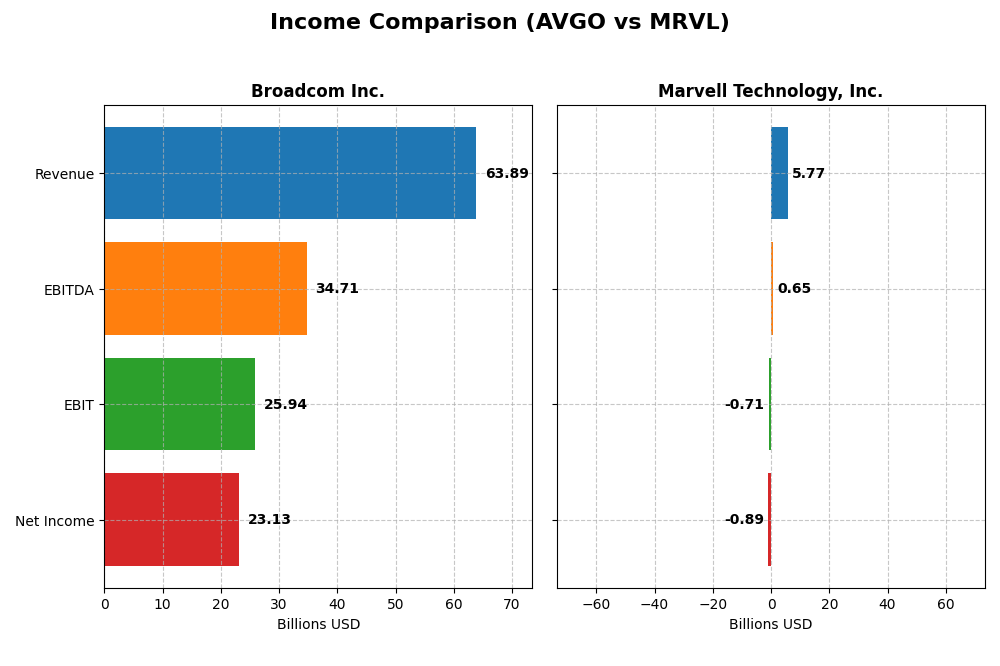
Below is a side-by-side comparison of key income statement metrics for Broadcom Inc. and Marvell Technology, Inc. for their most recent fiscal year.
| Metric | Broadcom Inc. (AVGO) | Marvell Technology, Inc. (MRVL) |
|---|---|---|
| Market Cap | 1.64T | 77.1B |
| Revenue | 63.9B | 5.77B |
| EBITDA | 34.7B | 652M |
| EBIT | 25.9B | -705M |
| Net Income | 23.1B | -885M |
| EPS | 4.91 | -1.02 |
| Fiscal Year | 2025 | 2025 |
Income Statement Interpretations
Broadcom Inc.
Broadcom Inc. shows strong revenue growth from $27.45B in 2021 to $63.89B in 2025, with net income rising markedly from $6.44B to $23.13B. Margins have improved significantly, with a gross margin of 67.77% and net margin of 36.2% in 2025. The latest year’s performance highlights accelerated growth, notably an 87% increase in EBIT and a 216.7% rise in net margin, indicating robust profitability enhancement.
Marvell Technology, Inc.
Marvell Technology’s revenue increased from $2.97B in 2021 to $5.77B in 2025, though net income remained negative, at -$885M in 2025. Gross margin stands at 41.31%, but EBIT and net margins are unfavorable at -12.23% and -15.35%, respectively. The most recent year shows modest revenue growth of 4.7%, yet EBIT declined by nearly 29%, reflecting ongoing challenges in controlling operating expenses and achieving profitability.
Which one has the stronger fundamentals?
Broadcom’s income statement reveals favorable trends across nearly all metrics, with substantial revenue and net income growth alongside improving margins, demonstrating strong fundamentals. Conversely, Marvell exhibits weaker profitability with persistent losses and unfavorable EBIT and net margins despite revenue gains. Thus, Broadcom’s financials present a more robust and consistent income statement profile compared to Marvell’s.
Financial Ratios Comparison
Below is a comparison of the most recent key financial ratios for Broadcom Inc. and Marvell Technology, Inc. based on their fiscal year 2025 data.
| Ratios | Broadcom Inc. (AVGO) | Marvell Technology, Inc. (MRVL) |
|---|---|---|
| ROE | 28.4% | -6.6% |
| ROIC | 16.7% | -3.9% |
| P/E | 73.9 | -110.4 |
| P/B | 21.0 | 7.3 |
| Current Ratio | 1.71 | 1.54 |
| Quick Ratio | 1.58 | 1.03 |
| D/E | 0.80 | 0.32 |
| Debt-to-Assets | 38.1% | 21.5% |
| Interest Coverage | 7.94 | -3.80 |
| Asset Turnover | 0.37 | 0.29 |
| Fixed Asset Turnover | 25.3 | 5.56 |
| Payout Ratio | 48.2% | -23.4% |
| Dividend Yield | 0.65% | 0.21% |
Interpretation of the Ratios
Broadcom Inc.
Broadcom’s financial ratios show a generally strong profile with favorable net margin at 36.2%, ROE at 28.45%, and ROIC at 16.65%. Some concerns include a high PE ratio of 73.87 and a PB ratio of 21.01, both unfavorable. The current and quick ratios are solid, indicating good liquidity. Its dividend yield is modest at 0.65%, supported by stable payouts and buybacks, though yield remains low.
Marvell Technology, Inc.
Marvell’s ratios reveal weaknesses, with negative net margin (-15.35%), ROE (-6.59%), and ROIC (-3.88%), signaling operational challenges. The company maintains favorable liquidity ratios and low leverage, but interest coverage is negative at -3.72, raising solvency concerns. Dividend yield is minimal at 0.21%, reflecting limited shareholder returns amid ongoing investments and growth efforts.
Which one has the best ratios?
Broadcom demonstrates a more favorable ratio profile overall, with stronger profitability, liquidity, and coverage ratios, despite some valuation concerns. Marvell struggles with negative profitability and coverage metrics, though it maintains financial discipline in leverage and liquidity. Broadcom’s ratios suggest a more stable financial position compared to Marvell’s unfavorable evaluations.
Strategic Positioning
This section compares the strategic positioning of Broadcom Inc. and Marvell Technology, Inc., focusing on Market position, Key segments, and Exposure to technological disruption:
Broadcom Inc.
- Leading market cap of 1.64T in semiconductors, facing competitive pressure in multiple segments.
- Diversified segments including Infrastructure Software and Semiconductor Solutions driving revenues.
- Exposure to disruption through integration of complex subsystems and firmware across diverse end-products.
Marvell Technology, Inc.
- Smaller 77B market cap with higher beta, indicating more volatility and competitive challenges.
- Concentrated on Ethernet solutions, storage controllers, and processors across multiple regions.
- Focused on integrated circuits and storage technology with geographic operational diversity.
Broadcom Inc. vs Marvell Technology, Inc. Positioning
Broadcom shows a diversified business model with multiple revenue streams across software and semiconductors, while Marvell focuses on specialized semiconductor solutions and networking products. Broadcom’s scale offers broad market reach, whereas Marvell’s narrower focus may limit diversification but targets specific technology niches.
Which has the best competitive advantage?
Broadcom holds a very favorable moat with growing ROIC above WACC, indicating strong value creation and durable competitive advantage. Marvell’s declining ROIC and value destruction suggest a very unfavorable moat and weaker competitive positioning.
Stock Comparison
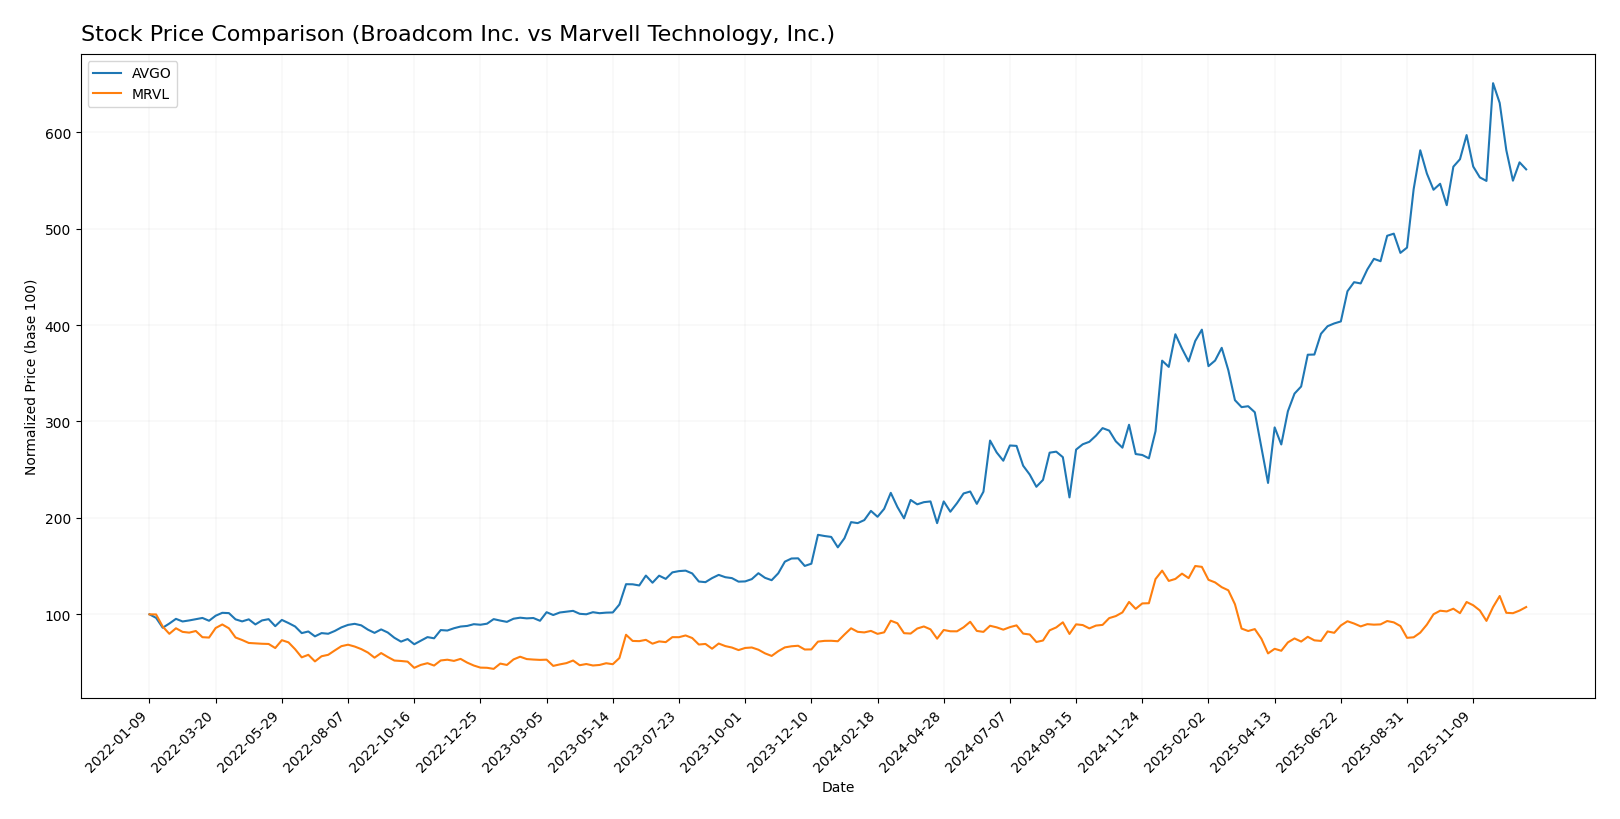
The stock prices of Broadcom Inc. (AVGO) and Marvell Technology, Inc. (MRVL) have exhibited significant gains over the past 12 months, with Broadcom showing stronger overall appreciation despite recent minor fluctuations.
Trend Analysis
Broadcom Inc. (AVGO) experienced a strong bullish trend over the past year, with a 170.86% price increase. The trend shows deceleration and a high volatility level, with prices ranging from 120.47 to 402.96.
Marvell Technology, Inc. (MRVL) also followed a bullish trend with a 29.87% rise over the same period. This trend similarly decelerated, with moderate volatility and prices fluctuating between 49.43 and 124.76.
Comparing the two, Broadcom’s stock delivered the highest market performance over the past year, outperforming Marvell significantly in terms of price appreciation.
Target Prices
The consensus target prices for Broadcom Inc. and Marvell Technology, Inc. indicate promising upside potential according to verified analysts.
| Company | Target High | Target Low | Consensus |
|---|---|---|---|
| Broadcom Inc. | 510 | 420 | 457.64 |
| Marvell Technology, Inc. | 156 | 80 | 116.7 |
Analysts expect Broadcom’s price to rise significantly from its current 347.62 USD, while Marvell’s consensus target of 116.7 USD suggests notable appreciation above its current 89.39 USD price.
Analyst Opinions Comparison
This section compares analysts’ ratings and grades for Broadcom Inc. and Marvell Technology, Inc.:
Rating Comparison
Broadcom Inc. Rating
- Rating: B, assessed as Very Favorable by analysts.
- Discounted Cash Flow Score: 3, indicating a Moderate view.
- ROE Score: 5, Very Favorable, showing strong equity returns.
- ROA Score: 5, Very Favorable, demonstrating excellent asset use.
- Debt To Equity Score: 1, Very Unfavorable, indicating higher leverage risk.
- Overall Score: 3, Moderate overall financial standing.
Marvell Technology, Inc. Rating
- Rating: B+, also considered Very Favorable by analysts.
- Discounted Cash Flow Score: 3, similarly Moderate.
- ROE Score: 4, Favorable but lower than Broadcom’s.
- ROA Score: 5, equally Very Favorable.
- Debt To Equity Score: 2, Moderate, suggesting better balance sheet strength.
- Overall Score: 3, also Moderate overall.
Which one is the best rated?
Marvell holds a slightly better composite rating (B+) compared to Broadcom’s B. Broadcom excels in ROE but has a weaker debt profile, while Marvell presents a more balanced financial risk and a favorable ROE. Overall, both have moderate overall scores.
Scores Comparison
Here is a comparison of the financial health scores for Broadcom Inc. and Marvell Technology, Inc.:
Broadcom Inc. Scores
- Altman Z-Score: 11.42, indicating a safe zone with very low bankruptcy risk.
- Piotroski Score: 8, classified as very strong financial health.
Marvell Technology Scores
- Altman Z-Score: 6.95, indicating a safe zone with low bankruptcy risk.
- Piotroski Score: 7, classified as strong financial health.
Which company has the best scores?
Broadcom Inc. scores higher on both Altman Z-Score and Piotroski Score, reflecting stronger financial health compared to Marvell Technology, Inc., based strictly on the provided data.
Grades Comparison
Here is a comparison of the most recent grades assigned by reputable grading companies for both Broadcom Inc. and Marvell Technology, Inc.:
Broadcom Inc. Grades
The following table shows Broadcom’s latest grades from respected financial institutions:
| Grading Company | Action | New Grade | Date |
|---|---|---|---|
| Truist Securities | Maintain | Buy | 2025-12-19 |
| UBS | Maintain | Buy | 2025-12-15 |
| Morgan Stanley | Maintain | Overweight | 2025-12-12 |
| JP Morgan | Maintain | Overweight | 2025-12-12 |
| Citigroup | Maintain | Buy | 2025-12-12 |
| Rosenblatt | Maintain | Buy | 2025-12-12 |
| Bernstein | Maintain | Outperform | 2025-12-12 |
| Piper Sandler | Maintain | Overweight | 2025-12-12 |
| Mizuho | Maintain | Outperform | 2025-12-12 |
| Barclays | Maintain | Overweight | 2025-12-12 |
Broadcom’s grades consistently indicate strong positive sentiment, with all firms maintaining buy or outperform ratings.
Marvell Technology, Inc. Grades
Below is the latest grading data available for Marvell Technology, Inc.:
| Grading Company | Action | New Grade | Date |
|---|---|---|---|
| Benchmark | Downgrade | Hold | 2025-12-08 |
| Rosenblatt | Maintain | Buy | 2025-12-03 |
| Goldman Sachs | Maintain | Neutral | 2025-12-03 |
| B. Riley Securities | Maintain | Buy | 2025-12-03 |
| Jefferies | Maintain | Buy | 2025-12-03 |
| Keybanc | Maintain | Overweight | 2025-12-03 |
| Deutsche Bank | Maintain | Buy | 2025-12-03 |
| Susquehanna | Maintain | Positive | 2025-12-03 |
| Evercore ISI Group | Maintain | Outperform | 2025-12-03 |
| Benchmark | Maintain | Buy | 2025-12-03 |
Marvell’s grades show generally favorable ratings but include a recent downgrade to Hold, indicating some caution among analysts.
Which company has the best grades?
Broadcom has received uniformly strong buy and outperform grades, while Marvell’s ratings are positive but include a notable downgrade. This contrast may influence investor perception of relative stability and growth prospects between the two stocks.
Strengths and Weaknesses
Below is a comparison table summarizing the key strengths and weaknesses of Broadcom Inc. (AVGO) and Marvell Technology, Inc. (MRVL) based on the most recent financial and operational data.
| Criterion | Broadcom Inc. (AVGO) | Marvell Technology, Inc. (MRVL) |
|---|---|---|
| Diversification | Strong diversification with major segments: Semiconductor Solutions ($36.9B) and Infrastructure Software ($27.0B) in 2025 | More concentrated revenue streams, with Data Center leading at $4.16B and smaller contributions from other segments |
| Profitability | High profitability: net margin 36.2%, ROIC 16.65%, growing ROIC trend, value creator | Negative profitability: net margin -15.35%, ROIC -3.88%, declining ROIC trend, value destroyer |
| Innovation | Demonstrates durable competitive advantage with consistent value creation and high fixed asset turnover (25.25) | Struggles to maintain profitability and efficiency despite some favorable asset turnover (5.56) |
| Global presence | Well-established global presence with diversified business lines supporting broad market reach | Global footprint focused on niche markets but with less scale and profitability |
| Market Share | Strong market position supported by favorable financial ratios and growing revenue streams | Weaker market position with unfavorable financial ratios and shrinking returns |
Key takeaways: Broadcom stands out with robust diversification, consistent profitability, and a durable competitive moat, making it a safer investment choice. Marvell, however, faces significant challenges with declining profitability and value destruction, requiring cautious consideration before investing.
Risk Analysis
Below is a comparative risk assessment table for Broadcom Inc. (AVGO) and Marvell Technology, Inc. (MRVL) based on the most recent data from 2025:
| Metric | Broadcom Inc. (AVGO) | Marvell Technology, Inc. (MRVL) |
|---|---|---|
| Market Risk | Moderate beta (1.20), stable large cap | Higher beta (1.93), more volatile mid cap |
| Debt level | Moderate debt-to-equity (0.8), interest coverage solid (8.08x) | Low debt-to-equity (0.32), but negative interest coverage (-3.72x) |
| Regulatory Risk | Moderate, US-based global operations | Moderate, with significant international exposure |
| Operational Risk | Diversified segments, favorable ROE and margins | Negative profitability, unfavorable ROE and margins |
| Environmental Risk | Exposure to semiconductor manufacturing impacts | Similar exposure, less diversified |
| Geopolitical Risk | US-China tensions impact supply chains | High, due to extensive operations in Asia |
In synthesis, Broadcom presents moderate market and debt risks but benefits from strong profitability and stable financial health, making operational risk manageable. Marvell faces higher market volatility, operational challenges due to negative margins, and geopolitical risks from broad Asian operations. The most impactful risks for investors are Marvell’s weak profitability and geopolitical exposure, while Broadcom’s elevated valuation ratios pose caution despite robust fundamentals.
Which Stock to Choose?
Broadcom Inc. (AVGO) shows a strong income evolution with a 23.87% revenue growth in 2025 and favorable profitability indicators, including a 36.2% net margin and 28.45% ROE. Its debt levels are moderate, and the rating is very favorable, reflecting solid financial health and value creation.
Marvell Technology, Inc. (MRVL) exhibits modest revenue growth of 4.71% in 2025 but negative profitability metrics, such as a -15.35% net margin and -6.59% ROE. Its debt profile appears conservative; however, the overall rating is very favorable despite unfavorable financial ratios and value destruction concerns.
For investors prioritizing stable value creation and robust profitability, AVGO might appear more favorable given its very favorable rating and strong income statement. Conversely, MRVL could be seen as suitable for those with a higher risk tolerance seeking potential turnaround opportunities despite its unfavorable financial ratios and negative income trends.
Disclaimer: Investment carries a risk of loss of initial capital. The past performance is not a reliable indicator of future results. Be sure to understand risks before making an investment decision.
Go Further
I encourage you to read the complete analyses of Broadcom Inc. and Marvell Technology, Inc. to enhance your investment decisions: