In the fast-evolving semiconductor industry, Broadcom Inc. and Lattice Semiconductor Corporation stand out for their innovation and market presence. Broadcom, a tech giant with a diversified portfolio, contrasts with Lattice, a specialist in programmable logic devices. Both companies compete in overlapping sectors, making their comparison essential for investors seeking growth and stability. Join me as we analyze which company offers the most compelling investment opportunity in 2026.

Table of contents
Companies Overview
I will begin the comparison between Broadcom Inc. and Lattice Semiconductor Corporation by providing an overview of these two companies and their main differences.
Broadcom Inc. Overview
Broadcom Inc. is a global technology firm specializing in semiconductor and infrastructure software solutions. Headquartered in Palo Alto, California, it operates through four segments: Wired Infrastructure, Wireless Communications, Enterprise Storage, and Industrial & Other. Broadcom’s products serve diverse markets, including data centers, telecommunications, smartphones, and industrial automation, employing 37,000 people worldwide.
Lattice Semiconductor Corporation Overview
Lattice Semiconductor Corporation develops and sells semiconductor products globally, focusing on field programmable gate arrays and video connectivity application-specific products. Based in Hillsboro, Oregon, it targets original equipment manufacturers across communications, computing, consumer, industrial, and automotive sectors. The company employs approximately 1,110 people and generates revenue through direct sales and a network of independent distributors.
Key similarities and differences
Both Broadcom and Lattice operate in the semiconductor industry and serve technology-driven markets. Broadcom’s business is broader, with multiple segments and a larger workforce, while Lattice focuses on niche programmable logic devices and IP licensing. Broadcom’s scale and product diversity contrast with Lattice’s specialization in FPGA and video connectivity solutions. Both companies are publicly traded on NASDAQ and actively engage with global customers.
Income Statement Comparison
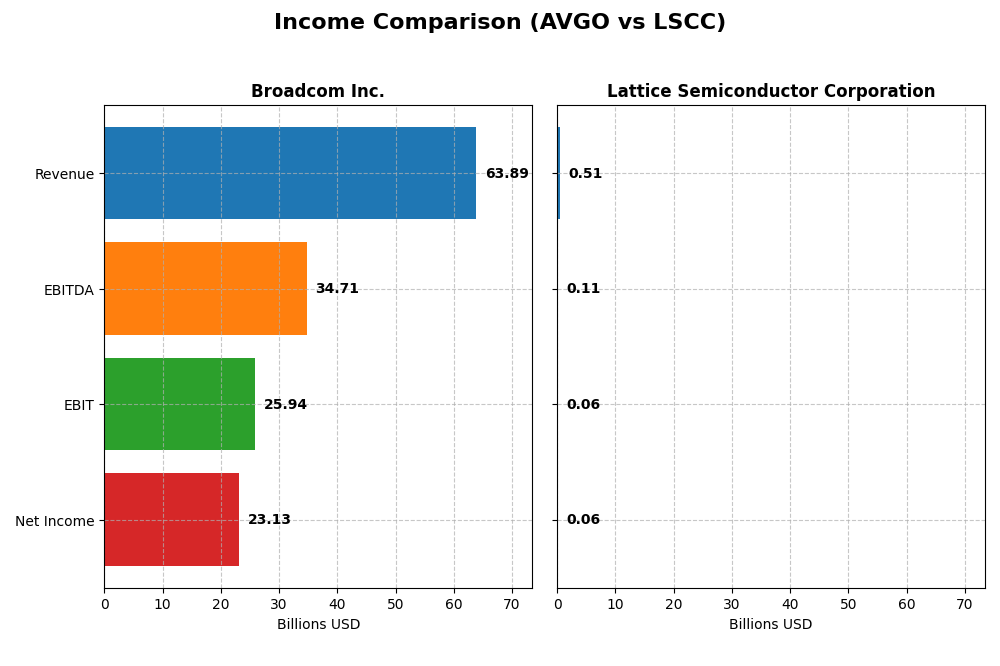
This table presents a side-by-side comparison of key income statement metrics for Broadcom Inc. and Lattice Semiconductor Corporation for their most recent fiscal years.
| Metric | Broadcom Inc. (AVGO) | Lattice Semiconductor Corporation (LSCC) |
|---|---|---|
| Market Cap | 1.6T | 11.7B |
| Revenue | 63.9B | 509M |
| EBITDA | 34.7B | 107M |
| EBIT | 25.9B | 61M |
| Net Income | 23.1B | 61M |
| EPS | 4.91 | 0.44 |
| Fiscal Year | 2025 | 2024 |
Income Statement Interpretations
Broadcom Inc.
Broadcom’s revenue grew significantly from $27.45B in 2021 to $63.89B in 2025, with net income rising from $6.44B to $23.13B. Margins improved notably, with a gross margin of 67.77% and net margin of 36.2% in 2025. The latest year saw strong growth momentum, including a 23.87% revenue increase and a 216.69% jump in net margin, signaling robust profitability expansion.
Lattice Semiconductor Corporation
Lattice Semiconductor’s revenue increased moderately from $408M in 2020 to $509M in 2024, with net income rising from $47M to $61M. Margins remain favorable, with a 66.82% gross margin and 12% net margin in 2024. However, the most recent year showed a 30.9% revenue decline and a 65.85% drop in net margin, reflecting a challenging period despite longer-term growth.
Which one has the stronger fundamentals?
Broadcom demonstrates stronger fundamentals with substantial revenue and net income growth, higher and expanding margins, and mostly favorable income statement metrics. Lattice Semiconductor shows moderate overall growth but faces recent declines in key profitability metrics. Broadcom’s consistent margin improvements and significant earnings growth provide a more robust financial foundation.
Financial Ratios Comparison
This table presents a side-by-side comparison of key financial ratios for Broadcom Inc. and Lattice Semiconductor Corporation based on their most recent fiscal year data.
| Ratios | Broadcom Inc. (AVGO) | Lattice Semiconductor (LSCC) |
|---|---|---|
| ROE | 28.45% | 8.60% |
| ROIC | 16.36% | 4.59% |
| P/E | 73.87 | 132.74 |
| P/B | 21.01 | 11.41 |
| Current Ratio | 1.71 | 3.66 |
| Quick Ratio | 1.58 | 2.62 |
| D/E (Debt-to-Equity) | 0.80 | 0.02 |
| Debt-to-Assets | 38.07% | 1.81% |
| Interest Coverage | 7.94 | 129.54 |
| Asset Turnover | 0.37 | 0.60 |
| Fixed Asset Turnover | 25.25 | 7.62 |
| Payout Ratio | 48.18% | 0% |
| Dividend Yield | 0.65% | 0% |
Interpretation of the Ratios
Broadcom Inc.
Broadcom displays strong profitability with a net margin of 36.2% and a return on equity of 28.45%, signaling efficient earnings generation. However, its high price-to-earnings ratio of 73.87 and price-to-book ratio of 21.01 suggest expensive valuation levels. The company pays dividends, but the dividend yield is modest at 0.65%, indicating limited income return despite sustained payouts.
Lattice Semiconductor Corporation
Lattice Semiconductor shows a moderate net margin of 12% but weaker returns, with an 8.6% ROE and 4.59% ROIC. Its valuation ratios are high, with a P/E of 132.74 and P/B of 11.41, raising concerns about overvaluation. The company does not pay dividends, likely reflecting a reinvestment strategy in its growth phase, supported by strong interest coverage and low debt levels.
Which one has the best ratios?
Broadcom’s ratios are generally more favorable, highlighting superior profitability and balanced leverage, though its valuation remains expensive. Lattice Semiconductor has mixed metrics, with weaker profitability and high valuation, although it benefits from low debt and strong coverage. Overall, Broadcom exhibits a slightly more favorable financial profile based on the evaluated ratios.
Strategic Positioning
This section compares the strategic positioning of Broadcom Inc. and Lattice Semiconductor Corporation, focusing on Market position, Key segments, and Exposure to technological disruption:
Broadcom Inc.
- Leading global technology company with large market cap and established NASDAQ presence.
- Operates through four segments: Wired Infrastructure, Wireless Communications, Enterprise Storage, Industrial & Other.
- Offers complex semiconductor and infrastructure software solutions including firmware and mechanical hardware.
Lattice Semiconductor Corporation
- Smaller market cap semiconductor firm with regional sales focus in Asia, Europe, Americas.
- Specializes in field programmable gate arrays and video connectivity products, licensing IP technology.
- Focuses on product innovation in programmable semiconductors, potentially sensitive to technology evolution.
Broadcom Inc. vs Lattice Semiconductor Corporation Positioning
Broadcom demonstrates a diversified portfolio spanning multiple semiconductor and software segments, providing broad industry exposure. Lattice has a more concentrated focus on programmable devices and IP licensing, which may limit scale but targets niche markets. Both face different competitive dynamics based on their segment breadth.
Which has the best competitive advantage?
Broadcom presents a very favorable moat with growing ROIC and value creation, indicating a durable competitive advantage. Lattice shows a very unfavorable moat with declining ROIC, reflecting challenges in sustaining profitability and competitive strength.
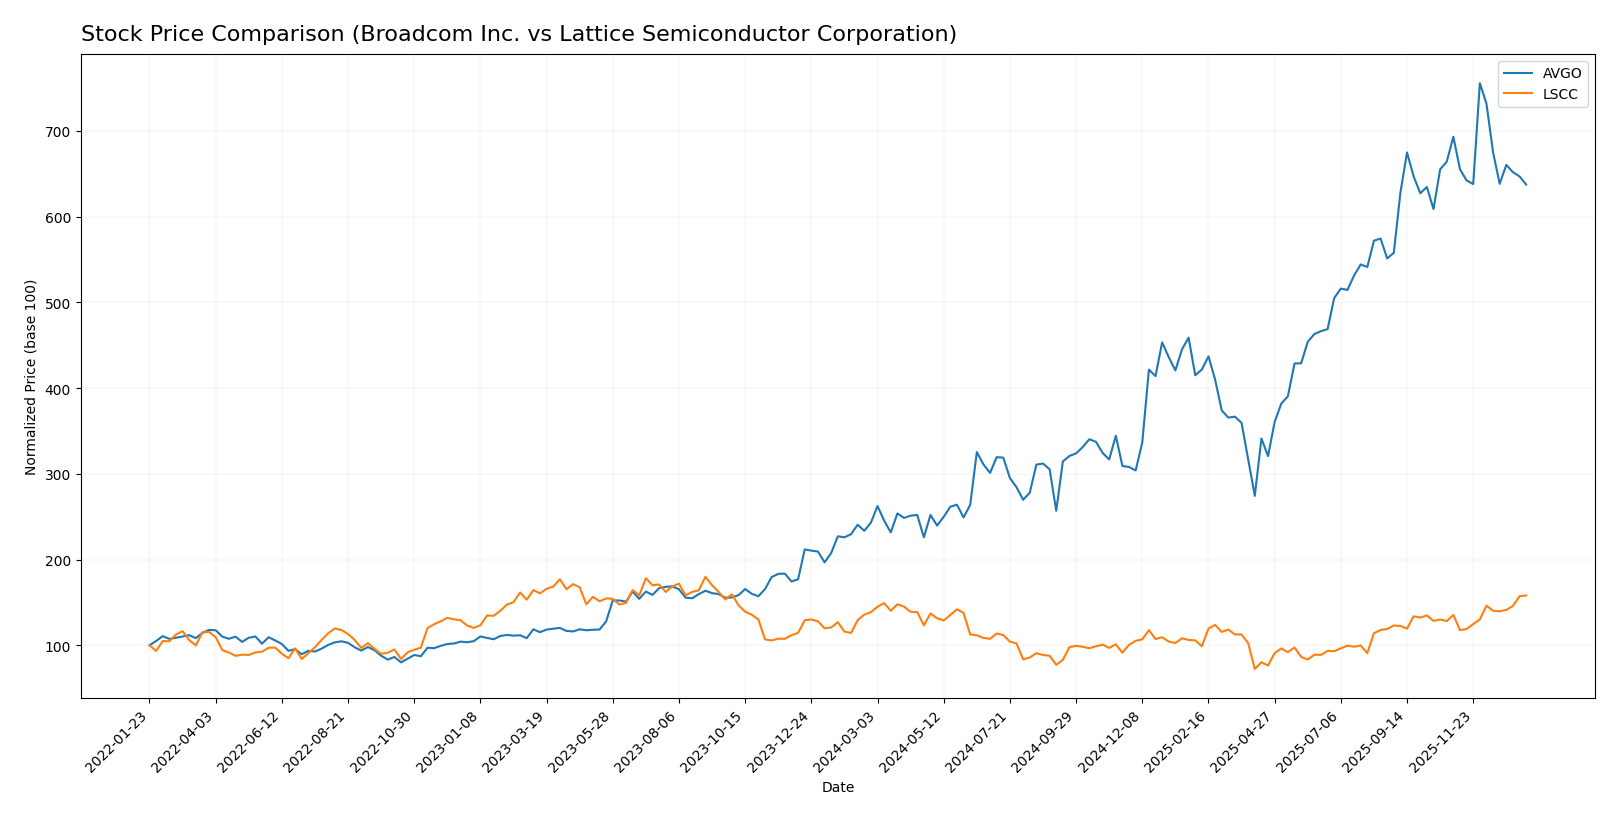
Stock Comparison
The stock prices of Broadcom Inc. (AVGO) and Lattice Semiconductor Corporation (LSCC) over the past year show significant bullish trends with distinct recent trading dynamics and varying acceleration patterns.
Trend Analysis
Broadcom Inc. (AVGO) experienced a strong overall bullish trend with a 162.18% price increase over the last 12 months, though recent months show a slight bearish reversal with an 8.05% decline and decelerating momentum.
Lattice Semiconductor Corporation (LSCC) posted a moderate bullish trend with a 14.09% gain over the year, accelerating recently with a 16.89% price rise and strong buyer dominance in trading volume.
Comparing both, AVGO delivered the highest market performance with a substantially larger overall price increase, despite its recent short-term weakness relative to LSCC’s accelerating uptrend.
Target Prices
The current analyst consensus shows a positive outlook for Broadcom Inc. and Lattice Semiconductor Corporation.
| Company | Target High | Target Low | Consensus |
|---|---|---|---|
| Broadcom Inc. | 510 | 370 | 454.8 |
| Lattice Semiconductor Corporation | 105 | 65 | 83 |
Analysts expect Broadcom’s stock to rise significantly above its current price of $339.89, while Lattice Semiconductor’s consensus target of $83 is slightly below its current price of $85.28, indicating mixed near-term sentiment.
Analyst Opinions Comparison
This section compares analysts’ ratings and financial scores for Broadcom Inc. and Lattice Semiconductor Corporation:
Rating Comparison
Broadcom Inc. Rating
- Rating: B rating categorized as Very Favorable by analysts.
- Discounted Cash Flow Score: Moderate score of 3.
- ROE Score: Very Favorable top score of 5, indicating strong profit generation.
- ROA Score: Very Favorable top score of 5, reflecting effective asset use.
- Debt To Equity Score: Very Unfavorable score of 1, indicating higher financial risk.
- Overall Score: Moderate score of 3.
Lattice Semiconductor Corporation Rating
- Rating: B- rating also considered Very Favorable by analysts.
- Discounted Cash Flow Score: Moderate score of 3.
- ROE Score: Moderate score of 2, showing less efficiency in equity profit.
- ROA Score: Moderate score of 3, moderate asset utilization.
- Debt To Equity Score: Favorable score of 4, showing lower financial risk.
- Overall Score: Moderate score of 2.
Which one is the best rated?
Broadcom Inc. holds a higher overall score and stronger ROE and ROA scores, but a weaker debt-to-equity rating compared to Lattice Semiconductor. Broadcom’s rating is slightly better overall based on these metrics.
Scores Comparison
Here is a comparison of the Altman Z-Score and Piotroski Score for Broadcom Inc. and Lattice Semiconductor Corporation:
Broadcom Inc. Scores
- Altman Z-Score: 12.13, indicating a very safe zone from bankruptcy risk.
- Piotroski Score: 8, classified as very strong financial health.
Lattice Semiconductor Scores
- Altman Z-Score: 52.69, indicating an extremely safe zone from bankruptcy risk.
- Piotroski Score: 5, classified as average financial health.
Which company has the best scores?
Lattice Semiconductor has a notably higher Altman Z-Score, suggesting lower bankruptcy risk. Broadcom exhibits a stronger Piotroski Score, indicating better overall financial strength. The best scores depend on which metric investors prioritize.
Grades Comparison
The following is a comparison of recent reliable grades from established grading companies for Broadcom Inc. and Lattice Semiconductor Corporation:
Broadcom Inc. Grades
This table presents the latest grades assigned by reputable grading companies for Broadcom Inc.:
| Grading Company | Action | New Grade | Date |
|---|---|---|---|
| Mizuho | Maintain | Outperform | 2026-01-09 |
| Truist Securities | Maintain | Buy | 2025-12-19 |
| UBS | Maintain | Buy | 2025-12-15 |
| Benchmark | Maintain | Buy | 2025-12-12 |
| Rosenblatt | Maintain | Buy | 2025-12-12 |
| Piper Sandler | Maintain | Overweight | 2025-12-12 |
| TD Cowen | Maintain | Buy | 2025-12-12 |
| B of A Securities | Maintain | Buy | 2025-12-12 |
| JP Morgan | Maintain | Overweight | 2025-12-12 |
| Mizuho | Maintain | Outperform | 2025-12-12 |
Broadcom Inc. consistently receives buy and outperform ratings, reflecting strong analyst confidence and positive market outlook.
Lattice Semiconductor Corporation Grades
This table summarizes recent grades from known grading companies for Lattice Semiconductor Corporation:
| Grading Company | Action | New Grade | Date |
|---|---|---|---|
| Keybanc | Maintain | Overweight | 2026-01-13 |
| Stifel | Maintain | Buy | 2025-11-04 |
| Baird | Maintain | Outperform | 2025-11-04 |
| Needham | Maintain | Buy | 2025-11-04 |
| Rosenblatt | Maintain | Buy | 2025-11-04 |
| Benchmark | Maintain | Buy | 2025-11-04 |
| Susquehanna | Maintain | Positive | 2025-10-22 |
| Keybanc | Maintain | Overweight | 2025-09-30 |
| Needham | Maintain | Buy | 2025-09-22 |
| Benchmark | Maintain | Buy | 2025-09-11 |
Lattice Semiconductor shows a solid pattern of buy and overweight ratings, suggesting moderate to strong optimism from analysts.
Which company has the best grades?
Both companies hold a consensus “Buy” rating, but Broadcom Inc. exhibits a higher volume of buy and outperform grades from a broader set of grading firms. This may indicate stronger analyst conviction, potentially affecting investor sentiment and perceived stability.
Strengths and Weaknesses
The table below summarizes the key strengths and weaknesses of Broadcom Inc. (AVGO) and Lattice Semiconductor Corporation (LSCC) based on their latest financial performance, market presence, and innovation capabilities.
| Criterion | Broadcom Inc. (AVGO) | Lattice Semiconductor Corporation (LSCC) |
|---|---|---|
| Diversification | Highly diversified with two main segments: Semiconductor Solutions ($36.9B in 2025) and Infrastructure Software ($27.0B in 2025). | Limited diversification, mainly focused on License and Service with revenues around $17M in 2022. |
| Profitability | Strong profitability: Net margin 36.2%, ROIC 16.36%, ROE 28.45%, with a very favorable growing ROIC trend. | Moderate profitability: Net margin 12%, ROIC 4.59%, ROE 8.6%, but declining ROIC and value destruction. |
| Innovation | Robust innovation supported by high fixed asset turnover (25.25) and consistent value creation. | Lower innovation impact; asset turnover moderate (0.6) with unfavorable ROIC trend. |
| Global presence | Extensive global footprint with large-scale product offerings in semiconductors and software. | Smaller scale and limited global footprint focused on niche semiconductor market. |
| Market Share | Significant market share in both semiconductor and software sectors, benefiting from industry leadership. | Smaller market share with challenges in scaling and maintaining profitability. |
In summary, Broadcom demonstrates a strong, diversified business model with consistent value creation and efficient capital use, while Lattice Semiconductor faces challenges in profitability and scale, reflected in its declining ROIC and limited diversification. Investors should weigh Broadcom’s durable competitive advantage against Lattice’s higher risk profile.
Risk Analysis
Below is a comparative risk table for Broadcom Inc. (AVGO) and Lattice Semiconductor Corporation (LSCC) based on the most recent data from 2025 and 2024 respectively.
| Metric | Broadcom Inc. (AVGO) | Lattice Semiconductor Corporation (LSCC) |
|---|---|---|
| Market Risk | Beta 1.22, moderate volatility with a wide price range 138.1-414.61 USD | Beta 1.72, higher volatility, price range 34.69-89.47 USD |
| Debt Level | Moderate leverage, Debt/Equity 0.8, Debt to Assets 38% (neutral) | Very low leverage, Debt/Equity 0.02, Debt to Assets 1.8% (favorable) |
| Regulatory Risk | Exposure to global semiconductor regulations and trade policies | Similar exposure but smaller scale, more sensitive to market shifts |
| Operational Risk | Large, diversified operations with 37K employees, stable cash flow | Smaller scale (1,110 employees), reliance on niche FPGA products |
| Environmental Risk | Engaged in energy systems and factory automation, potential regulatory scrutiny | Less diversified product line, possible impact from supply chain issues |
| Geopolitical Risk | Significant global footprint, potentially affected by US-China trade tensions | Also exposed to geopolitical risk due to global sales, but smaller footprint |
Broadcom’s most impactful risks are moderate debt and market volatility, but strong financial health and diversification mitigate these concerns. Lattice Semiconductor shows very low debt but higher market volatility and operational concentration, increasing sensitivity to sector shifts. Both face regulatory and geopolitical risks inherent to the semiconductor industry.
Which Stock to Choose?
Broadcom Inc. (AVGO) shows strong income growth with a 132.74% revenue increase over five years and favorable profitability metrics, including a 36.2% net margin and 28.45% ROE. Its debt levels are moderate with a neutral debt-to-equity ratio, while financial ratios are slightly favorable overall, supported by a very favorable moat rating and a strong credit rating of B.
Lattice Semiconductor Corporation (LSCC) exhibits modest income growth of 24.82% over five years but recent declines in revenue and profitability metrics. It has a lower net margin of 12.0%, moderate returns on equity and invested capital, and very low debt levels with a favorable debt-to-equity score. However, its financial ratios are slightly unfavorable overall, with a very unfavorable moat status but a credit rating also rated B-.
Investors focused on durable competitive advantage and consistent profitability might find Broadcom’s profile more aligned with quality investing, while those prioritizing lower leverage and potential growth turnaround could see Lattice Semiconductor as fitting a risk-tolerant or growth-oriented strategy. The ratings and income evaluations suggest different risk and value profiles rather than a definitive choice.
Disclaimer: Investment carries a risk of loss of initial capital. The past performance is not a reliable indicator of future results. Be sure to understand risks before making an investment decision.
Go Further
I encourage you to read the complete analyses of Broadcom Inc. and Lattice Semiconductor Corporation to enhance your investment decisions: