Home > Comparison > Technology > AVGO vs LRCX
The strategic rivalry between Broadcom Inc. and Lam Research Corporation defines the current trajectory of the semiconductor sector. Broadcom operates as a diversified technology giant with a broad product portfolio spanning semiconductors and infrastructure software. In contrast, Lam Research focuses on specialized, capital-intensive semiconductor fabrication equipment. This analysis will assess which company’s operational model offers superior risk-adjusted returns for a diversified portfolio in today’s dynamic tech landscape.

Table of contents
Companies Overview
Broadcom Inc. and Lam Research Corporation are pivotal players shaping the semiconductor industry landscape.
Broadcom Inc.: Semiconductor and Infrastructure Powerhouse
Broadcom Inc. dominates as a global technology leader specializing in semiconductor and infrastructure software solutions. Its revenue primarily stems from diverse segments including wired infrastructure, wireless communications, and enterprise storage. In 2026, Broadcom sharpens its strategic focus on integrating complex subsystems and firmware, enhancing connectivity across data centers, smartphones, and industrial automation.
Lam Research Corporation: Precision in Semiconductor Fabrication
Lam Research Corporation is a foremost supplier of semiconductor wafer fabrication equipment. It generates revenue by designing and servicing advanced tools for etching, deposition, and cleaning critical to integrated circuit manufacturing. In 2026, Lam prioritizes technological innovation in plasma-enhanced processes and atomic layer deposition to improve chip yield and manufacturing precision globally.
Strategic Collision: Similarities & Divergences
Both firms operate within the semiconductor sector but diverge in approach; Broadcom pursues an integrated product portfolio blending hardware and software, while Lam focuses on specialized equipment innovation for chip fabrication. Their competitive battleground lies in the semiconductor value chain, where Broadcom targets end-product connectivity and Lam dominates manufacturing tools. This distinction defines their investment profiles as one driven by diversified tech infrastructure, the other by capital-intensive equipment leadership.
Income Statement Comparison
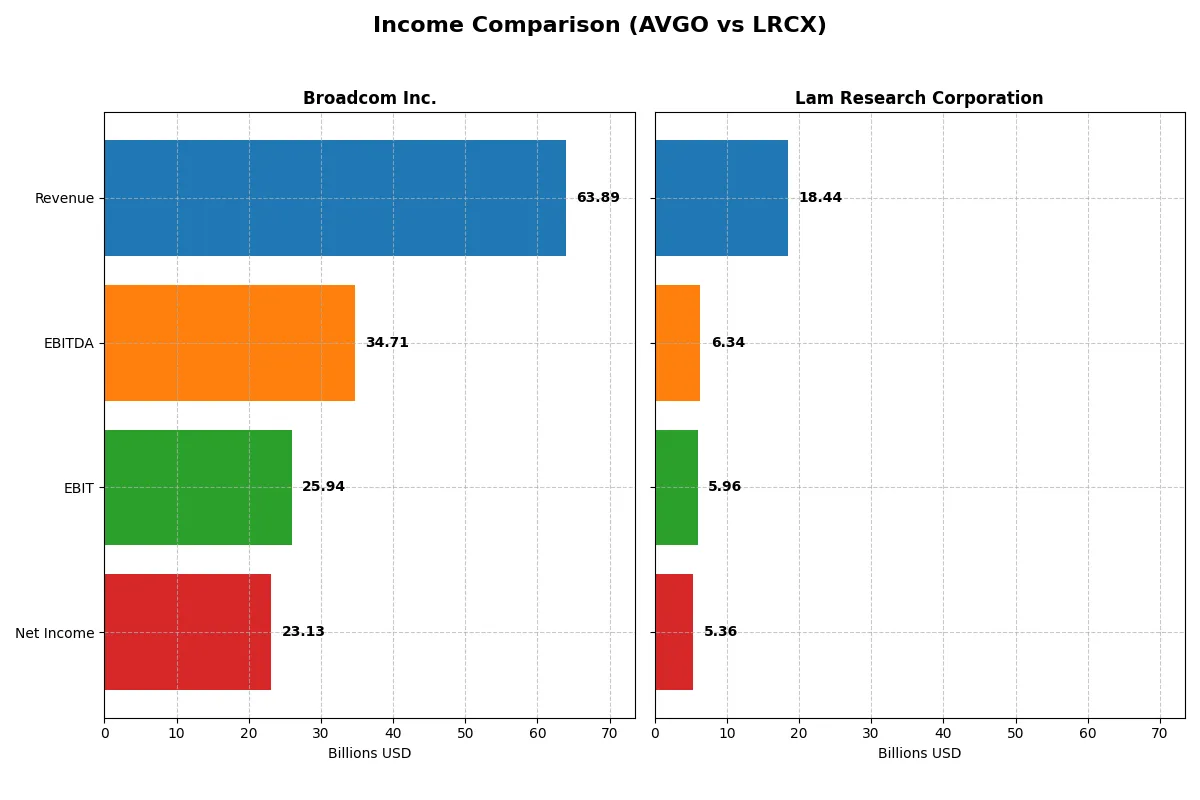
This data dissects the core profitability and scalability of both corporate engines to reveal who dominates the bottom line:
| Metric | Broadcom Inc. (AVGO) | Lam Research Corporation (LRCX) |
|---|---|---|
| Revenue | 63.9B | 18.4B |
| Cost of Revenue | 20.6B | 9.5B |
| Operating Expenses | 17.8B | 3.1B |
| Gross Profit | 43.3B | 9.0B |
| EBITDA | 34.7B | 6.3B |
| EBIT | 25.9B | 6.0B |
| Interest Expense | 3.2B | 178M |
| Net Income | 23.1B | 5.4B |
| EPS | 4.91 | 4.17 |
| Fiscal Year | 2025 | 2025 |
Income Statement Analysis: The Bottom-Line Duel
The income statement comparison reveals which company runs a more efficient and profitable operational engine through revenue growth and margin control.
Broadcom Inc. Analysis
Broadcom’s revenue surged from 27.5B in 2021 to 63.9B in 2025, with net income soaring from 6.4B to 23.1B. Its gross margin remains robust near 68%, while net margin expanded impressively to 36.2%. The latest fiscal year showcases exceptional momentum, with net income growth over 200% year-over-year, highlighting superior operational leverage and cost discipline.
Lam Research Corporation Analysis
Lam Research grew revenue moderately from 14.6B in 2021 to 18.4B in 2025, with net income climbing from 3.9B to 5.4B. It maintains a solid gross margin of 48.7% and a net margin of 29.1%. Despite slower overall growth, Lam shows steady margin expansion and consistent profitability, reflecting disciplined expense management and sustainable operational efficiency.
Growth Dominance vs. Steady Profitability
Broadcom dominates with a striking 132.7% revenue growth and 243.3% net income increase over five years, vastly outperforming Lam’s 26.1% and 37.1% respectively. Broadcom’s higher margins and rapid profit expansion make it the clear fundamental winner. Investors seeking strong growth and margin power will find Broadcom’s profile more attractive.
Financial Ratios Comparison
These vital ratios act as a diagnostic tool to expose the underlying fiscal health, valuation premiums, and capital efficiency of the companies compared below:
| Ratios | Broadcom Inc. (AVGO) | Lam Research Corporation (LRCX) |
|---|---|---|
| ROE | 28.4% | 54.3% |
| ROIC | 16.4% | 34.0% |
| P/E | 73.9 | 23.4 |
| P/B | 21.0 | 12.7 |
| Current Ratio | 1.71 | 2.21 |
| Quick Ratio | 1.58 | 1.55 |
| D/E (Debt/Equity) | 0.80 | 0.48 |
| Debt-to-Assets | 38.1% | 22.3% |
| Interest Coverage | 7.9x | 33.1x |
| Asset Turnover | 0.37 | 0.86 |
| Fixed Asset Turnover | 25.3 | 7.6 |
| Payout Ratio | 48.2% | 21.5% |
| Dividend Yield | 0.65% | 0.92% |
| Fiscal Year | 2025 | 2025 |
Efficiency & Valuation Duel: The Vital Signs
Ratios act as a company’s financial DNA, revealing hidden risks and operational excellence crucial for informed investment decisions.
Broadcom Inc.
Broadcom exhibits a strong 28.45% ROE and a robust 36.2% net margin, signaling excellent profitability. However, it trades at a stretched P/E of 73.87, indicating an expensive valuation. The company returns value with a modest 0.65% dividend yield, suggesting a focus on reinvesting earnings into R&D and growth initiatives.
Lam Research Corporation
Lam Research delivers an impressive 54.33% ROE and a solid 29.06% net margin, demonstrating superior profitability efficiency. Its P/E ratio of 23.36 reflects a more reasonable valuation compared to Broadcom. The 0.92% dividend yield is low, with capital likely redirected towards enhancing operations and innovation, supporting sustained growth.
Premium Valuation vs. Operational Safety
Lam Research offers a better balance of profitability and valuation with a lower P/E and higher ROE, reducing investment risk. Broadcom’s premium valuation demands caution despite solid returns. Investors seeking growth at a moderate price may prefer Lam’s profile, while risk-tolerant investors might accept Broadcom’s stretched multiples.
Which one offers the Superior Shareholder Reward?
Broadcom (AVGO) delivers a higher dividend yield at 3.66% in 2022 versus Lam Research (LRCX) at 1.30%. AVGO’s payout ratio hovers around 48%, well-covered by free cash flow, ensuring sustainability. Lam’s lower payout ratio near 21% signals room for growth but less immediate yield. Both deploy strong buybacks: AVGO’s aggressive capital return complements dividends, while LRCX focuses on reinvestment and modest buybacks. I see AVGO’s balanced distribution and robust free cash flow coverage as offering a superior total shareholder return in 2026.
Comparative Score Analysis: The Strategic Profile
The radar chart reveals the fundamental DNA and trade-offs of Broadcom Inc. and Lam Research Corporation, highlighting their core financial strengths and vulnerabilities:
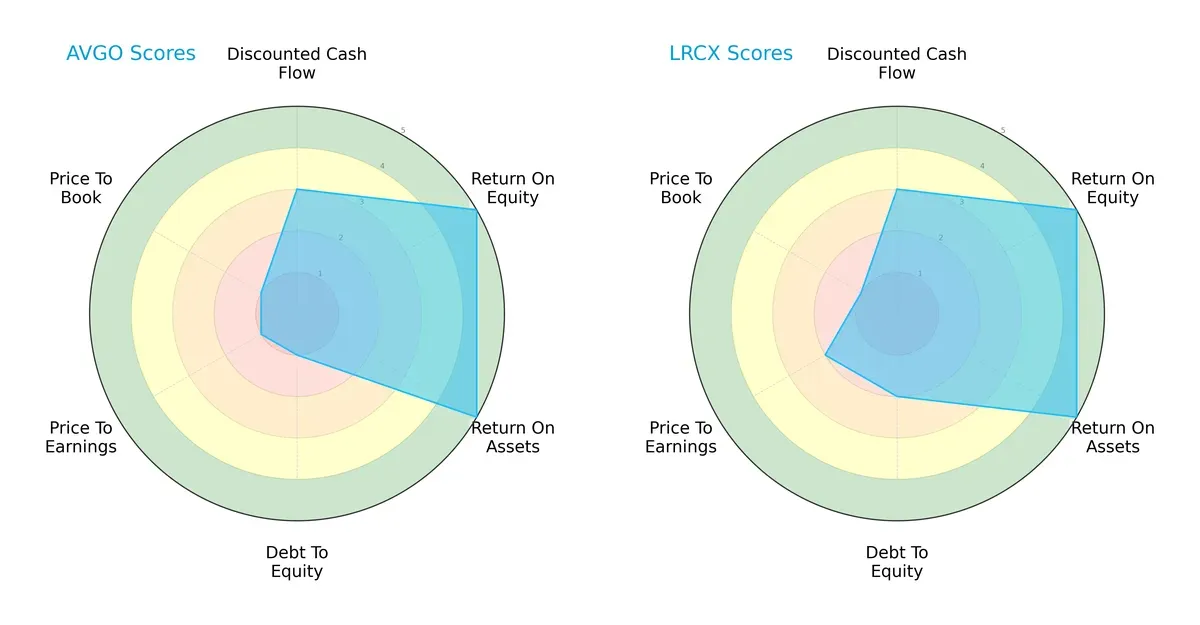
Both companies share strong operational metrics with identical ROE and ROA scores of 5, signaling efficient profit generation and asset utilization. However, Lam Research holds an edge in financial stability, scoring 2 on debt-to-equity versus Broadcom’s weak 1. Valuation metrics show Lam Research also fares better with a moderate P/E score of 2, compared to Broadcom’s very unfavorable 1, despite both sharing a low P/B score. This suggests Lam Research presents a more balanced financial profile, while Broadcom relies heavily on operational efficiency but carries higher financial risk.
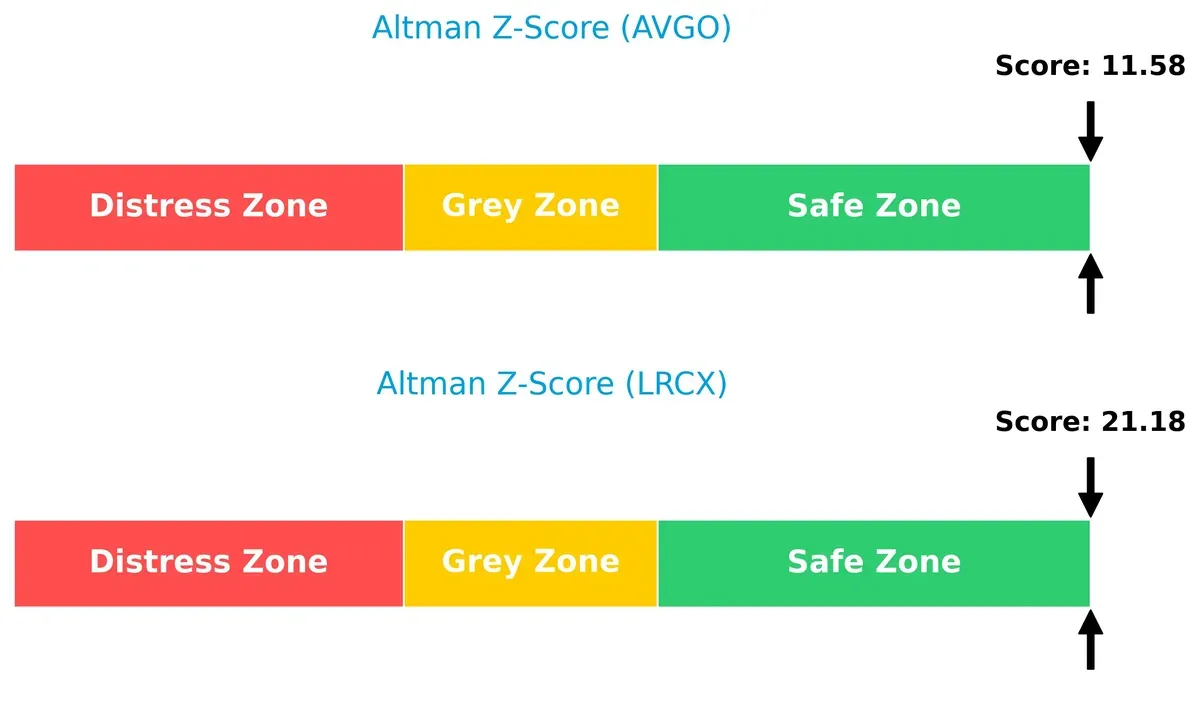
Bankruptcy Risk: Solvency Showdown
Lam Research’s Altman Z-Score of 21.18 far exceeds Broadcom’s 11.58, placing both well within the safe zone but underscoring Lam’s superior solvency and lower bankruptcy risk in this cycle:
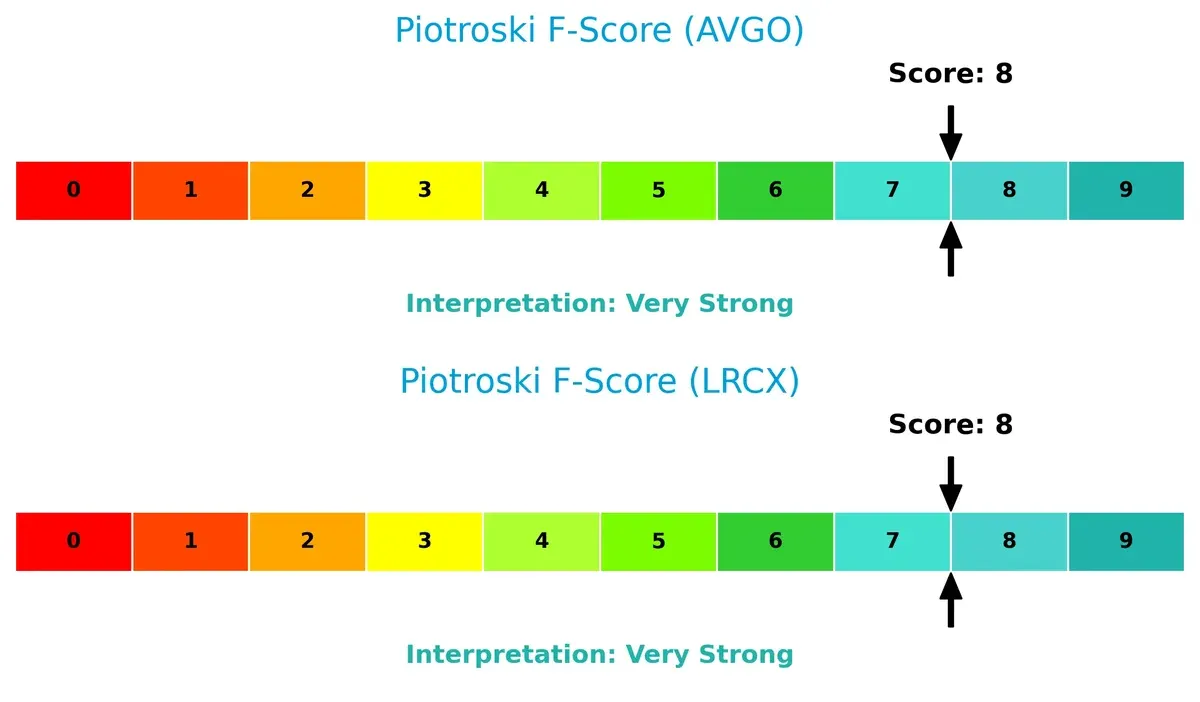
Financial Health: Quality of Operations
Both companies score an impressive 8 on the Piotroski F-Score, reflecting very strong internal financial health. Neither shows red flags, indicating robust profitability, liquidity, and operational efficiency:
How are the two companies positioned?
This section dissects the operational DNA of Broadcom and Lam Research by comparing their revenue distribution and internal dynamics. The goal is to confront their economic moats and identify the more resilient and sustainable competitive advantage.
Revenue Segmentation: The Strategic Mix
This visual comparison dissects how Broadcom Inc. and Lam Research Corporation diversify their income streams and where their primary sector bets lie:
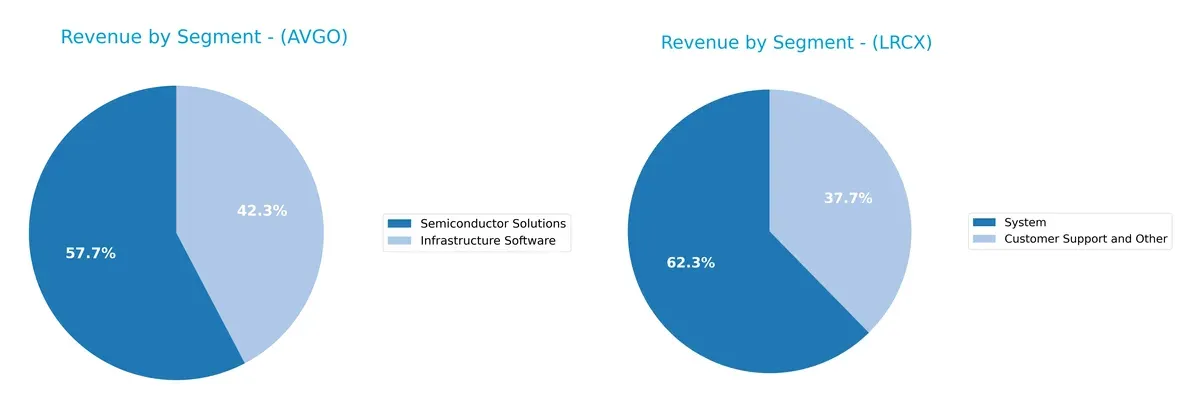
Broadcom anchors its revenue in Semiconductor Solutions with $36.9B in 2025, complemented by a strong $27B Infrastructure Software segment. This mix signals a balanced reliance on hardware and software ecosystems. Lam Research pivots on System sales at $11.5B, supported by $6.9B from Customer Support and Other, showing a narrower focus. Broadcom’s diversification reduces concentration risk, while Lam Research’s dependence on system sales exposes it to semiconductor cycle volatility.
Strengths and Weaknesses Comparison
This table compares the strengths and weaknesses of Broadcom Inc. and Lam Research Corporation:
Broadcom Inc. Strengths
- Strong diversification with software and semiconductor segments
- Favorable net margin at 36.2%
- ROE of 28.45% indicates efficient equity use
- Solid liquidity with current ratio 1.71
- Global reach with significant Asia Pacific and Americas sales
- High fixed asset turnover at 25.25
Lam Research Corporation Strengths
- Higher profitability with ROE at 54.33% and ROIC at 34.0%
- Strong liquidity, current ratio at 2.21
- Low debt-to-assets ratio at 22.28% reduces financial risk
- Favorable interest coverage of 33.43
- Balanced geographic exposure including China, US, and Asia Pacific
- Favorable asset turnover at 0.86
Broadcom Inc. Weaknesses
- High valuation multiples, PE at 73.87 and PB at 21.01, may pressure returns
- Unfavorable asset turnover at 0.37 limits efficiency
- Neutral debt levels could constrain flexibility
- Low dividend yield of 0.65% less attractive for income investors
- Limited product concentration risks in semiconductor solutions
Lam Research Corporation Weaknesses
- Elevated WACC at 12.05% raises capital costs
- Unfavorable PB ratio at 12.69
- Dividend yield low at 0.92%
- Neutral asset turnover suggests room for operational improvement
Broadcom shows strength in diversification and liquidity but faces valuation and efficiency concerns. Lam Research delivers superior profitability and conservative leverage but carries higher capital costs. Both companies demonstrate global footprints shaping their strategic priorities.
The Moat Duel: Analyzing Competitive Defensibility
A structural moat is the only barrier protecting long-term profits from relentless competition erosion. Let’s dissect how two semiconductor giants defend their turf:
Broadcom Inc.: Intangible Assets and Scale Moat
Broadcom leverages a vast portfolio of proprietary technologies and strong customer relationships. Its 40.6% EBIT margin and growing ROIC (+34%) reflect durable pricing power. Expansion into wireless and data infrastructure deepens this moat in 2026.
Lam Research Corporation: Cost Advantage through Precision Equipment
Lam Research’s moat stems from specialized manufacturing equipment and operational efficiency. Its ROIC exceeds WACC by 22%, signaling strong value creation. While margins are narrower than Broadcom’s, Lam’s focused innovation in wafer fabrication sustains its competitive edge.
Moat Strength Battle: Intangible Assets vs. Operational Excellence
Broadcom’s intangible asset moat is wider, supported by superior margins and rapid profit growth. Lam’s cost advantage is deep but less expansive. Broadcom is better positioned to defend market share amid intensifying semiconductor competition.
Which stock offers better returns?
The past year reveals stark contrasts in price performance and trading behavior between Broadcom Inc. and Lam Research Corporation, highlighting divergent momentum and market sentiment.
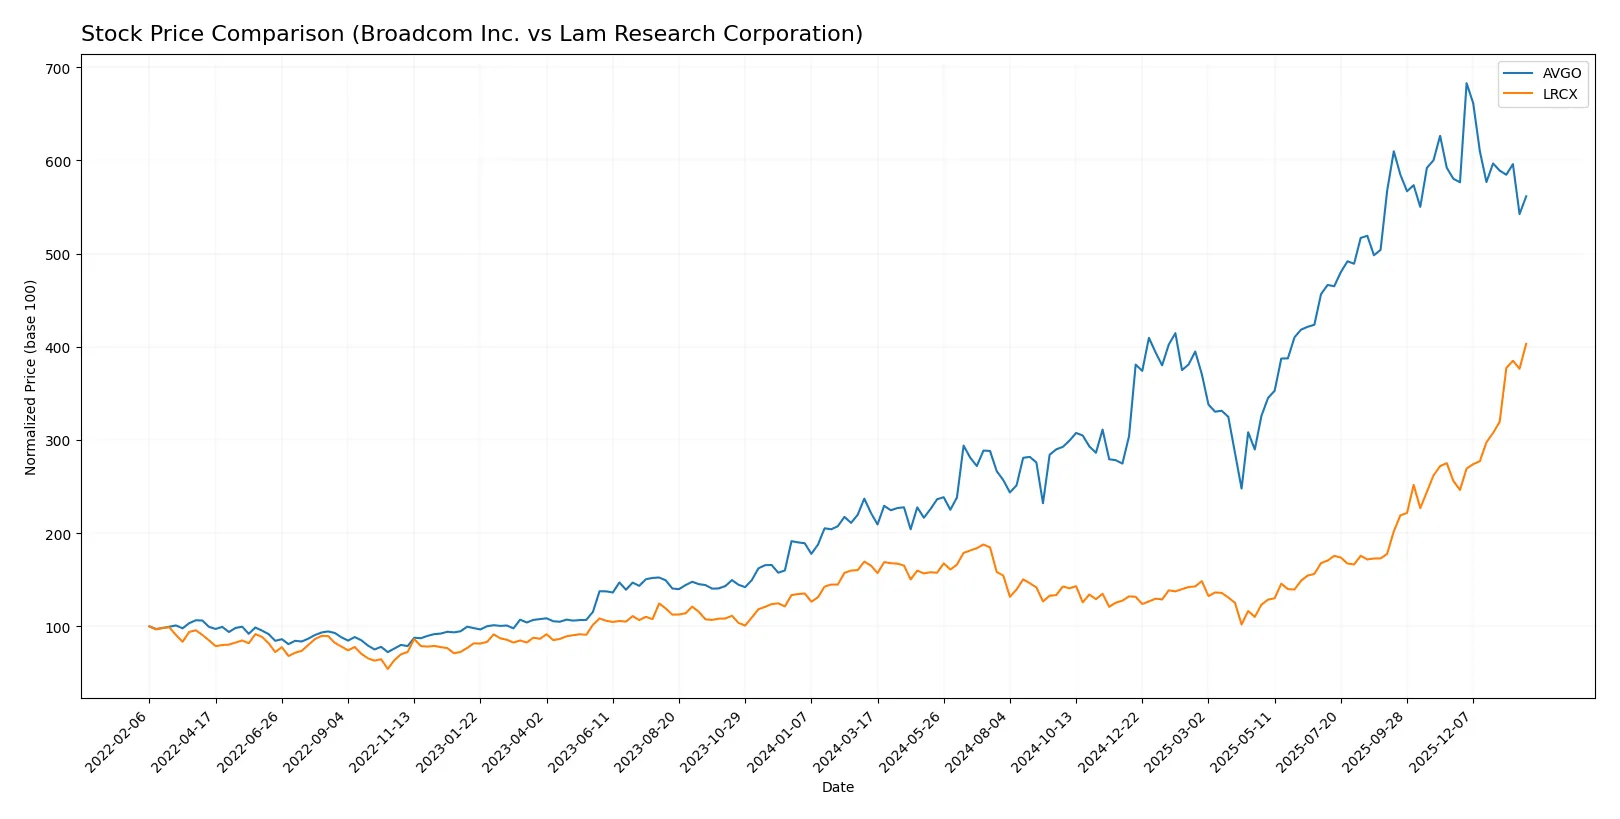
Trend Comparison
Broadcom Inc. shows a strong bullish trend over the past 12 months with a 153.15% price increase. The trend decelerated despite high volatility, peaking at 403, before a recent 3.26% decline.
Lam Research Corporation also posts a bullish trend, gaining 144.03% over the year. Unlike Broadcom, its trend accelerated with lower volatility and a recent sharp 57.47% price surge.
Lam Research’s accelerating momentum and recent strong buyer dominance outpace Broadcom’s decelerating trend, delivering the highest market performance in this comparison.
Target Prices
Analyst consensus projects solid upside potential for Broadcom and Lam Research.
| Company | Target Low | Target High | Consensus |
|---|---|---|---|
| Broadcom Inc. | 370 | 510 | 450.12 |
| Lam Research Corporation | 127 | 325 | 266.76 |
Broadcom’s target consensus at 450 implies roughly 36% upside from the current 331.3. Lam Research’s 266.76 consensus suggests about 14% appreciation from 233.46. Both show attractive growth prospects against current prices.

Don’t Let Luck Decide Your Entry Point
Optimize your entry points with our advanced ProRealTime indicators. You’ll get efficient buy signals with precise price targets for maximum performance. Start outperforming now!
How do institutions grade them?
The following grades from leading financial institutions summarize analyst sentiment for both companies:
Broadcom Inc. Grades
This table shows recent analyst grades and actions for Broadcom Inc.:
| Grading Company | Action | New Grade | Date |
|---|---|---|---|
| Wells Fargo | Upgrade | Overweight | 2026-01-15 |
| Mizuho | Maintain | Outperform | 2026-01-09 |
| Truist Securities | Maintain | Buy | 2025-12-19 |
| UBS | Maintain | Buy | 2025-12-15 |
| B of A Securities | Maintain | Buy | 2025-12-12 |
| Mizuho | Maintain | Outperform | 2025-12-12 |
| TD Cowen | Maintain | Buy | 2025-12-12 |
| Benchmark | Maintain | Buy | 2025-12-12 |
| Keybanc | Maintain | Overweight | 2025-12-12 |
| Rosenblatt | Maintain | Buy | 2025-12-12 |
Lam Research Corporation Grades
This table displays recent analyst grades and actions for Lam Research Corporation:
| Grading Company | Action | New Grade | Date |
|---|---|---|---|
| Susquehanna | Maintain | Positive | 2026-01-29 |
| Citigroup | Maintain | Buy | 2026-01-29 |
| RBC Capital | Maintain | Outperform | 2026-01-29 |
| Needham | Maintain | Buy | 2026-01-29 |
| UBS | Maintain | Buy | 2026-01-29 |
| Cantor Fitzgerald | Maintain | Overweight | 2026-01-29 |
| Goldman Sachs | Maintain | Buy | 2026-01-29 |
| Morgan Stanley | Maintain | Equal Weight | 2026-01-29 |
| Wells Fargo | Maintain | Overweight | 2026-01-29 |
| Stifel | Maintain | Buy | 2026-01-29 |
Which company has the best grades?
Both companies exhibit strong analyst support with multiple Buy and Outperform ratings. Broadcom recently received an upgrade from Wells Fargo, slightly enhancing its grade profile. Lam Research maintains a consistent Positive and Buy consensus. Investors may view Broadcom’s recent grade upgrade as a sign of improving sentiment, while Lam Research’s stable grades suggest steady confidence.
Risks specific to each company
The following categories identify the critical pressure points and systemic threats facing both firms in the 2026 market environment:
1. Market & Competition
Broadcom Inc.
- Operates diversified semiconductor segments, facing intense competition from integrated and infrastructure chip makers.
Lam Research Corporation
- Specializes in semiconductor fabrication equipment, highly exposed to cyclical capex cycles and competitive innovation pressure.
2. Capital Structure & Debt
Broadcom Inc.
- Debt-to-equity ratio at 0.8 indicates moderate leverage with neutral risk; interest coverage is solid at 8.08x.
Lam Research Corporation
- Lower leverage with debt-to-equity at 0.48 and very strong interest coverage at 33.43x, suggesting stronger balance sheet resilience.
3. Stock Volatility
Broadcom Inc.
- Beta of 1.22 shows moderate market volatility, typical for tech sector giants.
Lam Research Corporation
- Beta of 1.78 signals higher stock volatility, reflecting sensitivity to semiconductor capital spending cycles.
4. Regulatory & Legal
Broadcom Inc.
- Global operations expose it to complex regulatory environments, including antitrust scrutiny in tech infrastructure.
Lam Research Corporation
- Operates internationally with exposure to export controls and semiconductor technology regulations, especially in Asia.
5. Supply Chain & Operations
Broadcom Inc.
- Complex supply chains across hardware and software risk disruption from geopolitical tensions and component shortages.
Lam Research Corporation
- Highly dependent on specialized materials and manufacturing precision; supply chain risks amplified by global semiconductor shortages.
6. ESG & Climate Transition
Broadcom Inc.
- Faces pressure to improve energy efficiency in products and reduce emissions in manufacturing and data centers.
Lam Research Corporation
- Needs to innovate in energy-efficient equipment and comply with increasing environmental regulations globally.
7. Geopolitical Exposure
Broadcom Inc.
- Significant exposure to US-China trade tensions impacting supply chain and market access.
Lam Research Corporation
- Also exposed to geopolitical risks, with sales and operations sensitive to US export restrictions on semiconductor tech.
Which company shows a better risk-adjusted profile?
Broadcom’s primary risk lies in regulatory complexity and supply chain breadth, potentially disrupting operations. Lam Research faces its biggest threat from cyclical capital expenditures and geopolitical export controls, which heavily influence its demand. Lam’s stronger balance sheet and higher Piotroski score indicate a more robust risk-adjusted profile. Recent sharp price declines in Lam’s stock highlight investor concerns over capital cycle volatility, reinforcing caution despite its financial strength.
Final Verdict: Which stock to choose?
Broadcom Inc. (AVGO) excels as a cash-generating powerhouse with a very favorable moat, driven by its efficient capital deployment and robust profitability. Its valuation premium and heavy reliance on intangibles warrant caution. This stock suits aggressive growth portfolios seeking durable competitive advantages.
Lam Research Corporation (LRCX) boasts a strong strategic moat anchored in its operational efficiency and solid return on invested capital. Compared to AVGO, it offers better balance sheet strength and lower leverage, appealing to investors favoring safety alongside growth. It fits well within GARP (Growth at a Reasonable Price) frameworks.
If you prioritize aggressive growth with an emphasis on cash flow power and market dominance, Broadcom Inc. outshines due to its superior ROIC and expanding profitability. However, if you seek a blend of growth and financial stability with a more conservative risk profile, Lam Research offers better stability and valuation discipline for your portfolio.
Disclaimer: Investment carries a risk of loss of initial capital. The past performance is not a reliable indicator of future results. Be sure to understand risks before making an investment decision.
Go Further
I encourage you to read the complete analyses of Broadcom Inc. and Lam Research Corporation to enhance your investment decisions: