Home > Comparison > Technology > AVGO vs KLAC
The strategic rivalry between Broadcom Inc. and KLA Corporation shapes the semiconductor industry’s evolution. Broadcom operates as a diversified technology firm offering semiconductor and infrastructure software solutions. KLA, by contrast, specializes in process control and yield management equipment for semiconductor manufacturing. This head-to-head pits Broadcom’s broad product portfolio against KLA’s niche precision technology. This analysis aims to determine which approach delivers superior risk-adjusted returns for a balanced portfolio.

Table of contents
Companies Overview
Broadcom and KLA stand as heavyweight competitors in the semiconductor industry, shaping technology infrastructure worldwide.
Broadcom Inc.: Semiconductor Solutions Powerhouse
Broadcom dominates as a global technology company designing and supplying semiconductor and infrastructure software solutions. Its revenue stems from diverse segments, including Wired Infrastructure and Wireless Communications. In 2026, Broadcom strategically focuses on expanding its product portfolio across enterprise networking and industrial automation, reinforcing its broad market reach and innovation pipeline.
KLA Corporation: Precision Process Control Leader
KLA specializes in process control and yield management solutions for semiconductor manufacturing. Its core revenue derives from wafer inspection, metrology, and defect analysis products. In 2026, KLA prioritizes advancing its semiconductor process control technologies, targeting higher precision and efficiency for IC manufacturing, crucial for sustaining leadership in a competitive market.
Strategic Collision: Similarities & Divergences
Broadcom emphasizes a broad product ecosystem spanning hardware and firmware, while KLA centers on specialized process control technologies. Both compete on innovation but in different stages of the semiconductor value chain—Broadcom in chip production and infrastructure, KLA in manufacturing precision. Their investment profiles diverge: Broadcom offers scale and diversification; KLA provides niche expertise with higher operational focus.
Income Statement Comparison
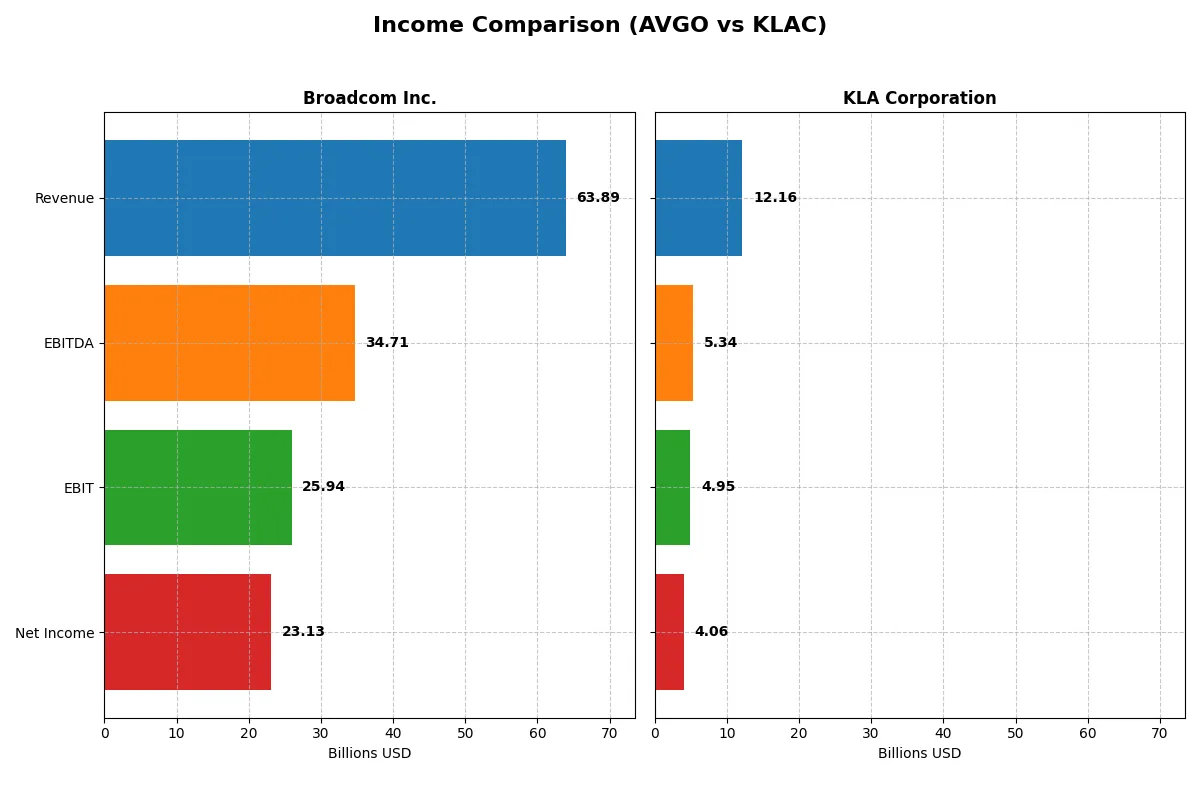
This table dissects the core profitability and scalability of both corporate engines to reveal who dominates the bottom line:
| Metric | Broadcom Inc. (AVGO) | KLA Corporation (KLAC) |
|---|---|---|
| Revenue | 63.9B | 12.2B |
| Cost of Revenue | 20.6B | 4.6B |
| Operating Expenses | 17.8B | 2.3B |
| Gross Profit | 43.3B | 7.6B |
| EBITDA | 34.7B | 5.3B |
| EBIT | 25.9B | 4.9B |
| Interest Expense | 3.2B | 0.3B |
| Net Income | 23.1B | 4.1B |
| EPS | 4.91 | 30.53 |
| Fiscal Year | 2025 | 2025 |
Income Statement Analysis: The Bottom-Line Duel
This income statement comparison reveals which company operates its business with superior efficiency and growth momentum.
Broadcom Inc. Analysis
Broadcom’s revenue surged from $27.45B in 2021 to $63.89B in 2025, reflecting a robust 132.7% growth. Net income expanded even faster, soaring 243.3% to $23.13B in 2025. Its gross margin remains strong at 67.8%, while net margin improved to 36.2%, signaling excellent cost control and profitability momentum in the latest fiscal year.
KLA Corporation Analysis
KLA’s revenue climbed steadily by 75.7% from $6.92B in 2021 to $12.16B in 2025. Net income nearly doubled, reaching $4.06B, with a net margin of 33.4%. The company sustains healthy gross margins at 62.3% and a solid ebit margin of 40.7%, demonstrating consistent operational efficiency and stable growth momentum.
Margin Dominance vs. Scaled Growth
Broadcom outpaces KLA with superior revenue and net income growth rates, coupled with higher margins, establishing a commanding efficiency edge. KLA delivers steady, disciplined expansion with strong profitability but lags behind Broadcom’s explosive scale and margin gains. Investors favor Broadcom’s high-growth, margin-rich profile for aggressive portfolio growth.
Financial Ratios Comparison
These vital ratios act as a diagnostic tool to expose the underlying fiscal health, valuation premiums, and capital efficiency for a clear side-by-side analysis:
| Ratios | Broadcom Inc. (AVGO) | KLA Corporation (KLAC) |
|---|---|---|
| ROE | 28.4% | 86.6% |
| ROIC | 16.4% | 38.0% |
| P/E | 73.9x | 29.3x |
| P/B | 21.0x | 25.4x |
| Current Ratio | 1.71 | 2.62 |
| Quick Ratio | 1.58 | 1.83 |
| D/E (Debt-to-Equity) | 0.80 | 1.30 |
| Debt-to-Assets | 38.1% | 37.9% |
| Interest Coverage | 7.94x | 17.3x |
| Asset Turnover | 0.37 | 0.76 |
| Fixed Asset Turnover | 25.3 | 9.70 |
| Payout Ratio | 48.2% | 22.3% |
| Dividend Yield | 0.65% | 0.76% |
| Fiscal Year | 2025 | 2025 |
Efficiency & Valuation Duel: The Vital Signs
Financial ratios act as the company’s DNA, uncovering operational strengths and hidden risks that shape investor decisions.
Broadcom Inc.
Broadcom delivers strong core profitability with a 28.45% ROE and a robust 36.2% net margin, reflecting operational efficiency. However, its valuation is stretched, with a high P/E of 73.87 and a P/B of 21.01, signaling premium pricing. Shareholder returns include a modest 0.65% dividend yield, complemented by heavy reinvestment in R&D to fuel growth.
KLA Corporation
KLA posts exceptional profitability, boasting an 86.56% ROE and a 33.41% net margin, highlighting operational dominance. Its valuation, with a P/E of 29.34 and P/B of 25.39, remains expensive but less extreme than Broadcom’s. The company maintains a 0.76% dividend yield and balances shareholder returns with significant capital allocation toward innovation and expansion.
Premium Valuation vs. Operational Excellence
Both companies show slightly favorable ratios, but Broadcom’s valuation appears more stretched despite solid returns. KLA offers superior profitability and a healthier balance sheet, though at a still elevated price. Investors seeking operational strength might prefer KLA, while those accepting higher valuation risk may consider Broadcom’s growth profile.
Which one offers the Superior Shareholder Reward?
I find Broadcom (AVGO) offers a superior shareholder reward compared to KLA Corporation (KLAC) in 2026. Broadcom yields 0.65% with a high payout ratio near 48%, showing strong dividend commitment supported by nearly 100% FCF coverage. Its buyback intensity is robust, amplifying total returns. KLA yields just 0.76%, with a low 22% payout ratio, signaling a conservative distribution despite its larger dividend per share (6.8 vs. 2.36 for AVGO). KLA’s buyback program is modest relative to free cash flow, limiting total capital return. AVGO’s aggressive buybacks and sustainable payout ratio underpin superior long-term value creation, making it the more attractive total return stock in 2026.
Comparative Score Analysis: The Strategic Profile
The radar chart reveals the fundamental DNA and trade-offs of Broadcom Inc. and KLA Corporation, highlighting their strategic strengths and vulnerabilities:
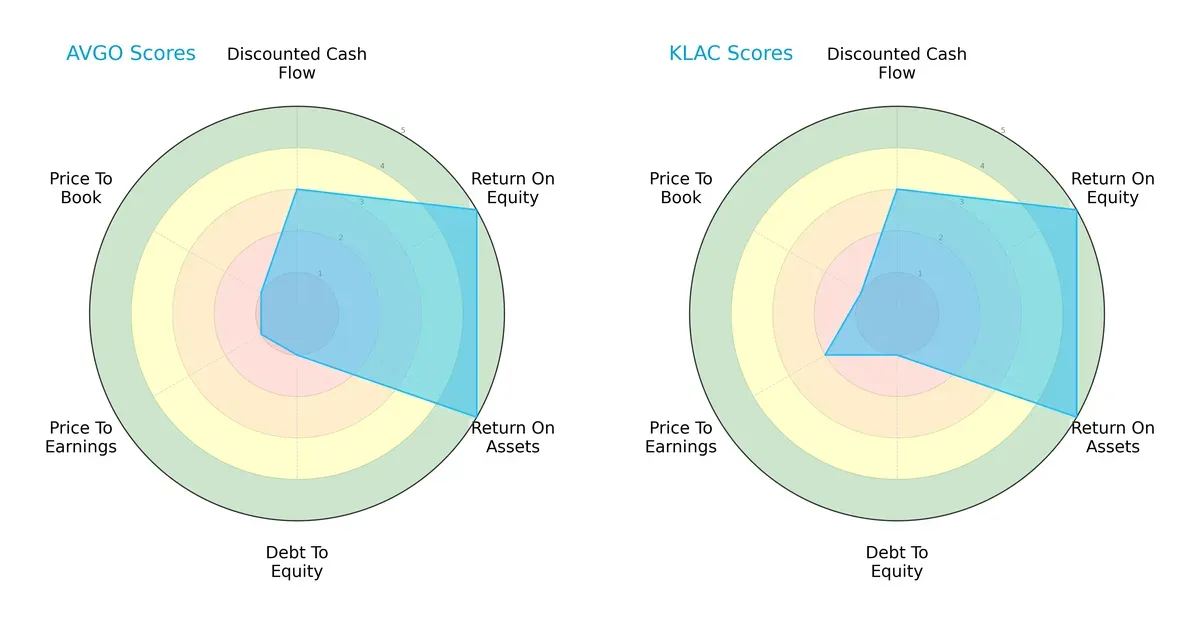
Both firms show outstanding efficiency, with top-tier ROE and ROA scores of 5, signaling excellent profit generation and asset utilization. However, both face significant financial risk, reflected in very unfavorable debt-to-equity scores of 1, indicating heavy leverage. Broadcom’s valuation metrics (P/E and P/B scores of 1) suggest it trades at a discount, potentially reflecting market skepticism. In contrast, KLA’s slightly better P/E score of 2 points to a more balanced valuation stance. Overall, KLA presents a more balanced profile, while Broadcom leans on undervaluation as its key edge.
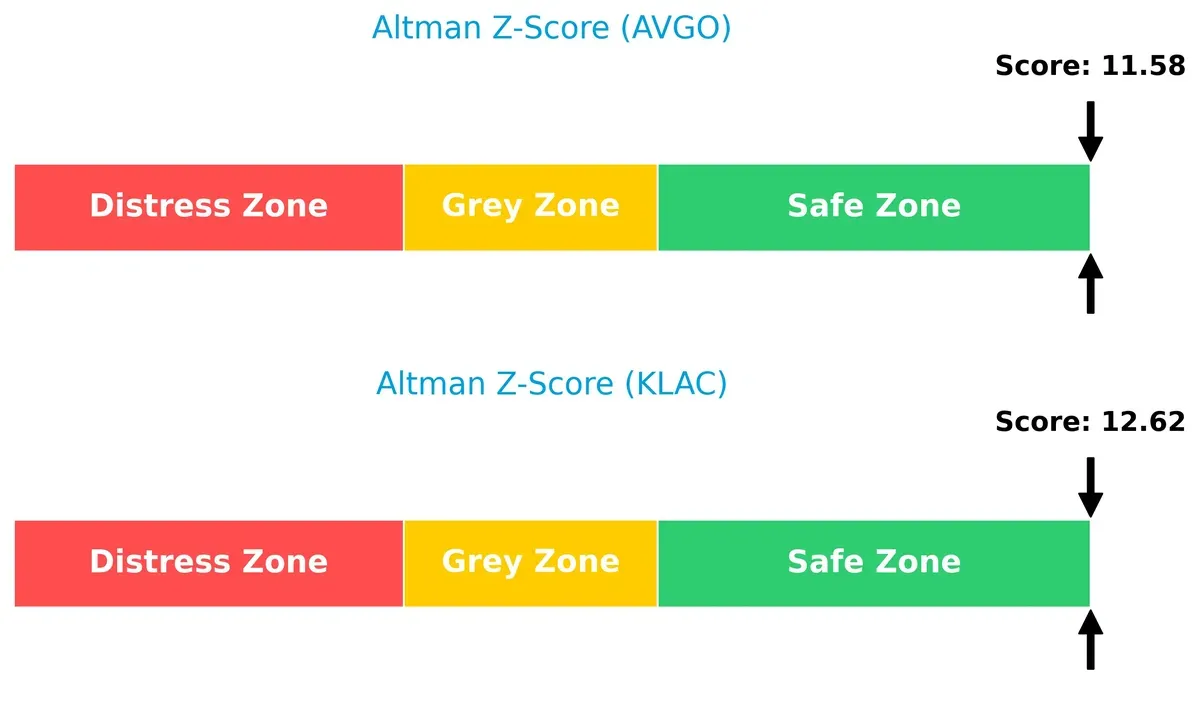
Bankruptcy Risk: Solvency Showdown
Broadcom and KLA both reside comfortably in the safe zone, with Altman Z-Scores above 11, signaling very low bankruptcy risk and strong resilience in the current market cycle:
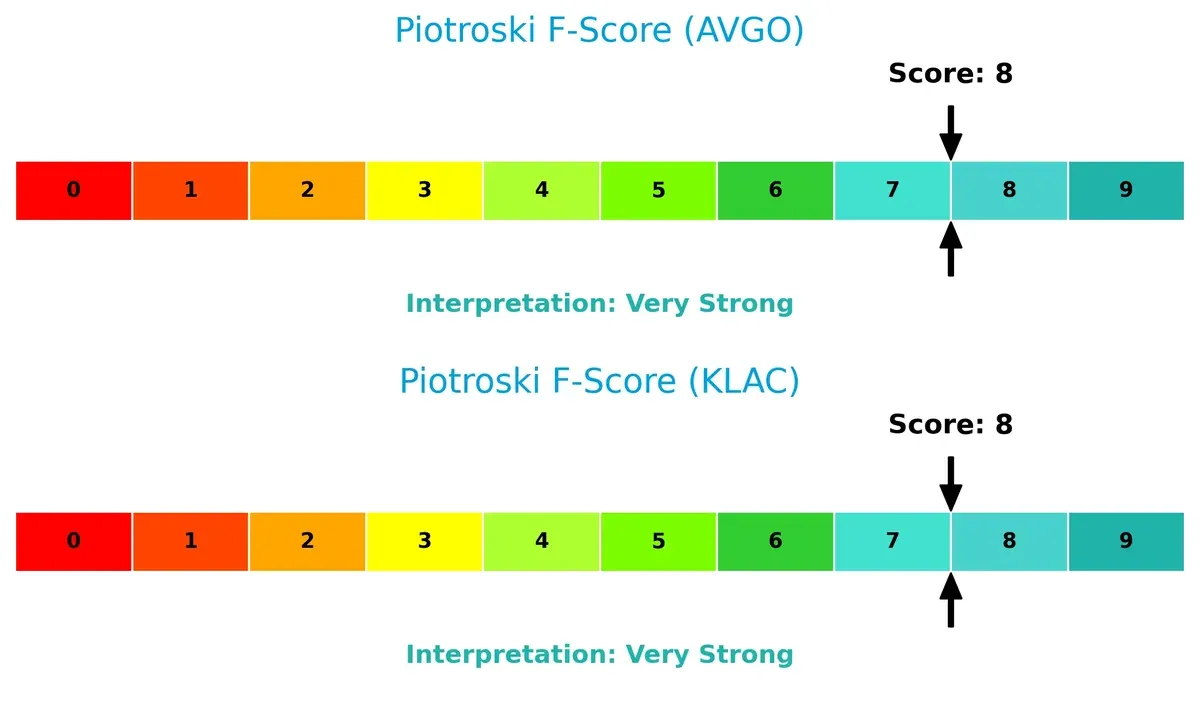
Financial Health: Quality of Operations
Both companies score an impressive 8 on the Piotroski F-Score, indicating very strong financial health and operational quality. Neither shows red flags in profitability, leverage, liquidity, or efficiency metrics, underscoring robust internal management:
How are the two companies positioned?
This section dissects Broadcom and KLA’s operational DNA by comparing their revenue distribution and internal dynamics. The goal is to confront their economic moats to reveal which model offers the most resilient, sustainable competitive edge today.
Revenue Segmentation: The Strategic Mix
This visual comparison dissects how Broadcom Inc. and KLA Corporation diversify their income streams and reveals their primary sector bets for 2025:
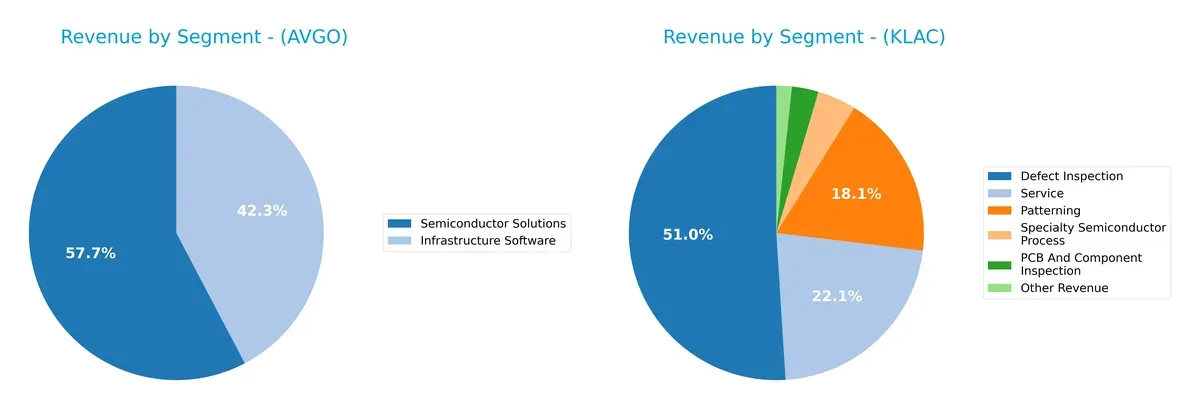
Broadcom anchors its revenue in two massive segments: Semiconductor Solutions at $36.9B and Infrastructure Software at $27.0B, showing a strong dual focus. KLA, however, exhibits a more diversified mix across Defect Inspection ($6.2B), Patterning ($2.2B), Service ($2.7B), and several smaller segments. Broadcom’s concentration risks are balanced by its ecosystem lock-in in semiconductors and software, while KLA’s spread reduces single-segment dependency but demands precise capital allocation across niche tools.
Strengths and Weaknesses Comparison
This table compares the Strengths and Weaknesses of Broadcom Inc. and KLA Corporation:
Broadcom Inc. Strengths
- Strong revenue in Semiconductor Solutions and Infrastructure Software
- Favorable profitability ratios including 36.2% net margin and 28.45% ROE
- Solid liquidity with current ratio 1.71 and quick ratio 1.58
- High fixed asset turnover at 25.25
- Global reach with significant Americas, Asia Pacific, and EMEA sales
KLA Corporation Strengths
- Exceptional profitability with 86.56% ROE and 37.97% ROIC
- Strong liquidity ratios: current ratio 2.62, quick ratio 1.83
- Favorable interest coverage at 16.37
- Diverse revenue streams including Patterning and Defect Inspection
- Presence in multiple Asian markets and North America
Broadcom Inc. Weaknesses
- High valuation multiples: PE 73.87 and PB 21.01, potentially overvalued
- Unfavorable asset turnover at 0.37
- Moderate debt level with debt-to-assets 38.07% and neutral DE ratio
- Low dividend yield at 0.65%
KLA Corporation Weaknesses
- Elevated debt ratio with DE 1.3 flagged as unfavorable
- High WACC at 10.42% affecting capital cost efficiency
- Unfavorable PE 29.34 and PB 25.39 valuations
- Dividend yield remains low at 0.76%
Both companies demonstrate strong profitability and liquidity, each with a slightly favorable overall financial profile. Broadcom leverages a large global footprint and high asset efficiency, while KLA excels in return metrics and diversified revenue. Valuation levels and debt metrics warrant careful monitoring for both firms.
The Moat Duel: Analyzing Competitive Defensibility
A structural moat is the only barrier protecting long-term profits from relentless competition erosion. Let’s dissect the key competitive advantages of two semiconductor giants:
Broadcom Inc. (AVGO): Intangible Assets Powerhouse
Broadcom’s moat stems from extensive intangible assets and diversified product portfolio, delivering a strong 7% ROIC premium over WACC and stable 40% EBIT margins. In 2026, expanding software infrastructure could deepen its durable moat.
KLA Corporation (KLAC): Process Control Specialist
KLA’s moat relies on specialized process control technology, reflected in an impressive 27.5% ROIC premium and growing profitability. Its niche precision tools position it uniquely compared to Broadcom’s broader approach. Market expansion in advanced semiconductor inspection offers upside.
Verdict: Intangible Assets vs. Specialized Technology
KLA exhibits a wider and deeper moat with a 27.5% ROIC spread versus Broadcom’s 7%. Despite Broadcom’s scale, KLA’s focused innovation better equips it to defend and expand market share in 2026.
Which stock offers better returns?
The past year saw Broadcom’s stock gain strong momentum before slowing down recently, while KLA’s shares steadily accelerated with increasing trading volume.
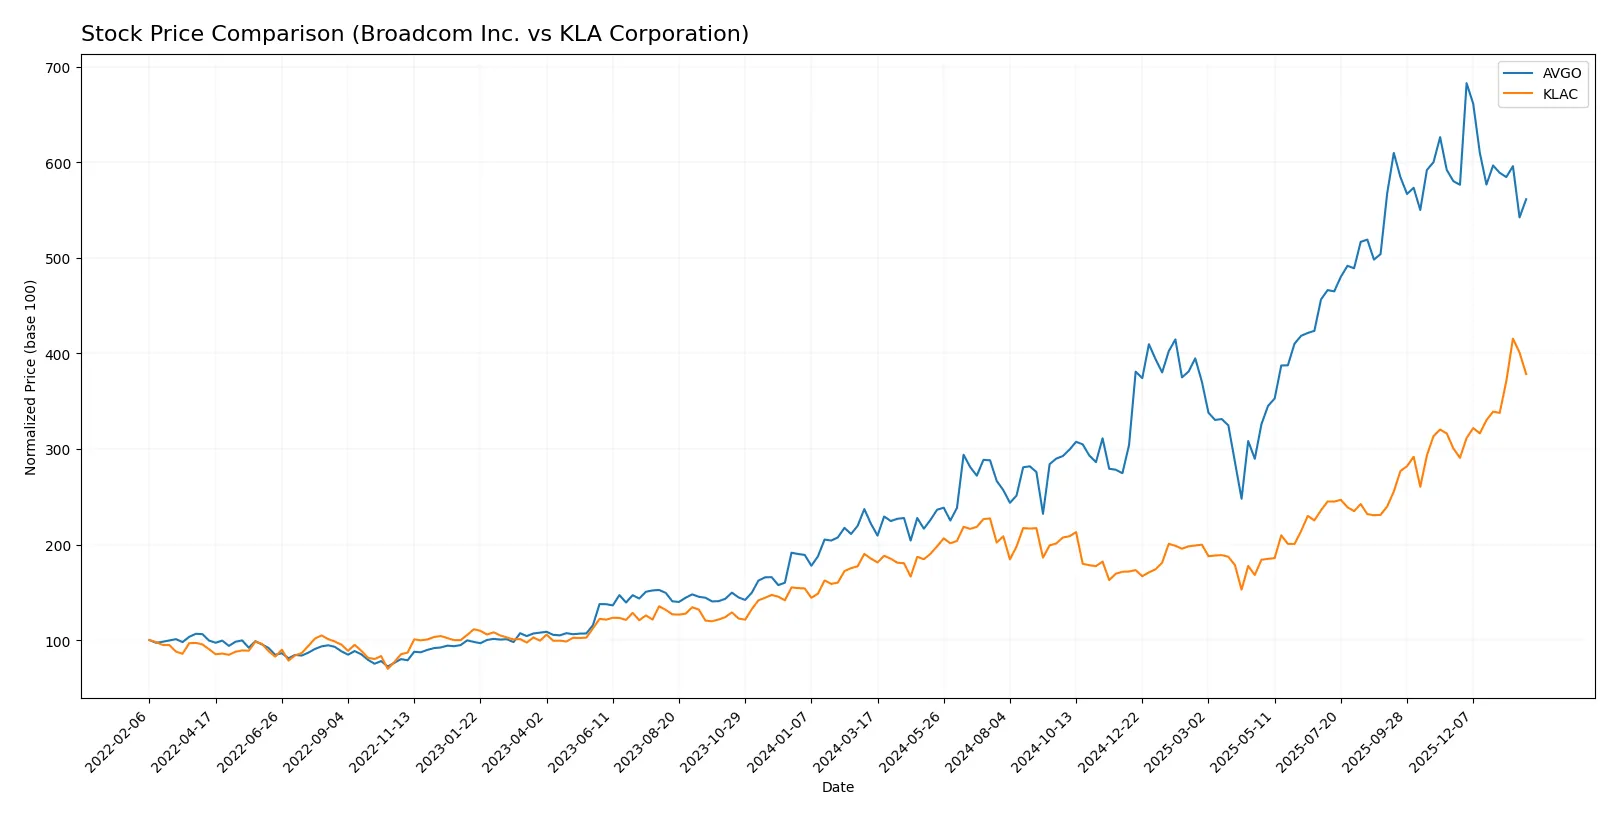
Trend Comparison
Broadcom Inc. shows a robust 153.15% price increase over 12 months, marking a bullish trend with deceleration. Its volatility is moderate, with a high of 402.96 and a low of 120.47.
KLA Corporation gained 104.22% over the same period, maintaining a bullish and accelerating trend. Its price swings are larger, with a high of 1567.82 and a low of 576.53, indicating higher volatility.
Broadcom outperformed KLA in total returns despite decelerating momentum. KLA’s accelerating trend signals growing strength, but Broadcom delivered the highest market performance overall.
Target Prices
Analysts present bullish target price consensus for Broadcom Inc. and KLA Corporation.
| Company | Target Low | Target High | Consensus |
|---|---|---|---|
| Broadcom Inc. | 370 | 510 | 450.12 |
| KLA Corporation | 1400 | 1900 | 1672.25 |
Broadcom’s target consensus sits about 36% above its current 331 price, signaling upside potential. KLA’s consensus target exceeds its present 1428 by 17%, reflecting analyst confidence despite recent volatility.

Don’t Let Luck Decide Your Entry Point
Optimize your entry points with our advanced ProRealTime indicators. You’ll get efficient buy signals with precise price targets for maximum performance. Start outperforming now!
How do institutions grade them?
Here is a comparison of recent institutional grades for Broadcom Inc. and KLA Corporation:
Broadcom Inc. Grades
The following table summarizes recent grades issued by notable financial institutions for Broadcom Inc.:
| Grading Company | Action | New Grade | Date |
|---|---|---|---|
| Wells Fargo | Upgrade | Overweight | 2026-01-15 |
| Mizuho | Maintain | Outperform | 2026-01-09 |
| Truist Securities | Maintain | Buy | 2025-12-19 |
| UBS | Maintain | Buy | 2025-12-15 |
| B of A Securities | Maintain | Buy | 2025-12-12 |
| Mizuho | Maintain | Outperform | 2025-12-12 |
| TD Cowen | Maintain | Buy | 2025-12-12 |
| Benchmark | Maintain | Buy | 2025-12-12 |
| Keybanc | Maintain | Overweight | 2025-12-12 |
| Rosenblatt | Maintain | Buy | 2025-12-12 |
KLA Corporation Grades
The following table summarizes recent grades issued by notable financial institutions for KLA Corporation:
| Grading Company | Action | New Grade | Date |
|---|---|---|---|
| Cantor Fitzgerald | Maintain | Overweight | 2026-01-30 |
| Wells Fargo | Maintain | Overweight | 2026-01-30 |
| Needham | Maintain | Buy | 2026-01-30 |
| Jefferies | Maintain | Buy | 2026-01-30 |
| Oppenheimer | Maintain | Outperform | 2026-01-30 |
| Stifel | Maintain | Buy | 2026-01-30 |
| RBC Capital | Maintain | Sector Perform | 2026-01-30 |
| Barclays | Maintain | Overweight | 2026-01-30 |
| Deutsche Bank | Maintain | Hold | 2026-01-21 |
| Needham | Maintain | Buy | 2026-01-20 |
Which company has the best grades?
Broadcom Inc. received consistently bullish grades, predominantly “Buy” and “Outperform,” including a recent upgrade to “Overweight.” KLA Corporation’s grades show a mix of “Buy,” “Overweight,” and some “Hold” and “Sector Perform.” Broadcom’s stronger consensus could influence investor confidence more positively.
Risks specific to each company
In 2026, these categories expose critical pressure points and systemic threats confronting Broadcom Inc. and KLA Corporation in the evolving semiconductor landscape:
1. Market & Competition
Broadcom Inc.
- Operates in diverse segments with strong scale but faces aggressive competition from integrated device manufacturers.
KLA Corporation
- Specializes in process control with narrower focus, exposed to cyclical semiconductor capex fluctuations.
2. Capital Structure & Debt
Broadcom Inc.
- Moderate leverage with debt-to-assets ~38%, interest coverage solid at 8x; debt-to-equity score very unfavorable.
KLA Corporation
- Higher leverage with debt-to-assets ~38%, but stronger interest coverage at 16x; also carries very unfavorable debt-to-equity score.
3. Stock Volatility
Broadcom Inc.
- Beta at 1.22 indicates moderate market sensitivity; valuation elevated with P/E ~74, implying high expectations.
KLA Corporation
- Higher beta at 1.44 signals greater volatility; lower P/E ~29, but significant recent 15% price drop raises concerns.
4. Regulatory & Legal
Broadcom Inc.
- Faces standard technology sector regulatory scrutiny; no major legal risks reported.
KLA Corporation
- Similar regulatory environment; no recent significant legal challenges disclosed.
5. Supply Chain & Operations
Broadcom Inc.
- Complex global supply chain with risks from geopolitical tensions and semiconductor shortages.
KLA Corporation
- Supply chain vulnerable to semiconductor equipment demand cyclicality and component availability.
6. ESG & Climate Transition
Broadcom Inc.
- Increasing pressure to reduce carbon footprint and enhance governance; sustainability initiatives underway.
KLA Corporation
- Faces similar ESG pressures, with focus on energy-efficient manufacturing and governance transparency.
7. Geopolitical Exposure
Broadcom Inc.
- Significant exposure to US-China tech tensions affecting supply and sales channels.
KLA Corporation
- High dependency on global semiconductor markets, vulnerable to trade restrictions and export controls.
Which company shows a better risk-adjusted profile?
Broadcom’s most impactful risk is its sky-high valuation, suggesting vulnerability to market corrections. KLA’s critical risk lies in its recent sharp stock decline amid volatile semiconductor capex cycles. Despite higher leverage, KLA’s superior interest coverage and safer Altman Z-score reflect stronger financial resilience. Given these dynamics, I judge KLA to have a slightly better risk-adjusted profile in 2026.
Final Verdict: Which stock to choose?
Broadcom Inc. wields unmatched efficiency, driving robust growth and high returns on invested capital. Its superpower lies in scale and profitability, though its lofty valuation calls for caution. It fits aggressive growth portfolios willing to weather valuation volatility for superior earnings expansion.
KLA Corporation’s strategic moat is its exceptional return on equity and capital efficiency, underpinned by strong balance sheet discipline. Compared to Broadcom, it offers better stability and accelerating price momentum. This makes it suitable for GARP investors seeking growth with a margin of safety.
If you prioritize aggressive expansion and market dominance, Broadcom stands out due to its proven value creation despite premium multiples. However, if you seek superior stability combined with efficient capital deployment, KLA offers a compelling scenario with accelerating growth and a durable moat. Both demand careful risk management given elevated valuations.
Disclaimer: Investment carries a risk of loss of initial capital. The past performance is not a reliable indicator of future results. Be sure to understand risks before making an investment decision.
Go Further
I encourage you to read the complete analyses of Broadcom Inc. and KLA Corporation to enhance your investment decisions: