Home > Comparison > Technology > AVGO vs INTC
The strategic rivalry between Broadcom Inc. and Intel Corporation shapes the semiconductor industry’s future. Broadcom operates as a diversified technology firm, blending semiconductor design with infrastructure software solutions. Intel, a legacy chip manufacturer, focuses on high-performance computing and platform products. This head-to-head reflects a clash between Broadcom’s integrated growth model and Intel’s scale-driven innovation. This analysis will clarify which path offers superior risk-adjusted returns for a balanced, diversified portfolio in 2026.
Table of contents
Companies Overview
Broadcom and Intel dominate the semiconductor landscape with distinct strategic approaches and market footprints.
Broadcom Inc.: Semiconductor Infrastructure Powerhouse
Broadcom excels as a leading supplier of semiconductor and infrastructure software solutions. Its revenue stems from diverse segments including wired infrastructure, wireless communications, and enterprise storage. In 2026, Broadcom focuses on integrating complex sub-systems and firmware, reinforcing its competitive edge in networking and data center applications.
Intel Corporation: Pioneer in Computing Technologies
Intel stands as a major designer and manufacturer of computer products and platforms. It generates revenue through central processing units, chipsets, and high-performance compute solutions for cloud and embedded markets. Intel’s 2026 strategy centers on AI-driven innovations and workload-optimized platforms, targeting verticals like healthcare and autonomous driving.
Strategic Collision: Similarities & Divergences
Both companies thrive in semiconductors but differ in approach: Broadcom emphasizes integrated infrastructure solutions while Intel pursues broad computing platforms with AI integration. Their primary battle is for dominance in data center and cloud service markets. Investors face contrasting profiles: Broadcom’s diversified, high-margin segments versus Intel’s scale and AI-driven platform evolution.
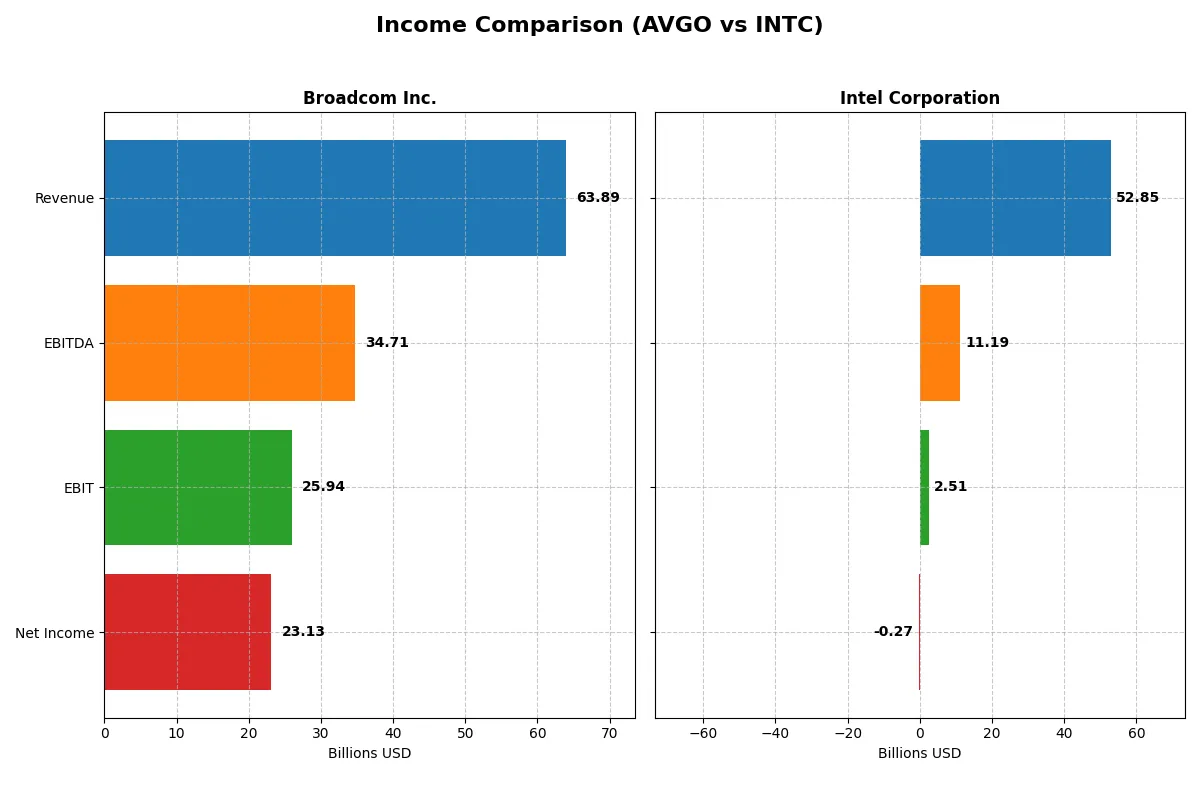
Income Statement Comparison
This data dissects the core profitability and scalability of both corporate engines to reveal who dominates the bottom line:
| Metric | Broadcom Inc. (AVGO) | Intel Corporation (INTC) |
|---|---|---|
| Revenue | 63.9B | 52.9B |
| Cost of Revenue | 20.6B | 34.4B |
| Operating Expenses | 17.8B | 20.6B |
| Gross Profit | 43.3B | 18.5B |
| EBITDA | 34.7B | 11.2B |
| EBIT | 25.9B | 2.5B |
| Interest Expense | 3.2B | 953M |
| Net Income | 23.1B | -267M |
| EPS | 4.91 | -0.08 |
| Fiscal Year | 2025 | 2025 |
Income Statement Analysis: The Bottom-Line Duel
This income statement comparison reveals which company converts revenue into profit with the greatest efficiency and momentum.
Broadcom Inc. Analysis
Broadcom’s revenue surged from 27.5B in 2021 to 63.9B in 2025, more than doubling. Net income followed suit, growing from 6.4B to 23.1B, showcasing robust profitability. Its gross margin stands at a strong 67.8%, and net margin at 36.2%, reflecting exceptional operational efficiency and margin expansion in 2025.
Intel Corporation Analysis
Intel’s revenue declined from 79.0B in 2021 to 52.9B in 2025, a significant contraction. Net income swung from a 19.9B profit in 2021 to a 267M loss in 2025, signaling profitability challenges. Gross margin remains moderate at 35.0%, but net margin turned negative, underscoring margin pressure and operational inefficiencies despite a recent EBIT improvement.
Margin Supremacy vs. Revenue Contraction
Broadcom outperforms Intel with superior revenue growth and margins, converting sales into profit more effectively. Intel faces a shrinking top line and negative net income, eroding investor confidence. For investors prioritizing consistent profit generation, Broadcom’s profile offers a stronger, more reliable earnings engine.
Financial Ratios Comparison
These vital ratios act as a diagnostic tool to expose the underlying fiscal health, valuation premiums, and capital efficiency of two leading semiconductor firms:
| Ratios | Broadcom Inc. (AVGO) | Intel Corporation (INTC) |
|---|---|---|
| ROE | 28.4% | -0.2% |
| ROIC | 16.4% | -0.0% |
| P/E | 73.9x | -658.4x |
| P/B | 21.0x | 1.54x |
| Current Ratio | 1.71 | 2.02 |
| Quick Ratio | 1.58 | 1.65 |
| D/E (Debt-to-Equity) | 0.80 | 0.41 |
| Debt-to-Assets | 38.1% | 22.0% |
| Interest Coverage | 7.94 | -2.23 |
| Asset Turnover | 0.37 | 0.25 |
| Fixed Asset Turnover | 25.3 | 0.50 |
| Payout ratio | 48.2% | 0% |
| Dividend yield | 0.65% | 0% |
| Fiscal Year | 2025 | 2025 |
Efficiency & Valuation Duel: The Vital Signs
Financial ratios serve as a company’s DNA, exposing hidden risks and revealing operational strengths critical to investors’ decisions.
Broadcom Inc.
Broadcom exhibits strong profitability with a 28.45% ROE and a robust 36.2% net margin, signaling operational efficiency. However, its valuation appears stretched, trading at a high P/E of 73.87 and a P/B of 21.01. Shareholders receive modest dividends (0.65%), while the company aggressively reinvests in R&D, fueling growth.
Intel Corporation
Intel shows negative profitability metrics with ROE at -0.23% and a net margin of -0.51%, reflecting ongoing struggles. Its valuation metrics seem attractive or depressed, with a negative P/E and a neutral P/B of 1.54. Intel pays no dividend, focusing capital on restructuring and R&D to revive competitiveness.
Premium Valuation vs. Operational Safety
Broadcom’s solid profitability contrasts with Intel’s financial challenges. Broadcom’s premium valuation reflects confidence in growth and returns, while Intel’s lower multiples signal risk but potential turnaround. Investors seeking stability may prefer Broadcom; those willing to tolerate risk for value might consider Intel’s recovery profile.
Which one offers the Superior Shareholder Reward?
Broadcom (AVGO) delivers a more attractive shareholder reward than Intel (INTC) in 2026. AVGO pays a modest 0.65% dividend yield with a sustainable 48% payout, backed by strong free cash flow of 5.7/share and robust buybacks. INTC offers no dividend in 2025 and suffers negative free cash flow (-1B), relying on reinvestment amid weak margins and debt pressure. AVGO’s disciplined capital allocation, combining steady dividends and intense buybacks, supports long-term value more reliably than INTC’s current turnaround strategy. I favor Broadcom for total return and stability.
Comparative Score Analysis: The Strategic Profile
The radar chart reveals the fundamental DNA and trade-offs of Broadcom Inc. and Intel Corporation, highlighting their financial strengths and weaknesses:
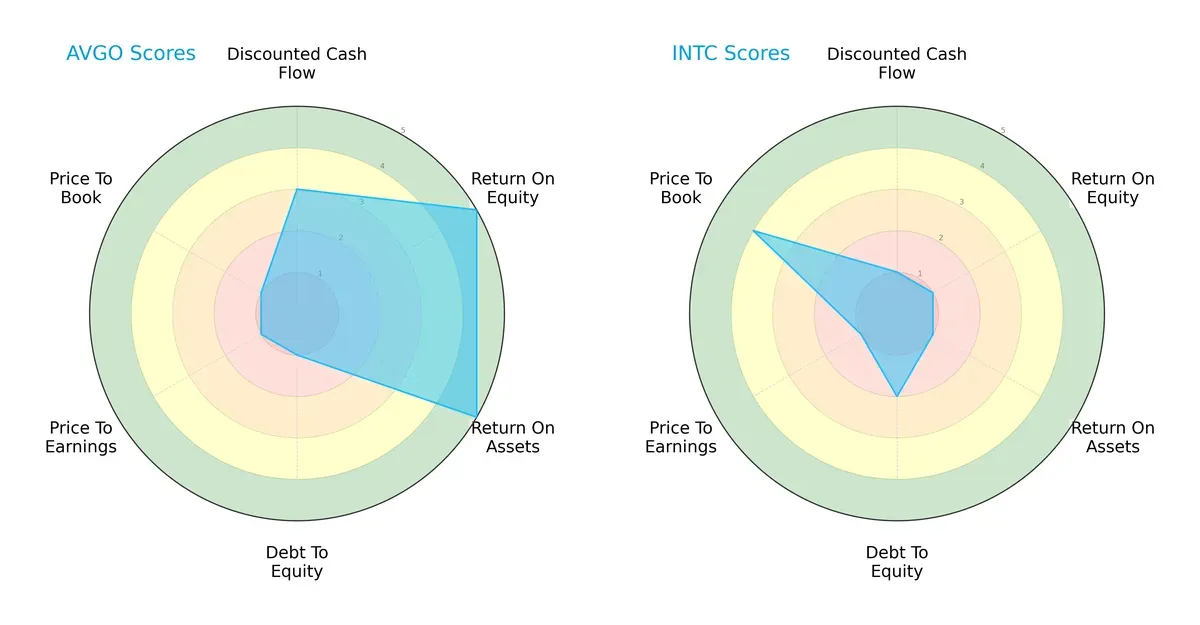
Broadcom shows strong ROE and ROA scores (5 each), signaling efficient profit generation and asset use. However, it suffers from weak debt-to-equity and valuation scores (all 1), implying high leverage and overvaluation risks. Intel has a more moderate debt profile (score 2) and a favorable price-to-book score (4), but it lags sharply in profitability metrics (ROE and ROA at 1) and DCF (1). Broadcom’s profile is more unbalanced yet powerful, relying heavily on operational efficiency. Intel presents a more conservative, though less profitable, stance with better valuation metrics.
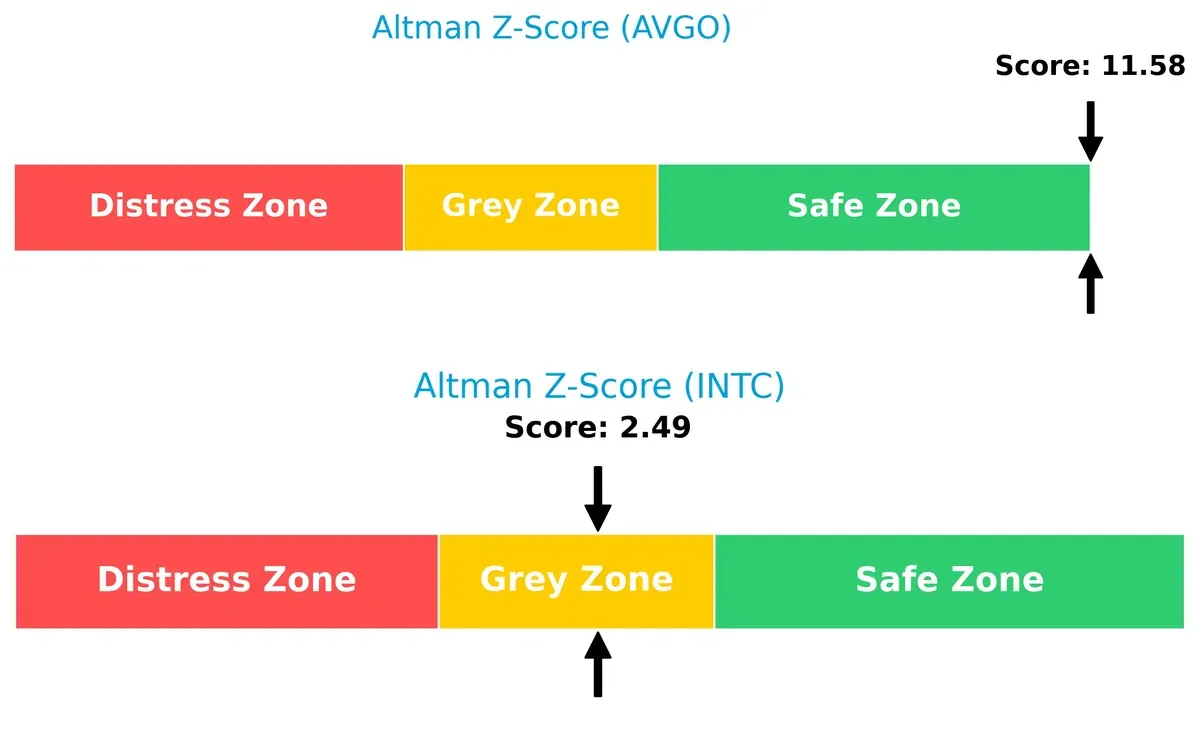
Bankruptcy Risk: Solvency Showdown
Broadcom’s Altman Z-Score of 11.6 places it comfortably in the safe zone, while Intel’s 2.5 positions it in the grey zone, indicating moderate bankruptcy risk in this cycle:
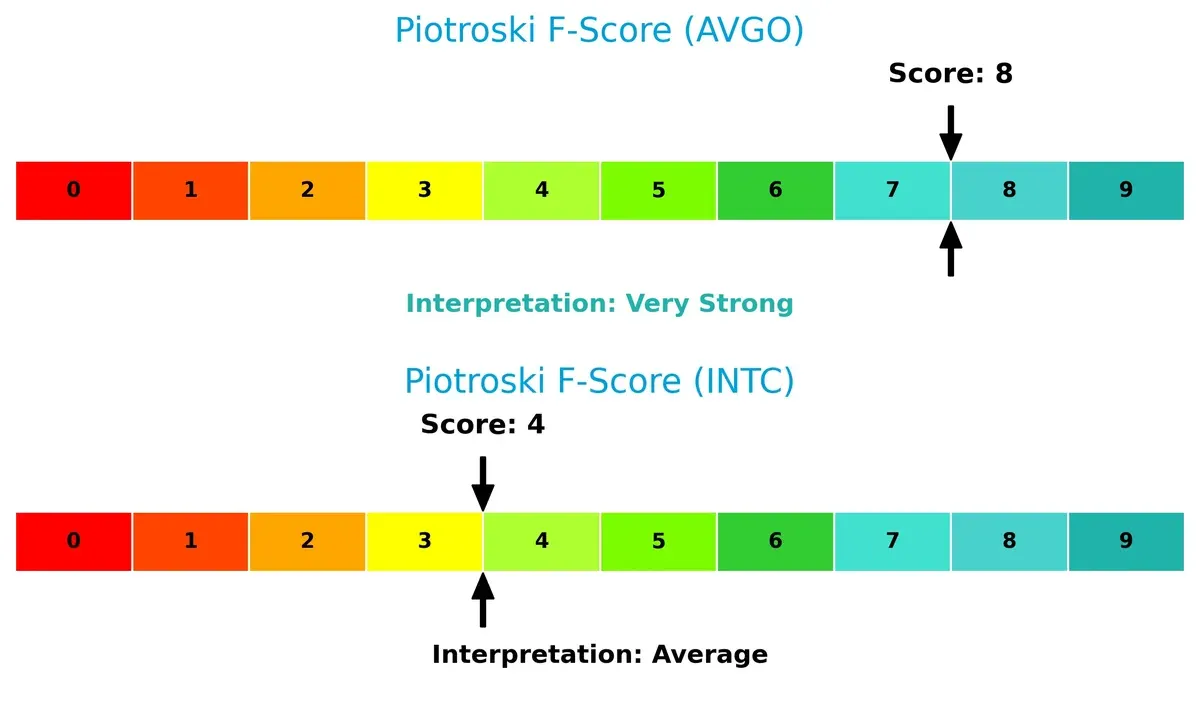
Financial Health: Quality of Operations
Broadcom’s Piotroski F-Score of 8 reflects very strong financial health, contrasting with Intel’s average score of 4, which raises red flags about internal operational metrics:
How are the two companies positioned?
This section dissects Broadcom and Intel’s operational DNA by comparing revenue distribution by segment and analyzing their internal strengths and weaknesses. The final objective confronts their economic moats to reveal which model delivers the most resilient, sustainable competitive advantage today.
Revenue Segmentation: The Strategic Mix
This visual comparison dissects how Broadcom Inc. and Intel Corporation diversify their income streams and highlights their primary sector bets:
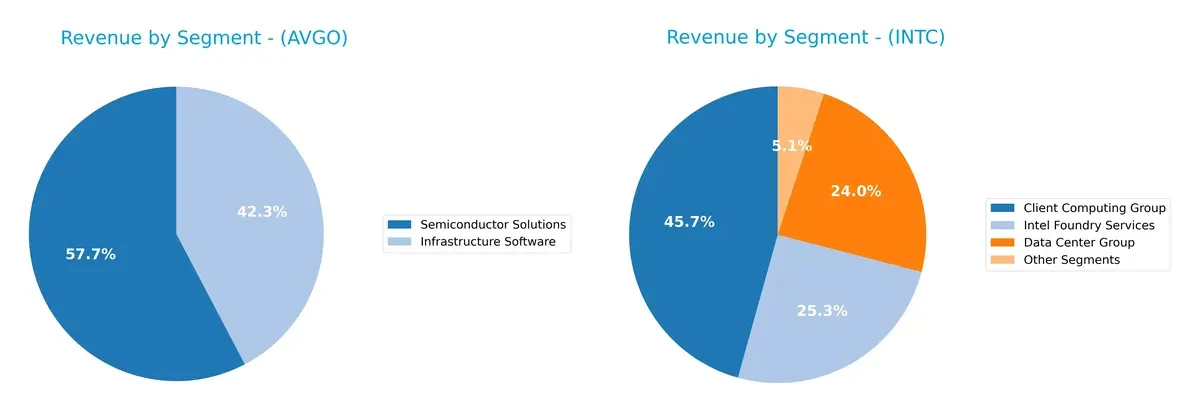
Broadcom anchors revenue in two main segments: Semiconductor Solutions at $36.9B and Infrastructure Software at $27B, showing moderate diversification. Intel reveals a broader mix, with Client Computing Group leading at $32.2B, but also strong bets in Intel Foundry Services ($17.8B) and Data Center Group ($16.9B). Intel’s diversification mitigates concentration risk, while Broadcom’s focus may deepen ecosystem lock-in but exposes it to sector-specific cycles.
Strengths and Weaknesses Comparison
This table compares the Strengths and Weaknesses of Broadcom Inc. and Intel Corporation:
Broadcom Strengths
- High net margin at 36.2%
- Strong ROE at 28.45%
- Favorable ROIC at 16.36%
- Diversified revenue in software and semiconductors
- Solid current and quick ratios above 1.5
- Global sales strong in Asia Pacific and Americas
Intel Strengths
- Favorable price-to-earnings ratio despite losses
- Strong liquidity with current ratio of 2.02
- Low debt-to-equity and debt-to-assets ratios
- Diversified revenue streams including foundry and data center
- Significant U.S. and Asian market presence
Broadcom Weaknesses
- High PE at 73.87 indicating expensive valuation
- Unfavorable price-to-book at 21.01
- Asset turnover low at 0.37
- Dividend yield low at 0.65%
- Moderate debt levels with neutral status
- Lower market share in client computing
Intel Weaknesses
- Negative profitability metrics: net margin, ROE, ROIC all unfavorable
- Unfavorable asset and fixed asset turnover ratios
- No dividend yield
- Interest coverage only neutral at 2.63
- Higher proportion of unfavorable financial ratios overall
Broadcom shows strong profitability and balanced global diversification but faces valuation concerns and moderate efficiency issues. Intel struggles with profitability despite good liquidity and lower leverage, indicating structural challenges affecting returns and operational efficiency.
The Moat Duel: Analyzing Competitive Defensibility
A structural moat is the only reliable shield protecting long-term profits from relentless competitive erosion:
Broadcom Inc.: Scalable Network Effects Moat
Broadcom’s competitive edge stems from powerful network effects embedded in its semiconductor and infrastructure software. This manifests in a high ROIC, stable margins, and 34% ROIC growth through 2025. New product launches and Asian market expansion in 2026 should deepen this moat.
Intel Corporation: Legacy Cost Structure Moat
Intel relies on cost advantages from scale and integrated manufacturing but faces declining ROIC and shrinking margins. Unlike Broadcom, Intel’s moat is eroding, with a negative ROIC trend signaling value destruction. Strategic pivots toward AI and autonomous driving may offer turnaround potential but remain uncertain.
RoIC Supremacy vs. Cost Legacy: Who Holds the Moat Edge?
Broadcom boasts a wider and deeper moat with a ROIC 7% above WACC and rising profitability. Intel’s negative ROIC and declining returns reveal a fragile moat. Broadcom is clearly better positioned to defend and grow its market share in 2026.
Which stock offers better returns?
The past year shows Broadcom’s stock surging sharply before recent weakness, while Intel’s price edged higher steadily with accelerating gains and growing buyer interest.
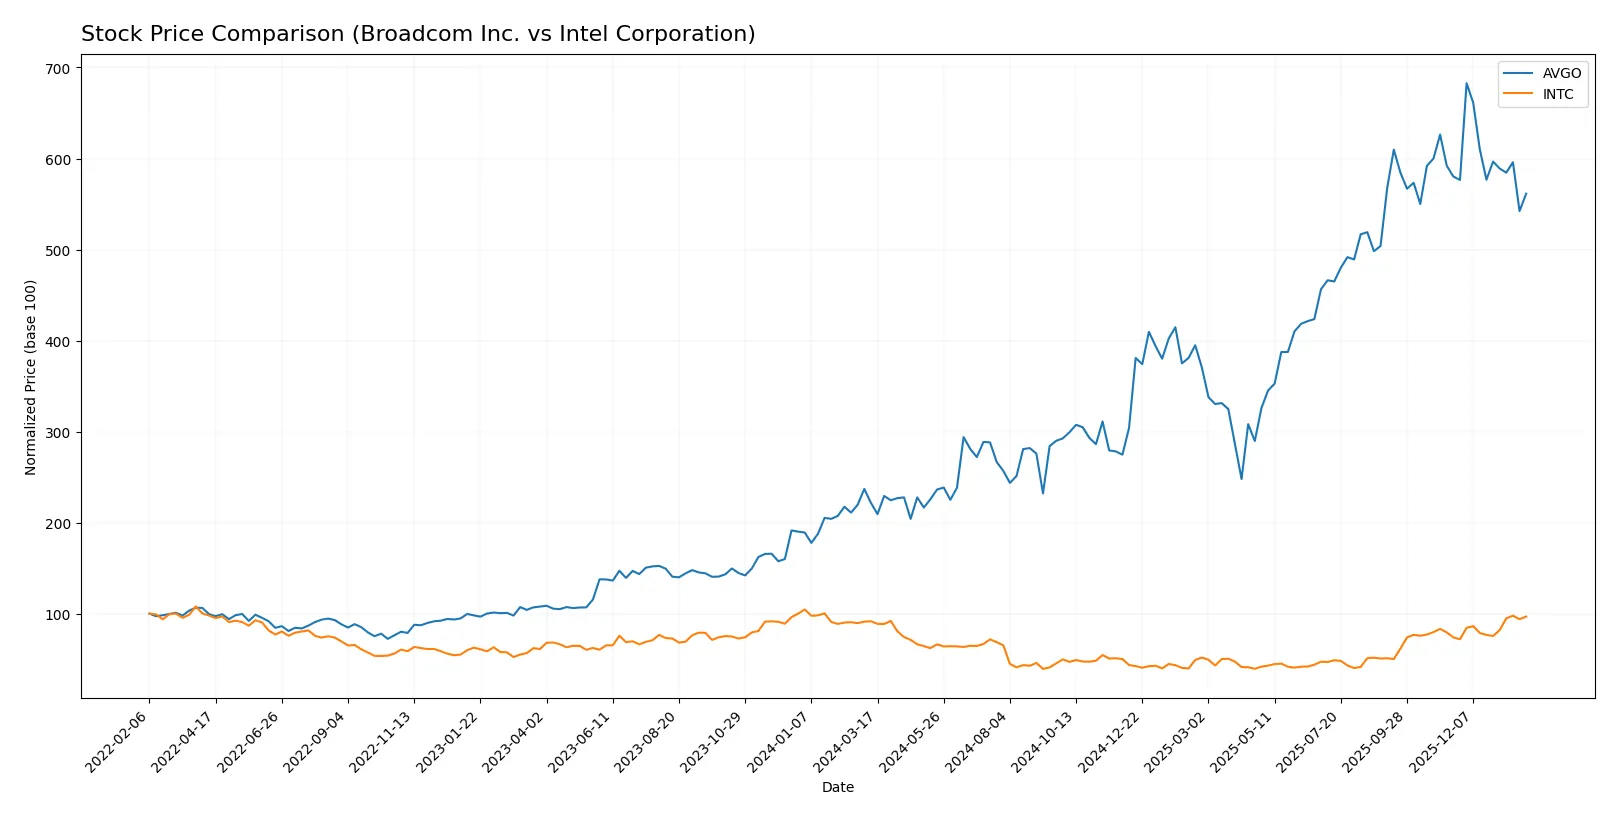
Trend Comparison
Broadcom’s stock rose 153.15% over the last 12 months, marking a strong bullish trend despite recent deceleration and a 3.26% drop since November 2025. Volatility remains high with a 78.96 standard deviation.
Intel’s shares gained 5.61% over the year, showing a bullish trend with accelerating momentum. Since November 2025, Intel’s price climbed 30.83%, supported by low volatility and steady buyer dominance.
Broadcom outperformed Intel in total annual returns, yet Intel’s recent upward acceleration and volume increase suggest improving market confidence relative to Broadcom’s recent pullback.
Target Prices
Analysts present a cautiously optimistic consensus for Broadcom Inc. and Intel Corporation.
| Company | Target Low | Target High | Consensus |
|---|---|---|---|
| Broadcom Inc. | 370 | 510 | 450.12 |
| Intel Corporation | 20 | 66 | 46.95 |
Broadcom’s target consensus sits about 36% above its current price of 331.3, signaling strong upside potential. Intel’s target consensus aligns closely with its current price of 46.47, reflecting more tempered analyst expectations.

Don’t Let Luck Decide Your Entry Point
Optimize your entry points with our advanced ProRealTime indicators. You’ll get efficient buy signals with precise price targets for maximum performance. Start outperforming now!
How do institutions grade them?
Broadcom Inc. Grades
The latest institutional grades for Broadcom Inc. show consistent positive ratings:
| Grading Company | Action | New Grade | Date |
|---|---|---|---|
| Wells Fargo | Upgrade | Overweight | 2026-01-15 |
| Mizuho | Maintain | Outperform | 2026-01-09 |
| Truist Securities | Maintain | Buy | 2025-12-19 |
| UBS | Maintain | Buy | 2025-12-15 |
| B of A Securities | Maintain | Buy | 2025-12-12 |
| Mizuho | Maintain | Outperform | 2025-12-12 |
| TD Cowen | Maintain | Buy | 2025-12-12 |
| Benchmark | Maintain | Buy | 2025-12-12 |
| Keybanc | Maintain | Overweight | 2025-12-12 |
| Rosenblatt | Maintain | Buy | 2025-12-12 |
Intel Corporation Grades
Institutional grades for Intel Corporation display more mixed ratings with several neutral positions:
| Grading Company | Action | New Grade | Date |
|---|---|---|---|
| RBC Capital | Maintain | Sector Perform | 2026-01-23 |
| Keybanc | Maintain | Overweight | 2026-01-23 |
| Evercore ISI Group | Maintain | In Line | 2026-01-23 |
| Needham | Maintain | Hold | 2026-01-23 |
| Benchmark | Maintain | Buy | 2026-01-23 |
| Rosenblatt | Maintain | Sell | 2026-01-23 |
| UBS | Maintain | Neutral | 2026-01-23 |
| Citigroup | Maintain | Neutral | 2026-01-23 |
| Stifel | Maintain | Hold | 2026-01-23 |
| Wedbush | Maintain | Neutral | 2026-01-23 |
Which company has the best grades?
Broadcom Inc. has consistently higher grades with multiple “Buy” and “Outperform” ratings. Intel shows more neutral and mixed ratings, including a “Sell.” This suggests Broadcom enjoys stronger institutional confidence, potentially impacting investor sentiment positively.
Risks specific to each company
The following categories identify critical pressure points and systemic threats facing Broadcom Inc. and Intel Corporation in the 2026 market environment:
1. Market & Competition
Broadcom Inc.
- Dominates high-margin semiconductor niches with strong ROIC, but faces pricing pressure from peers.
Intel Corporation
- Struggles with negative margins and ROE, battling fierce competition and market share loss.
2. Capital Structure & Debt
Broadcom Inc.
- Moderate leverage with debt-to-assets at 38%, interest coverage strong at 8x.
Intel Corporation
- Lower leverage at 22%, but weaker interest coverage at 2.6x signals caution on debt servicing.
3. Stock Volatility
Broadcom Inc.
- Beta of 1.22 implies moderate volatility; valuation stretched with high P/E and P/B ratios.
Intel Corporation
- Higher beta at 1.35 shows elevated volatility; undervalued price multiples reflect market skepticism.
4. Regulatory & Legal
Broadcom Inc.
- Faces regulatory scrutiny typical for large tech firms, but well-prepared with compliance resources.
Intel Corporation
- Undergoes intense antitrust and trade regulation pressures, impacting operational flexibility.
5. Supply Chain & Operations
Broadcom Inc.
- Diverse product portfolio reduces supply chain risk; operational efficiency high with fixed asset turnover strong.
Intel Corporation
- Operational challenges evident in low asset turnover; supply chain disruptions weigh on production capacity.
6. ESG & Climate Transition
Broadcom Inc.
- Increasing investments in alternative energy systems; ESG initiatives improving but data limited.
Intel Corporation
- ESG efforts growing; however, large footprint and legacy manufacturing processes complicate transition.
7. Geopolitical Exposure
Broadcom Inc.
- Global footprint exposes it to trade tensions but diversified customer base mitigates impact.
Intel Corporation
- Significant exposure to geopolitical risks due to heavy reliance on global manufacturing and supply chains.
Which company shows a better risk-adjusted profile?
Broadcom’s dominant profitability and strong balance sheet present a better risk-adjusted profile than Intel’s operational and profitability struggles. Intel’s negative margins and moderate debt coverage pose higher financial risk. Broadcom’s high valuation multiples remain a cautionary flag amid market uncertainty.
Final Verdict: Which stock to choose?
Broadcom Inc. (AVGO) excels as a cash-generating powerhouse with a durable competitive advantage. Its rising ROIC well above WACC signals efficient capital use and strong value creation. The point of vigilance lies in its elevated valuation multiples, which may pressure returns. It suits an aggressive growth portfolio willing to pay for quality and momentum.
Intel Corporation (INTC) presents a strategic moat rooted in its legacy semiconductor infrastructure and ongoing R&D investments. It offers better balance sheet stability and lower leverage than Broadcom. However, Intel is currently shedding value with declining profitability metrics. It fits a GARP portfolio targeting turnaround potential at a more reasonable price.
If you prioritize consistent value creation and scalable profitability, Broadcom outshines Intel due to its robust moat and superior returns on invested capital. However, if you seek a contrarian play with more safety margin and a chance at recovery, Intel offers better stability and a lower entry point despite near-term headwinds. Each scenario requires careful risk management aligned with your investment horizon.
Disclaimer: Investment carries a risk of loss of initial capital. The past performance is not a reliable indicator of future results. Be sure to understand risks before making an investment decision.
Go Further
I encourage you to read the complete analyses of Broadcom Inc. and Intel Corporation to enhance your investment decisions: