In the fast-evolving semiconductor industry, Broadcom Inc. (AVGO) and indie Semiconductor, Inc. (INDI) stand out for their innovative approaches and market focus. Broadcom, a global technology giant, offers a broad product range across wired and wireless infrastructure, while indie Semiconductor targets cutting-edge automotive applications. This article will explore their strengths and strategies to help you decide which company offers the most compelling investment opportunity.
Table of contents
Companies Overview
I will begin the comparison between Broadcom Inc. and indie Semiconductor, Inc. by providing an overview of these two companies and their main differences.
Broadcom Inc. Overview
Broadcom Inc. is a global technology company specializing in the design, development, and supply of semiconductor and infrastructure software solutions. Headquartered in Palo Alto, California, it operates through four segments: Wired Infrastructure, Wireless Communications, Enterprise Storage, and Industrial & Other. Broadcom’s products serve diverse markets including data centers, telecommunications, and industrial automation, supported by a workforce of 37,000 employees.
indie Semiconductor, Inc. Overview
indie Semiconductor, Inc. focuses on providing automotive semiconductors and software solutions aimed at advanced driver assistance, connected cars, and electrification. Based in Aliso Viejo, California, the company offers a range of devices including sensors, wireless charging, and photonic components for automotive and optical communication markets. indie Semiconductor employs approximately 920 people and emphasizes innovation in automotive user experience and connectivity.
Key similarities and differences
Both Broadcom and indie Semiconductor are positioned in the semiconductor industry and headquartered in California, focusing on technology-driven solutions. Broadcom is a large-cap, diversified company with a broad product portfolio across multiple sectors, while indie Semiconductor is a smaller, specialized firm concentrating on automotive applications and advanced driver assistance. Their scale, market capitalization, and segment diversity illustrate contrasting business models within the same industry.
Income Statement Comparison
The table below presents a side-by-side comparison of the latest fiscal year income statement metrics for Broadcom Inc. and indie Semiconductor, Inc.
| Metric | Broadcom Inc. (AVGO) | indie Semiconductor, Inc. (INDI) |
|---|---|---|
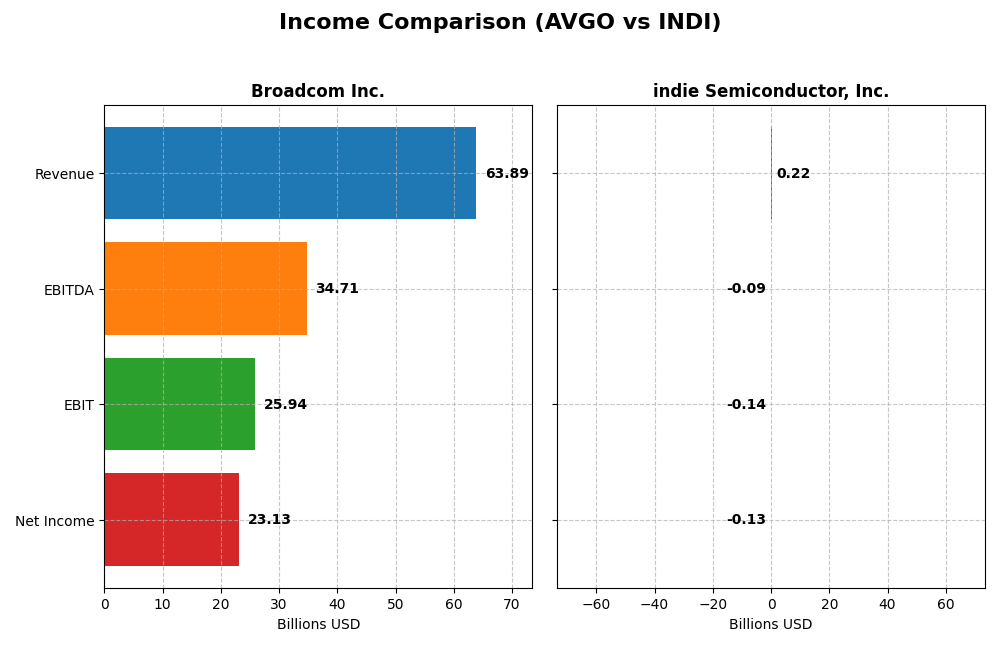
| Market Cap | 1.60T | 861M |
| Revenue | 63.9B | 217M |
| EBITDA | 34.7B | -94M |
| EBIT | 25.9B | -137M |
| Net Income | 23.1B | -133M |
| EPS | 4.91 | -0.76 |
| Fiscal Year | 2025 | 2024 |
Income Statement Interpretations
Broadcom Inc.
Broadcom Inc. has demonstrated robust revenue growth from $27.45B in 2021 to $63.89B in 2025, with net income rising substantially to $23.13B in 2025. Margins have improved notably, with a gross margin of 67.77% and net margin at 36.2% in 2025. The latest year showed strong expansion in revenues and profits, with net margin growth exceeding 200%, indicating enhanced profitability and operational efficiency.
indie Semiconductor, Inc.
indie Semiconductor’s revenue increased from $48.4M in 2021 to $217M in 2024, reflecting significant growth over the period. However, net income remained negative, with a loss of $133M in 2024. Margins are mixed: gross margin is positive at 41.68%, but net margin is deeply negative at -61.2%. The latest year showed a slight decline in revenue and worsening EBIT margin, highlighting ongoing challenges in reaching profitability.
Which one has the stronger fundamentals?
Broadcom’s consistent revenue and profit growth, paired with strong and improving margins, indicate solid income fundamentals. In contrast, indie Semiconductor shows rapid revenue growth but sustained losses and unfavorable net margin trends, reflecting higher risk and operational challenges. Overall, Broadcom’s income statement reflects more favorable and stable financial health compared to indie Semiconductor.
Financial Ratios Comparison
The table below presents a side-by-side comparison of key financial ratios for Broadcom Inc. (AVGO) and indie Semiconductor, Inc. (INDI), based on their most recent fiscal year data.
| Ratios | Broadcom Inc. (AVGO) 2025 | indie Semiconductor, Inc. (INDI) 2024 |
|---|---|---|
| ROE | 28.4% | -31.7% |
| ROIC | 16.4% | -19.3% |
| P/E | 73.9 | -5.35 |
| P/B | 21.0 | 1.70 |
| Current Ratio | 1.71 | 4.82 |
| Quick Ratio | 1.58 | 4.23 |
| D/E | 0.80 | 0.95 |
| Debt-to-Assets | 38.1% | 42.3% |
| Interest Coverage | 7.94 | -18.4 |
| Asset Turnover | 0.37 | 0.23 |
| Fixed Asset Turnover | 25.3 | 4.30 |
| Payout ratio | 48.2% | 0% |
| Dividend yield | 0.65% | 0% |
Interpretation of the Ratios
Broadcom Inc.
Broadcom exhibits predominantly strong financial ratios with favorable net margin at 36.2%, ROE at 28.45%, and ROIC at 16.36%, indicating solid profitability and efficient capital use. However, high valuation multiples like a PE of 73.87 and PB of 21.01 raise caution. The company pays dividends with a modest yield of 0.65%, supported by free cash flow, though the yield is relatively low, suggesting restrained distributions.
indie Semiconductor, Inc.
indie Semiconductor shows weak financial ratios with negative net margin (-61.2%), ROE (-31.73%), and ROIC (-19.25%), reflecting operational losses and capital inefficiency. The firm does not pay dividends, consistent with its negative earnings and focus on growth and R&D. A high current ratio (4.82) contrasts with poor interest coverage (-14.8), indicating liquidity but financial stress and operational challenges.
Which one has the best ratios?
Broadcom’s ratios are overall more favorable, demonstrating profitability, solid returns, and stable liquidity, despite high valuation measures. indie Semiconductor’s ratios reveal significant weaknesses, with persistent losses and unfavorable profitability metrics. Hence, Broadcom presents a stronger financial profile relative to indie Semiconductor based on the analyzed ratios.
Strategic Positioning
This section compares the strategic positioning of Broadcom Inc. and indie Semiconductor, Inc., focusing on market position, key segments, and exposure to technological disruption:
Broadcom Inc.
- Global technology leader with large market cap and moderate competitive pressure in semiconductors.
- Operates diversified segments: Infrastructure Software and Semiconductor Solutions drive revenues.
- Positioned in mature semiconductor and software markets with limited information on disruption.
indie Semiconductor, Inc.
- Smaller market cap, higher beta, facing intense competition in automotive semiconductors.
- Focused on automotive semiconductors and software for ADAS and connected car applications.
- Exposure to disruption through advanced photonic and automotive technology platforms.
Broadcom Inc. vs indie Semiconductor, Inc. Positioning
Broadcom shows a diversified business model across software and semiconductor solutions providing stability, whereas indie Semiconductor concentrates on automotive semiconductor applications, which may offer growth but with higher market and technological risks.
Which has the best competitive advantage?
Broadcom demonstrates a very favorable moat with growing ROIC and value creation, indicating a durable competitive advantage. indie Semiconductor has a very unfavorable moat with declining ROIC, reflecting value destruction and weaker competitive positioning.
Stock Comparison
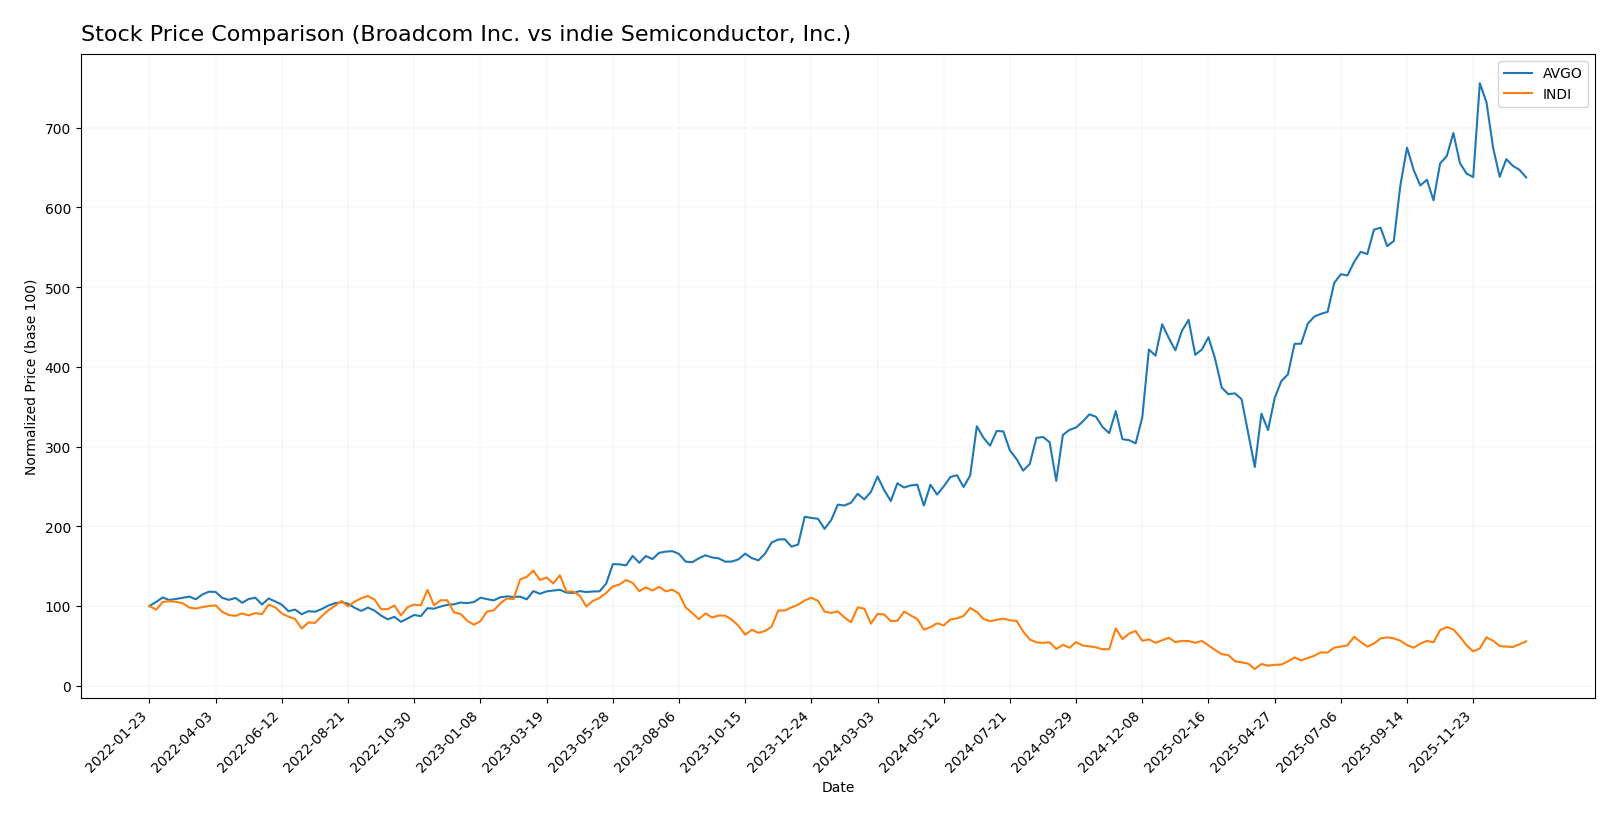
The stock price movements over the past 12 months reveal a strong bullish trend for Broadcom Inc. with significant gains, while indie Semiconductor, Inc. exhibits a pronounced bearish trajectory, reflecting divergent market dynamics between the two.
Trend Analysis
Broadcom Inc. (AVGO) experienced a 162.18% price increase over the past year, indicating a bullish trend with deceleration in momentum. Price volatility is high, with a standard deviation of 78.56, and a peak price of 402.96.
indie Semiconductor, Inc. (INDI) showed a -28.33% price change over the same period, confirming a bearish trend with deceleration. Volatility remains low at 1.35 standard deviation, and the stock reached a high of 7.43.
Comparing the two, Broadcom Inc. delivered the highest market performance with a strong positive return, while indie Semiconductor, Inc. declined significantly in value.
Target Prices
The current analyst consensus for target prices reveals a generally optimistic outlook for these semiconductor companies.
| Company | Target High | Target Low | Consensus |
|---|---|---|---|
| Broadcom Inc. | 510 | 370 | 454.8 |
| indie Semiconductor, Inc. | 8 | 8 | 8 |
Analysts expect Broadcom’s price to rise significantly from its current 339.89 USD, indicating strong growth potential. Indie Semiconductor’s consensus target of 8 USD suggests a moderate upside from its current 4.25 USD trading price.
Analyst Opinions Comparison
This section compares analysts’ ratings and grades for Broadcom Inc. and indie Semiconductor, Inc.:
Rating Comparison
Broadcom Inc. Rating
- Rating: B, assessed as Very Favorable
- Discounted Cash Flow Score: 3, Moderate rating
- ROE Score: 5, Very Favorable rating
- ROA Score: 5, Very Favorable rating
- Debt To Equity Score: 1, Very Unfavorable rating
- Overall Score: 3, Moderate rating
indie Semiconductor, Inc. Rating
- Rating: C-, assessed as Very Favorable
- Discounted Cash Flow Score: 1, Very Unfavorable rating
- ROE Score: 1, Very Unfavorable rating
- ROA Score: 1, Very Unfavorable rating
- Debt To Equity Score: 1, Very Unfavorable rating
- Overall Score: 1, Very Unfavorable rating
Which one is the best rated?
Broadcom Inc. holds a higher rating (B) and stronger financial scores in ROE and ROA compared to indie Semiconductor, Inc. (C-). Broadcom’s overall and DCF scores are also more favorable, indicating it is better rated based on these data.
Scores Comparison
Here is a comparison of the Altman Z-Score and Piotroski Score for Broadcom Inc. and indie Semiconductor, Inc.:
Broadcom Inc. Scores
- Altman Z-Score: 12.13, indicating a safe zone with very low bankruptcy risk.
- Piotroski Score: 8, classified as very strong financial health.
indie Semiconductor, Inc. Scores
- Altman Z-Score: 0.12, indicating distress zone and high bankruptcy risk.
- Piotroski Score: 2, classified as very weak financial health.
Which company has the best scores?
Broadcom Inc. clearly outperforms indie Semiconductor, Inc., showing a safe zone Altman Z-Score and a very strong Piotroski Score, while indie Semiconductor is in financial distress with very weak Piotroski results.
Grades Comparison
The following section compares the recent grades assigned to Broadcom Inc. and indie Semiconductor, Inc. by reputable grading companies:
Broadcom Inc. Grades
This table summarizes recent grades assigned by recognized financial institutions for Broadcom Inc.:
| Grading Company | Action | New Grade | Date |
|---|---|---|---|
| Mizuho | Maintain | Outperform | 2026-01-09 |
| Truist Securities | Maintain | Buy | 2025-12-19 |
| UBS | Maintain | Buy | 2025-12-15 |
| Benchmark | Maintain | Buy | 2025-12-12 |
| Rosenblatt | Maintain | Buy | 2025-12-12 |
| Piper Sandler | Maintain | Overweight | 2025-12-12 |
| TD Cowen | Maintain | Buy | 2025-12-12 |
| B of A Securities | Maintain | Buy | 2025-12-12 |
| JP Morgan | Maintain | Overweight | 2025-12-12 |
| Mizuho | Maintain | Outperform | 2025-12-12 |
Broadcom Inc. consistently receives strong buy and outperform ratings, reflecting positive analyst sentiment with no recent downgrades.
indie Semiconductor, Inc. Grades
This table summarizes recent grades assigned by recognized financial institutions for indie Semiconductor, Inc.:
| Grading Company | Action | New Grade | Date |
|---|---|---|---|
| UBS | Maintain | Neutral | 2025-11-10 |
| Benchmark | Maintain | Buy | 2025-06-25 |
| Benchmark | Maintain | Buy | 2025-06-11 |
| Benchmark | Maintain | Buy | 2025-05-21 |
| Benchmark | Maintain | Buy | 2025-05-13 |
| Craig-Hallum | Maintain | Buy | 2025-05-13 |
| Keybanc | Maintain | Overweight | 2025-05-13 |
| Benchmark | Maintain | Buy | 2025-04-09 |
| Benchmark | Maintain | Buy | 2025-02-21 |
| Keybanc | Maintain | Overweight | 2025-02-21 |
indie Semiconductor shows a generally positive outlook with multiple buy and overweight ratings, though UBS’s neutral rating suggests some caution.
Which company has the best grades?
Broadcom Inc. has received more consistently strong buy and outperform ratings compared to indie Semiconductor, which has a mix of buy and neutral ratings. This could indicate stronger analyst confidence in Broadcom’s prospects, potentially influencing investor sentiment towards greater stability and growth expectations.
Strengths and Weaknesses
Below is a comparison table summarizing the strengths and weaknesses of Broadcom Inc. (AVGO) and indie Semiconductor, Inc. (INDI) based on their recent financial and strategic data.
| Criterion | Broadcom Inc. (AVGO) | indie Semiconductor, Inc. (INDI) |
|---|---|---|
| Diversification | Strong diversification with $36.9B Semiconductor Solutions and $27.0B Infrastructure Software revenues (2025) | Limited diversification; majority revenue from products ($203M) with smaller services segment ($14M) |
| Profitability | High profitability: 36.2% net margin, 28.45% ROE, 16.36% ROIC | Negative profitability: -61.2% net margin, -31.7% ROE, -19.25% ROIC |
| Innovation | Demonstrates durable competitive advantage with growing ROIC (+34.4%) | Declining ROIC (-178.6%), value destroying with negative returns |
| Global presence | Significant global footprint supported by large-scale semiconductor and software operations | Smaller scale, less global reach reflected in lower revenues and market impact |
| Market Share | Large market share in semiconductor and infrastructure markets | Small and niche player with limited market share and financial challenges |
Key takeaways: Broadcom exhibits strong diversification, solid profitability, and a durable competitive advantage, making it a more stable and value-creating investment. indie Semiconductor struggles with profitability and declining returns, indicating higher risk and caution for investors.
Risk Analysis
Below is a comparative table of key risks for Broadcom Inc. (AVGO) and indie Semiconductor, Inc. (INDI) based on the most recent data:
| Metric | Broadcom Inc. (AVGO) | indie Semiconductor, Inc. (INDI) |
|---|---|---|
| Market Risk | Beta 1.22, moderate volatility | Beta 2.54, high volatility |
| Debt level | DE ratio 0.80, moderate debt | DE ratio 0.95, relatively high debt |
| Regulatory Risk | Moderate, established markets | Elevated, automotive tech focus |
| Operational Risk | Large scale, diversified ops | Smaller scale, niche automotive |
| Environmental Risk | Moderate, infrastructure focus | Moderate, automotive sector |
| Geopolitical Risk | US-based, global supply chains | US-based, supply chain sensitivity |
Broadcom’s most significant risks stem from its high valuation multiples and moderate debt, while indie Semiconductor faces higher market volatility, operational risks, and financial distress signs, including a very low Altman Z-score indicating potential bankruptcy risk. Investors should weigh Broadcom’s stability against indie’s higher risk and potential reward.
Which Stock to Choose?
Broadcom Inc. (AVGO) has shown strong income growth with a 23.87% revenue increase in 2025 and a favorable net margin of 36.2%. Its financial ratios are slightly favorable overall, with solid profitability and manageable debt levels, reflected in a very favorable rating and a durable competitive moat.
Indie Semiconductor, Inc. (INDI) reports mixed income trends, with a 2.91% revenue decline in 2024 and a negative net margin of -61.2%. The company faces unfavorable financial ratios, including low profitability and debt concerns, despite a very unfavorable moat evaluation and a weak credit profile.
For investors, AVGO might appear more suitable for those prioritizing stability and quality investing due to its strong income statement and favorable rating. Conversely, INDI could be considered by risk-tolerant investors seeking growth opportunities, given its volatile financials and unfavorable ratios.
Disclaimer: Investment carries a risk of loss of initial capital. The past performance is not a reliable indicator of future results. Be sure to understand risks before making an investment decision.
Go Further
I encourage you to read the complete analyses of Broadcom Inc. and indie Semiconductor, Inc. to enhance your investment decisions: