In the fast-evolving semiconductor industry, Broadcom Inc. (AVGO) and GLOBALFOUNDRIES Inc. (GFS) stand out as key players shaping technology’s future. Broadcom excels in designing integrated solutions across multiple sectors, while GLOBALFOUNDRIES focuses on advanced wafer fabrication services. Both companies compete in overlapping markets with distinct innovation strategies, making their comparison essential. Join me as we explore which company offers a more compelling opportunity for your investment portfolio.

Table of contents
Companies Overview
I will begin the comparison between Broadcom Inc. and GLOBALFOUNDRIES Inc. by providing an overview of these two companies and their main differences.
Broadcom Inc. Overview
Broadcom Inc. is a global technology company specializing in semiconductor and infrastructure software solutions. Headquartered in San Jose, California, it operates through four segments: Wired Infrastructure, Wireless Communications, Enterprise Storage, and Industrial & Other. Broadcom’s products serve diverse markets, including data center networking, smartphones, telecommunication equipment, and factory automation, employing around 37,000 people.
GLOBALFOUNDRIES Inc. Overview
GLOBALFOUNDRIES Inc. is a semiconductor foundry that manufactures integrated circuits for electronic devices worldwide. Based in Malta, New York, the company offers wafer fabrication services and produces a variety of semiconductor devices such as microprocessors, mobile application processors, and power management units. Founded in 2009, GLOBALFOUNDRIES employs approximately 13,000 people and focuses on manufacturing rather than software solutions.
Key similarities and differences
Both companies operate in the semiconductor industry and are listed on the NASDAQ Global Select exchange. Broadcom combines semiconductor products with infrastructure software solutions across multiple segments, while GLOBALFOUNDRIES concentrates on semiconductor manufacturing and wafer fabrication services. Broadcom’s broader product portfolio contrasts with GLOBALFOUNDRIES’ specialized foundry business model, reflecting differing market approaches within the same sector.
Income Statement Comparison
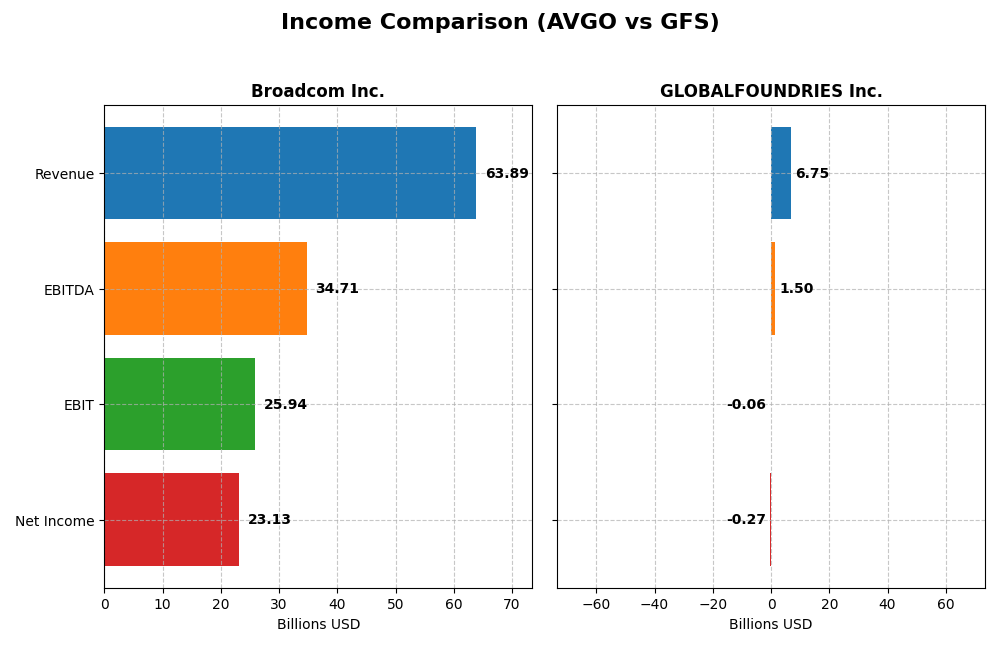
The table below compares key income statement metrics for Broadcom Inc. and GLOBALFOUNDRIES Inc. based on their most recent fiscal year results.
| Metric | Broadcom Inc. (AVGO) | GLOBALFOUNDRIES Inc. (GFS) |
|---|---|---|
| Market Cap | 1.6T | 23B |
| Revenue | 63.9B | 6.75B |
| EBITDA | 34.7B | 1.5B |
| EBIT | 25.9B | -64M |
| Net Income | 23.1B | -265M |
| EPS | 4.91 | -0.48 |
| Fiscal Year | 2025 | 2024 |
Income Statement Interpretations
Broadcom Inc.
Broadcom Inc. demonstrated strong growth in revenue and net income from 2021 to 2025, with revenue rising from $27.45B to $63.89B and net income surging from $6.44B to $23.13B. Margins improved notably, with gross margin at 67.77% and net margin reaching 36.2% in 2025. The latest year saw robust revenue and profit growth, alongside enhanced margins indicating operational efficiency.
GLOBALFOUNDRIES Inc.
GLOBALFOUNDRIES showed an overall increase in revenue from $4.85B in 2020 to $6.75B in 2024, and net income improved from a loss of $1.35B to a loss of $265M. Gross margin remained modest at 24.46%, but EBIT and net margins were negative in 2024. The most recent year revealed declining revenue and profitability, with margins deteriorating further compared to prior years.
Which one has the stronger fundamentals?
Broadcom’s income statement reflects strong fundamentals with consistent revenue and net income growth, high and improving margins, and favorable profitability ratios. Conversely, GLOBALFOUNDRIES faces challenges with negative EBIT and net margins, declining recent-year performance, and weaker margin profiles. Broadcom’s favorable evaluations contrast with GLOBALFOUNDRIES’ unfavorable trends, indicating stronger income fundamentals for Broadcom.
Financial Ratios Comparison
The table below presents a side-by-side comparison of key financial ratios for Broadcom Inc. and GLOBALFOUNDRIES Inc. based on their most recent fiscal year data.
| Ratios | Broadcom Inc. (AVGO) 2025 | GLOBALFOUNDRIES Inc. (GFS) 2024 |
|---|---|---|
| ROE | 28.4% | -2.46% |
| ROIC | 16.4% | -1.47% |
| P/E | 73.9 | -89.5 |
| P/B | 21.0 | 2.20 |
| Current Ratio | 1.71 | 2.11 |
| Quick Ratio | 1.58 | 1.57 |
| D/E (Debt-to-Equity) | 0.80 | 0.22 |
| Debt-to-Assets | 38.1% | 13.8% |
| Interest Coverage | 7.94 | -1.48 |
| Asset Turnover | 0.37 | 0.40 |
| Fixed Asset Turnover | 25.25 | 0.82 |
| Payout ratio | 48.2% | 0% |
| Dividend yield | 0.65% | 0% |
Interpretation of the Ratios
Broadcom Inc.
Broadcom displays mostly strong financial ratios, with favorable net margin at 36.2%, ROE at 28.45%, and ROIC at 16.36%, indicating efficient profitability and capital use. However, valuation metrics like PE at 73.87 and PB at 21.01 are unfavorable, suggesting high market expectations. The company pays dividends, but with a low yield of 0.65%, reflecting a cautious payout policy supported by solid free cash flow coverage.
GLOBALFOUNDRIES Inc.
GLOBALFOUNDRIES exhibits weak profitability ratios, including a negative net margin of -3.93%, ROE of -2.46%, and ROIC of -1.47%, signaling operational challenges. Despite a favorable PE due to negative earnings, other metrics like interest coverage at -0.44 and dividend yield at 0% highlight risks and absence of shareholder returns. The company retains earnings likely to support growth and R&D, as it does not currently pay dividends.
Which one has the best ratios?
Broadcom’s ratios are generally more favorable, especially in profitability and liquidity, despite high valuation multiples. GLOBALFOUNDRIES shows significant weaknesses in profitability and interest coverage, with no dividend returns. Overall, Broadcom’s financial position appears more robust, while GLOBALFOUNDRIES faces operational and financial headwinds reflected in its ratios.
Strategic Positioning
This section compares the strategic positioning of Broadcom Inc. and GLOBALFOUNDRIES Inc., focusing on Market position, Key segments, and Exposure to technological disruption:
Broadcom Inc.
- Large market cap of 1.6T USD with diversified segments; faces competitive pressure from various tech sectors.
- Key segments include Infrastructure Software and Semiconductor Solutions, driving revenue growth.
- Exposure includes semiconductor innovation and infrastructure software, requiring ongoing R&D investment.
GLOBALFOUNDRIES Inc.
- Smaller market cap of 23B USD, focused on semiconductor foundry; faces competitive foundry market pressure.
- Key segments are wafer fabrication and engineering services, focused on integrated circuit manufacturing.
- Exposure limited to semiconductor fabrication technologies, with risks from foundry technology advances.
Broadcom Inc. vs GLOBALFOUNDRIES Inc. Positioning
Broadcom’s diversified business model across software and semiconductors contrasts with GLOBALFOUNDRIES’ concentrated semiconductor foundry focus. Broadcom benefits from multiple revenue streams, while GLOBALFOUNDRIES relies heavily on wafer fabrication services.
Which has the best competitive advantage?
Broadcom shows a very favorable moat with ROIC exceeding WACC by over 7%, indicating durable competitive advantage, whereas GLOBALFOUNDRIES has a slightly unfavorable moat, shedding value despite improving profitability.
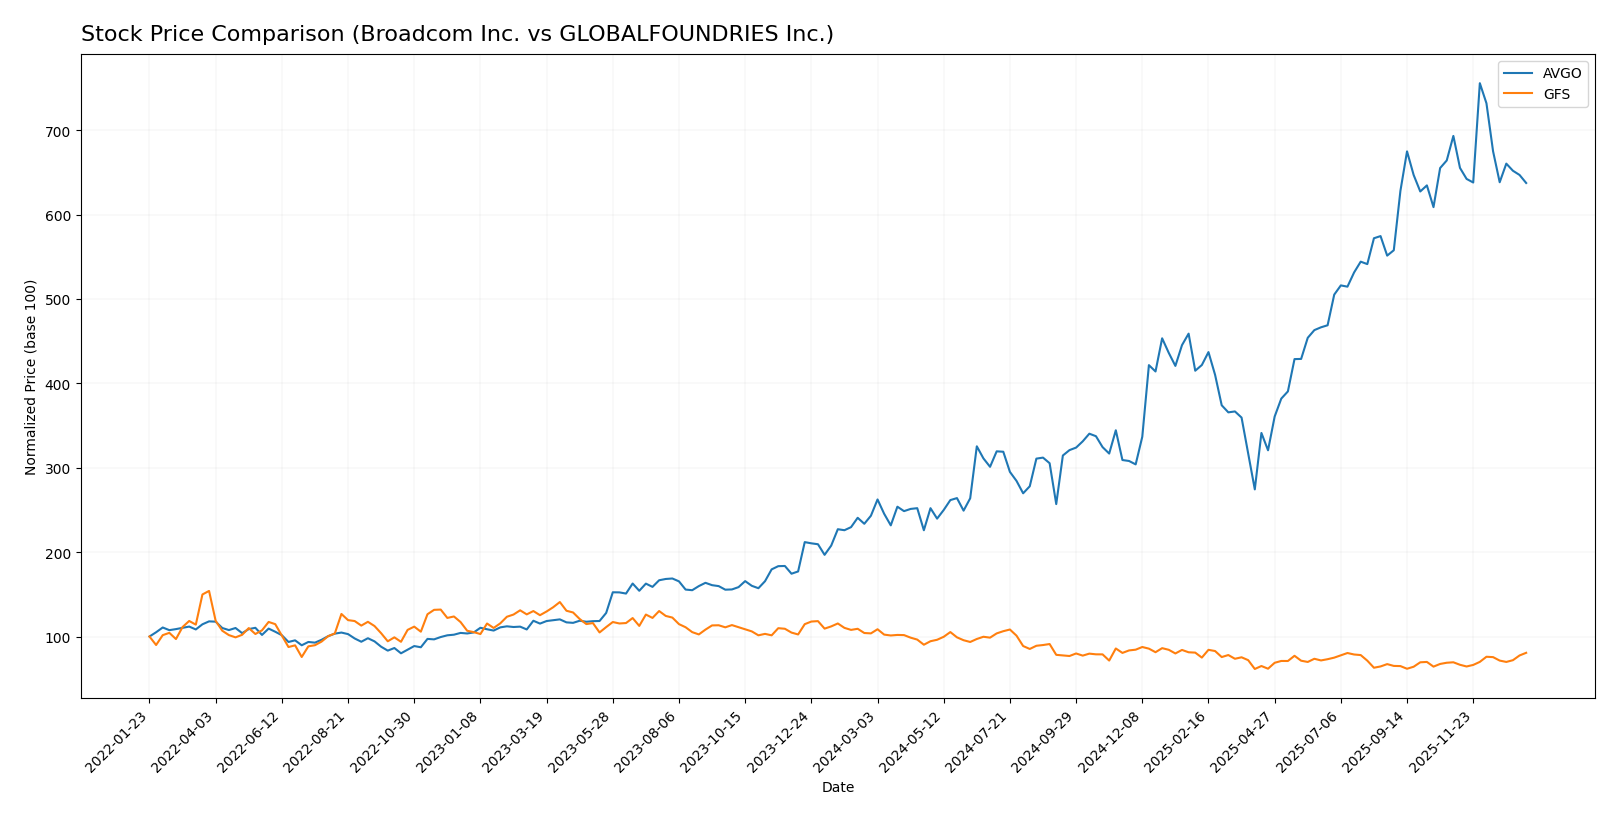
Stock Comparison
The stock price movements over the past 12 months reveal contrasting dynamics between Broadcom Inc. and GLOBALFOUNDRIES Inc., with Broadcom showing strong overall gains despite recent dips, while GLOBALFOUNDRIES experienced prolonged declines followed by a recent uptick.
Trend Analysis
Broadcom Inc. exhibited a bullish trend over the past year with a 162.18% price increase, though momentum has decelerated recently, including an 8.05% price drop from November 2025 to January 2026. Volatility remains high with a standard deviation of 78.56.
GLOBALFOUNDRIES Inc. showed a bearish trend over the past year, declining 22.2%, but recent data indicates an accelerating recovery with a 16.15% price rise in the last quarter. The stock’s volatility is lower, with a standard deviation of 6.45.
Comparing the two, Broadcom delivered the highest market performance over the year despite recent softness, while GLOBALFOUNDRIES’ recent positive shift contrasts its overall decline.
Target Prices
Here is the consensus target price overview from verified analysts for selected semiconductor companies:
| Company | Target High | Target Low | Consensus |
|---|---|---|---|
| Broadcom Inc. | 510 | 370 | 454.8 |
| GLOBALFOUNDRIES Inc. | 40 | 37 | 38.5 |
Analysts expect Broadcom’s stock to appreciate significantly from the current price of 339.89 USD, while GLOBALFOUNDRIES’ consensus target suggests a modest downside compared to its current price of 41.35 USD.
Analyst Opinions Comparison
This section compares analysts’ ratings and grades for Broadcom Inc. and GLOBALFOUNDRIES Inc.:
Rating Comparison
Broadcom Inc. Rating
- Rating: B, assessed as Very Favorable
- Discounted Cash Flow Score: 3, rated Moderate
- ROE Score: 5, rated Very Favorable
- ROA Score: 5, rated Very Favorable
- Debt To Equity Score: 1, rated Very Unfavorable
- Overall Score: 3, rated Moderate
GLOBALFOUNDRIES Inc. Rating
- Rating: C+, assessed as Very Favorable
- Discounted Cash Flow Score: 3, rated Moderate
- ROE Score: 1, rated Very Unfavorable
- ROA Score: 1, rated Very Unfavorable
- Debt To Equity Score: 3, rated Moderate
- Overall Score: 2, rated Moderate
Which one is the best rated?
Broadcom Inc. holds a superior rating with a “B” grade and higher scores in ROE and ROA, indicating better profitability and asset use efficiency. GLOBALFOUNDRIES Inc. scores lower overall, with weaker returns and moderate debt management.
Scores Comparison
Here is a comparison of the Altman Z-Score and Piotroski Score between the two companies:
Broadcom Inc. Scores
- Altman Z-Score: 12.13, indicating a safe zone.
- Piotroski Score: 8, categorized as very strong.
GLOBALFOUNDRIES Inc. Scores
- Altman Z-Score: 2.61, placing the company in grey zone.
- Piotroski Score: 6, considered average.
Which company has the best scores?
Broadcom Inc. shows stronger financial health with a high Altman Z-Score in the safe zone and a very strong Piotroski Score. GLOBALFOUNDRIES Inc. scores lower, with a moderate Altman Z-Score and an average Piotroski Score.
Grades Comparison
Here is a comparison of recent grades assigned to Broadcom Inc. and GLOBALFOUNDRIES Inc.:
Broadcom Inc. Grades
The following table summarizes recent stock grades from reputable grading companies for Broadcom Inc.:
| Grading Company | Action | New Grade | Date |
|---|---|---|---|
| Mizuho | Maintain | Outperform | 2026-01-09 |
| Truist Securities | Maintain | Buy | 2025-12-19 |
| UBS | Maintain | Buy | 2025-12-15 |
| Benchmark | Maintain | Buy | 2025-12-12 |
| Rosenblatt | Maintain | Buy | 2025-12-12 |
| Piper Sandler | Maintain | Overweight | 2025-12-12 |
| TD Cowen | Maintain | Buy | 2025-12-12 |
| B of A Securities | Maintain | Buy | 2025-12-12 |
| JP Morgan | Maintain | Overweight | 2025-12-12 |
| Mizuho | Maintain | Outperform | 2025-12-12 |
Overall, Broadcom Inc. has consistently received buy and outperform grades with no downgrades.
GLOBALFOUNDRIES Inc. Grades
Recent stock grades from recognized grading companies for GLOBALFOUNDRIES Inc. are as follows:
| Grading Company | Action | New Grade | Date |
|---|---|---|---|
| Wedbush | Downgrade | Neutral | 2025-12-31 |
| B of A Securities | Maintain | Underperform | 2025-12-04 |
| Evercore ISI Group | Maintain | Outperform | 2025-11-13 |
| JP Morgan | Maintain | Neutral | 2025-11-13 |
| Citigroup | Maintain | Neutral | 2025-11-13 |
| Wedbush | Maintain | Outperform | 2025-11-13 |
| B of A Securities | Downgrade | Underperform | 2025-10-13 |
| Deutsche Bank | Maintain | Buy | 2025-08-06 |
| Morgan Stanley | Maintain | Equal Weight | 2025-08-06 |
| Wedbush | Maintain | Outperform | 2025-08-06 |
GLOBALFOUNDRIES has mixed grades, including several neutral and underperform ratings with recent downgrades.
Which company has the best grades?
Broadcom Inc. has received consistently positive grades, mostly buy and outperform, indicating stronger analyst confidence compared to GLOBALFOUNDRIES Inc., which shows a more varied and cautious outlook. This disparity could influence investor sentiment and portfolio weighting decisions.
Strengths and Weaknesses
Below is a comparative overview of Broadcom Inc. (AVGO) and GLOBALFOUNDRIES Inc. (GFS) based on key investment criteria.
| Criterion | Broadcom Inc. (AVGO) | GLOBALFOUNDRIES Inc. (GFS) |
|---|---|---|
| Diversification | Strong diversification with Infrastructure Software (27B) and Semiconductor Solutions (36.9B) segments. | Focused mainly on Water Fabrication (6.1B) and Engineering Services (0.65B), less diversified. |
| Profitability | High profitability: Net margin 36.2%, ROE 28.45%, ROIC 16.36%, indicating value creation. | Negative profitability: Net margin -3.93%, ROE -2.46%, ROIC -1.47%, indicating value erosion. |
| Innovation | Very favorable economic moat with growing ROIC (+34.4%) showing durable competitive advantage. | Slightly unfavorable moat but improving profitability with ROIC growth (+90.2%), still value destructive. |
| Global presence | Global reach with strong market demand for semiconductor and software solutions. | Global foundry services but less dominant market position and lower scale. |
| Market Share | Significant market share in semiconductor solutions and infrastructure software sectors. | Smaller market share focused on foundry and fabrication services. |
Key takeaways: Broadcom demonstrates strong diversification, high profitability, and a durable competitive advantage, making it a more reliable value creator. GLOBALFOUNDRIES is currently less profitable and value-destructive but shows signs of improving operational efficiency and ROIC growth.
Risk Analysis
Below is a comparative overview of the key risks for Broadcom Inc. (AVGO) and GLOBALFOUNDRIES Inc. (GFS) based on the most recent data available.
| Metric | Broadcom Inc. (AVGO) | GLOBALFOUNDRIES Inc. (GFS) |
|---|---|---|
| Market Risk | Beta 1.22, moderate volatility due to tech sector cyclicality | Beta 1.49, higher volatility reflecting smaller market cap and sector sensitivity |
| Debt level | Debt-to-equity 0.8, moderate debt with strong interest coverage (8.08x) | Debt-to-equity 0.22, low leverage but negative interest coverage (-0.44) indicating risk |
| Regulatory Risk | Moderate, exposed to global trade policies and tech export controls | Moderate to high, semiconductor foundry exposed to export regulations and geopolitical scrutiny |
| Operational Risk | Diversified segments reduce risk, but supply chain disruptions possible | Higher risk due to concentrated manufacturing operations and capital intensity |
| Environmental Risk | Moderate, manufacturing footprint includes energy-intensive sectors | Moderate, with focus on wafer fabs that require significant resource use and waste management |
| Geopolitical Risk | Exposure to US-China trade tensions impacting supply chains | Significant, given global customer base and manufacturing locations sensitive to geopolitical shifts |
The most impactful risks are market volatility and geopolitical tensions, especially for GLOBALFOUNDRIES, which faces higher operational and regulatory challenges. Broadcom’s solid debt management and diversified business segments moderate its risk profile despite market cyclicality. Investors should monitor trade policies and supply chain stability closely for both companies.
Which Stock to Choose?
Broadcom Inc. (AVGO) has shown a strong income evolution with a 23.87% revenue growth in the last year and a 132.74% increase over five years. Its financial ratios are slightly favorable, with a robust net margin of 36.2%, ROE of 28.45%, and ROIC of 16.36%. Debt levels are moderate with a net debt to EBITDA of 1.41. Its rating is very favorable, supported by a strong economic moat and high Altman Z-Score.
GLOBALFOUNDRIES Inc. (GFS) presents an unfavorable income evolution, with recent declines in revenue and profitability, including a -3.93% net margin and negative ROE and ROIC. Financial ratios are mostly unfavorable, despite low debt at 0.22 debt-to-equity. The company’s rating is very favorable overall but with mixed scores, and its economic moat is slightly unfavorable due to value destruction despite improving ROIC.
Investors focused on growth and durable profitability might find AVGO’s strong income growth, favorable financial ratios, and very favorable moat more appealing, while those with a tolerance for volatility or seeking potential turnaround opportunities could view GFS’s improving profitability and lower debt as relevant factors. The choice could depend on risk tolerance and investment strategy.
Disclaimer: Investment carries a risk of loss of initial capital. The past performance is not a reliable indicator of future results. Be sure to understand risks before making an investment decision.
Go Further
I encourage you to read the complete analyses of Broadcom Inc. and GLOBALFOUNDRIES Inc. to enhance your investment decisions: