In the dynamic semiconductor industry, Broadcom Inc. and CEVA, Inc. stand out as key players with distinct business models and innovation strategies. Broadcom, a global technology giant, delivers a broad range of semiconductor and infrastructure software solutions. In contrast, CEVA focuses on licensing advanced wireless connectivity and AI processors to OEMs worldwide. This article will help you decide which company offers the most compelling investment opportunity in 2026.

Table of contents
Companies Overview
I will begin the comparison between Broadcom Inc. and CEVA, Inc. by providing an overview of these two companies and their main differences.
Broadcom Inc. Overview
Broadcom Inc. is a global technology company specializing in semiconductor and infrastructure software solutions. Headquartered in Palo Alto, California, it operates through four segments: Wired Infrastructure, Wireless Communications, Enterprise Storage, and Industrial & Other. Broadcom’s diverse product portfolio serves various markets including data centers, telecommunications, smartphones, and industrial automation, employing around 37,000 people worldwide.
CEVA, Inc. Overview
CEVA, Inc. is a semiconductor licensor focused on wireless connectivity and smart sensing technologies. Based in Rockville, Maryland, the company designs and licenses digital signal processors, AI processors, and wireless platforms for applications ranging from mobile and IoT to automotive and robotics. With approximately 406 employees, CEVA provides intellectual property and software tools to OEMs and semiconductor manufacturers globally.
Key similarities and differences
Both Broadcom and CEVA operate in the semiconductor industry, but their business models differ significantly. Broadcom manufactures and sells a wide range of physical semiconductor products and software solutions, while CEVA primarily licenses its intellectual property and platforms to other companies. Broadcom’s scale and workforce are substantially larger, reflecting its broader product scope compared to CEVA’s focused licensing approach in connectivity and sensing technologies.
Income Statement Comparison
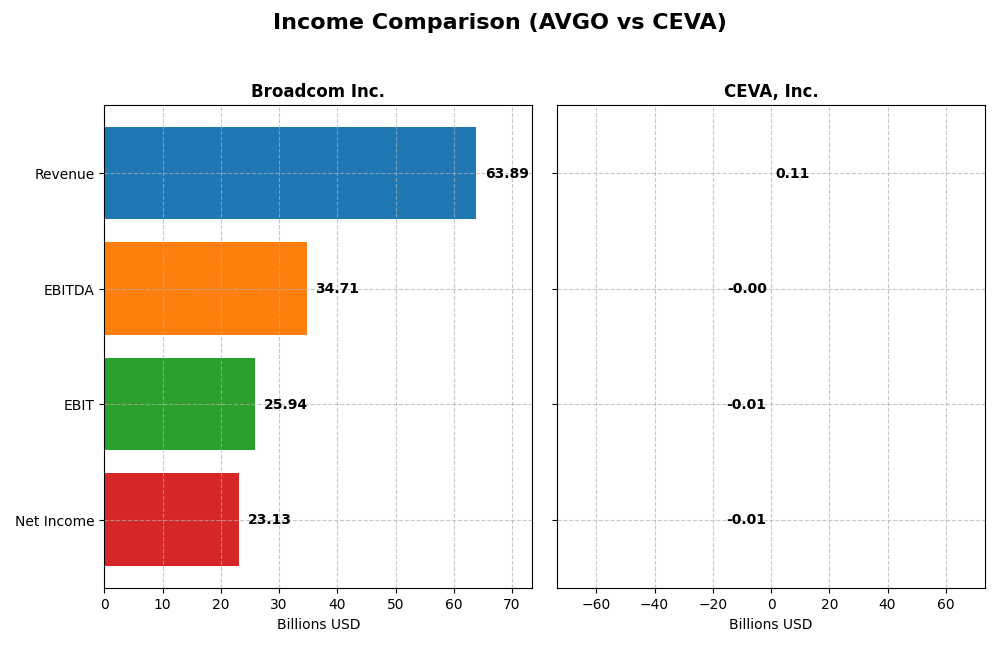
This table provides a side-by-side comparison of key income statement metrics for Broadcom Inc. and CEVA, Inc. for their most recent fiscal years, illustrating their scale and profitability.
| Metric | Broadcom Inc. (2025) | CEVA, Inc. (2024) |
|---|---|---|
| Market Cap | 1.6T | 544M |
| Revenue | 63.9B | 107M |
| EBITDA | 34.7B | -3.4M |
| EBIT | 25.9B | -7.5M |
| Net Income | 23.1B | -8.8M |
| EPS | 4.91 | -0.37 |
| Fiscal Year | 2025 | 2024 |
Income Statement Interpretations
Broadcom Inc.
Broadcom showed strong revenue growth from $27.45B in 2021 to $63.89B in 2025, with net income rising from $6.44B to $23.13B over the same period. Margins remained robust, with gross margin near 67.8% and net margin at 36.2% in 2025. The most recent year exhibited accelerated growth, with revenue up 23.9% and net margin improving significantly.
CEVA, Inc.
CEVA’s revenue increased modestly from $100M in 2020 to $107M in 2024, but net income remained negative, at -$8.79M in 2024 despite some improvement from -$11.88M in 2023. Gross margin was high at 88.1%, yet EBIT and net margins were negative, reflecting ongoing profitability challenges. The latest year showed positive revenue and margin growth but persistent net losses.
Which one has the stronger fundamentals?
Broadcom demonstrates stronger fundamentals with consistent high revenue and net income growth, favorable margins, and positive earnings per share trends. CEVA, while showing revenue growth and high gross margin, continues to struggle with negative EBIT and net margins, and substantial net losses over the period, indicating weaker profitability fundamentals.
Financial Ratios Comparison
The table below presents a side-by-side comparison of key financial ratios for Broadcom Inc. (AVGO) and CEVA, Inc. (CEVA) based on their most recent fiscal year data.
| Ratios | Broadcom Inc. (AVGO) FY 2025 | CEVA, Inc. (CEVA) FY 2024 |
|---|---|---|
| ROE | 28.45% | -3.30% |
| ROIC | 16.36% | -2.68% |
| P/E | 73.87 | -84.79 |
| P/B | 21.01 | 2.79 |
| Current Ratio | 1.71 | 7.09 |
| Quick Ratio | 1.58 | 7.09 |
| D/E (Debt-to-Equity) | 0.80 | 0.02 |
| Debt-to-Assets | 38.07% | 1.80% |
| Interest Coverage | 7.94 | 0 |
| Asset Turnover | 0.37 | 0.35 |
| Fixed Asset Turnover | 25.25 | 8.43 |
| Payout ratio | 48.18% | 0% |
| Dividend yield | 0.65% | 0% |
Interpretation of the Ratios
Broadcom Inc.
Broadcom shows a mix of strong and weak ratios, with favorable net margin (36.2%), ROE (28.45%), and ROIC (16.36%), indicating solid profitability and capital efficiency. However, high P/E (73.87) and P/B (21.01) ratios are unfavorable, suggesting a potentially expensive valuation. The company pays dividends with a modest 0.65% yield, supported by stable free cash flow, but the low yield may concern income-focused investors.
CEVA, Inc.
CEVA’s ratios reveal significant weaknesses, including negative net margin (-8.22%), ROE (-3.3%), and ROIC (-2.68%), reflecting operational challenges and losses. The firm’s favorable P/E is misleading due to negative earnings. CEVA does not pay dividends, likely due to its negative profitability and focus on R&D, with a very high current ratio (7.09) indicating strong liquidity but inefficient asset use. No dividend payouts are made as the company prioritizes reinvestment.
Which one has the best ratios?
Broadcom’s ratios are generally stronger, with solid profitability, returns, and liquidity, despite some valuation concerns. CEVA displays predominantly unfavorable ratios, marked by losses and operational inefficiencies. Therefore, Broadcom holds a clearly more favorable financial profile compared to CEVA based on the available ratio analysis.
Strategic Positioning
This section compares the strategic positioning of Broadcom Inc. and CEVA, Inc., focusing on market position, key segments, and exposure to technological disruption:
Broadcom Inc.
- Leading global technology company with strong presence in semiconductors and software; faces competitive pressure from diversified peers.
- Operates four main segments: Wired Infrastructure, Wireless Communications, Enterprise Storage, and Industrial & Other, driven by semiconductor solutions and infrastructure software.
- Moderate exposure through evolving semiconductor and software demands, with product portfolio including firmware and mechanical hardware interfacing sensors.
CEVA, Inc.
- Smaller licensor of wireless connectivity and sensing IP; niche market with competition from other IP licensors and semiconductor firms.
- Focuses on licensing wireless platforms, DSPs, AI processors, and software to OEMs across mobile, IoT, automotive, and industrial markets.
- High exposure due to reliance on licensing cutting-edge wireless and sensing technologies, adapting to rapid advances in AI and connectivity.
Broadcom Inc. vs CEVA, Inc. Positioning
Broadcom’s diversified portfolio spans semiconductors and infrastructure software, benefiting from scale and broad end-markets. CEVA concentrates on licensing wireless and AI technologies, relying on innovation in niche IP solutions but with limited scale.
Which has the best competitive advantage?
Broadcom shows a very favorable moat with growing ROIC and value creation, indicating durable competitive advantages. CEVA exhibits a very unfavorable moat with declining ROIC, signaling challenges in sustaining competitive profitability.
Stock Comparison
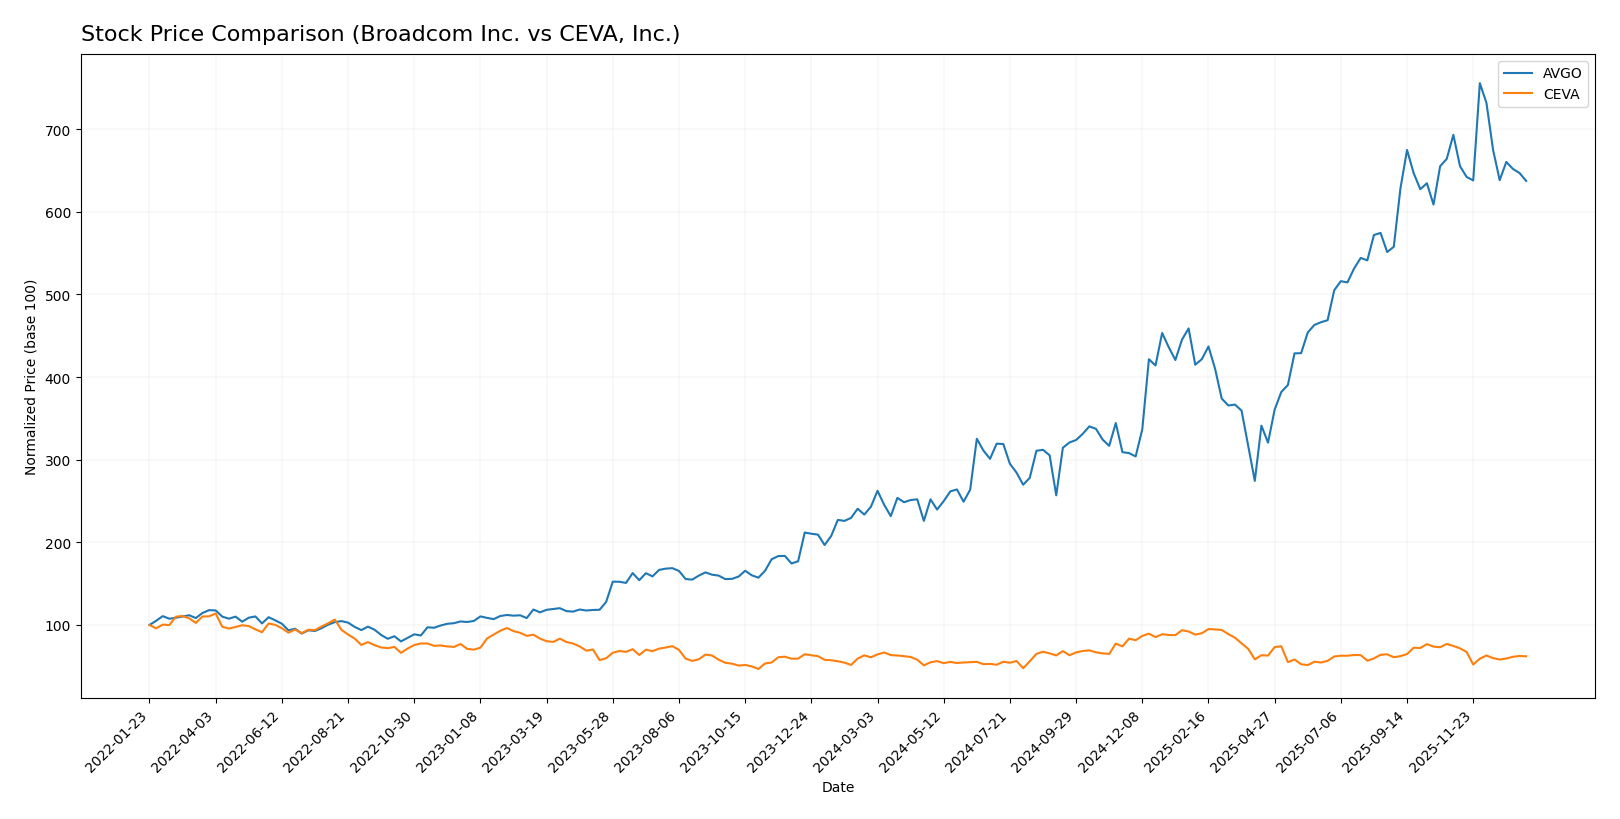
The stock prices of Broadcom Inc. and CEVA, Inc. over the past 12 months reveal distinct performance trajectories and trading dynamics, with Broadcom showing a strong overall rise despite recent weakness, while CEVA’s price remained nearly flat with a downward shift in recent weeks.
Trend Analysis
Broadcom Inc. (AVGO) exhibited a bullish trend over the past year with a 162.18% price increase, though the trend shows deceleration. Recent weeks reflect a bearish correction with an 8.05% decline and decreased volatility.
CEVA, Inc. (CEVA) experienced a neutral overall trend, gaining only 1.98% in price, indicating stagnation with decelerating momentum. Its recent trend is bearish, dropping 16.8% with relatively low volatility.
Comparing the two, Broadcom delivered the highest market performance with a significant positive return, while CEVA’s price remained essentially flat, underperforming Broadcom over the analyzed period.
Target Prices
The target price consensus for Broadcom Inc. and CEVA, Inc. shows varied analyst expectations.
| Company | Target High | Target Low | Consensus |
|---|---|---|---|
| Broadcom Inc. | 510 | 370 | 454.8 |
| CEVA, Inc. | 28 | 28 | 28 |
Analysts expect Broadcom’s stock to appreciate significantly above the current price of $339.89, with a consensus target near $455. CEVA’s target price of $28 suggests moderate upside from its current $22.64.
Analyst Opinions Comparison
This section compares the analysts’ ratings and grades for Broadcom Inc. and CEVA, Inc.:
Rating Comparison
Broadcom Inc. Rating
- Rating: B, classified as Very Favorable.
- Discounted Cash Flow Score: 3, indicating a Moderate valuation.
- ROE Score: 5, a Very Favorable indicator of profit efficiency.
- ROA Score: 5, showing Very Favorable asset utilization.
- Debt To Equity Score: 1, showing Very Unfavorable financial risk.
- Overall Score: 3, considered Moderate overall standing.
CEVA, Inc. Rating
- Rating: C+, classified as Very Favorable.
- Discounted Cash Flow Score: 3, indicating a Moderate valuation.
- ROE Score: 1, a Very Unfavorable measure of profitability.
- ROA Score: 1, reflecting Very Unfavorable asset use.
- Debt To Equity Score: 4, indicating Favorable debt management.
- Overall Score: 2, considered Moderate overall standing.
Which one is the best rated?
Broadcom Inc. holds a higher rating (B) and outperforms CEVA in profitability metrics such as ROE and ROA, despite a weaker debt-to-equity score. CEVA’s rating is lower (C+) with stronger debt management but weaker profitability scores.
Scores Comparison
Here is a comparison of the Altman Z-Score and Piotroski Score for Broadcom Inc. and CEVA, Inc.:
Broadcom Inc. Scores
- Altman Z-Score: 12.13, indicating a safe zone with very low bankruptcy risk.
- Piotroski Score: 8, classified as very strong financial health.
CEVA, Inc. Scores
- Altman Z-Score: 9.99, also in the safe zone, showing low bankruptcy risk.
- Piotroski Score: 4, considered average financial strength.
Which company has the best scores?
Broadcom Inc. has the highest Altman Z-Score and a much stronger Piotroski Score compared to CEVA, Inc. This suggests Broadcom shows better financial stability and strength based solely on these scores.
Grades Comparison
Here is the summary of the latest available grades from reputable grading companies for both Broadcom Inc. and CEVA, Inc.:
Broadcom Inc. Grades
The table below shows recent grades assigned to Broadcom Inc. by recognized financial institutions.
| Grading Company | Action | New Grade | Date |
|---|---|---|---|
| Mizuho | Maintain | Outperform | 2026-01-09 |
| Truist Securities | Maintain | Buy | 2025-12-19 |
| UBS | Maintain | Buy | 2025-12-15 |
| Benchmark | Maintain | Buy | 2025-12-12 |
| Rosenblatt | Maintain | Buy | 2025-12-12 |
| Piper Sandler | Maintain | Overweight | 2025-12-12 |
| TD Cowen | Maintain | Buy | 2025-12-12 |
| B of A Securities | Maintain | Buy | 2025-12-12 |
| JP Morgan | Maintain | Overweight | 2025-12-12 |
| Mizuho | Maintain | Outperform | 2025-12-12 |
Broadcom’s grades consistently reflect a positive outlook, with the majority of firms maintaining “Buy,” “Outperform,” or “Overweight” ratings over the last two months.
CEVA, Inc. Grades
Below is a table presenting the recent grades from established financial institutions for CEVA, Inc.
| Grading Company | Action | New Grade | Date |
|---|---|---|---|
| Barclays | Maintain | Overweight | 2025-11-12 |
| Rosenblatt | Maintain | Buy | 2025-11-11 |
| Rosenblatt | Maintain | Buy | 2025-08-14 |
| Oppenheimer | Maintain | Outperform | 2025-05-09 |
| Rosenblatt | Maintain | Buy | 2025-05-08 |
| Barclays | Maintain | Overweight | 2025-05-08 |
| Rosenblatt | Maintain | Buy | 2025-04-23 |
| Barclays | Maintain | Overweight | 2025-02-14 |
| Rosenblatt | Maintain | Buy | 2025-02-14 |
| Rosenblatt | Maintain | Buy | 2025-02-11 |
CEVA, Inc. has maintained a stable positive grade trend, predominantly receiving “Buy,” “Overweight,” and some “Outperform” ratings from credible sources.
Which company has the best grades?
Broadcom Inc. holds a stronger consensus with a higher number of recent “Buy” and “Outperform” ratings compared to CEVA, Inc., which mostly receives “Buy” and “Overweight” grades. For investors, this may indicate broader confidence from analysts in Broadcom’s near-term performance and market position.
Strengths and Weaknesses
Below is a comparative overview of key strengths and weaknesses for Broadcom Inc. (AVGO) and CEVA, Inc. (CEVA), based on their recent performance and financial metrics.
| Criterion | Broadcom Inc. (AVGO) | CEVA, Inc. (CEVA) |
|---|---|---|
| Diversification | Highly diversified with strong segments in Infrastructure Software ($27B) and Semiconductor Solutions ($37B) in 2025 | Less diversified, mainly focused on Licensing and Royalty revenue streams (~$107M in 2024) |
| Profitability | Strong profitability with net margin at 36.2% and ROIC of 16.36%, creating significant value | Negative profitability with net margin -8.22%, ROIC -2.68%, indicating value destruction |
| Innovation | High innovation supported by a durable competitive advantage and growing ROIC trend | Innovation challenges reflected by declining ROIC and unfavorable economic moat status |
| Global presence | Large global footprint with wide market reach in semiconductors and software | Smaller global presence, niche market focus limits scale and influence |
| Market Share | Leading market share in semiconductor solutions with robust revenue growth | Limited market share with modest revenue and slower growth dynamics |
In summary, Broadcom demonstrates strong diversification, profitability, and a durable competitive advantage, making it a solid value creator. CEVA, however, faces profitability challenges and a declining competitive position, requiring cautious consideration before investment.
Risk Analysis
Below is a comparative table highlighting key risks for Broadcom Inc. (AVGO) and CEVA, Inc. (CEVA) based on the most recent data available in 2026:
| Metric | Broadcom Inc. (AVGO) | CEVA, Inc. (CEVA) |
|---|---|---|
| Market Risk | Beta 1.22, moderate volatility | Beta 1.44, higher volatility |
| Debt level | Debt-to-Equity 0.8, moderate leverage | Debt-to-Equity 0.02, very low leverage |
| Regulatory Risk | Moderate, operates globally with compliance demands | Moderate, technology licensing in multiple sectors |
| Operational Risk | Large scale with 37K employees, complex supply chains | Smaller scale, 406 employees, reliance on licensing model |
| Environmental Risk | Exposure due to semiconductor manufacturing | Lower direct exposure, mainly IP licensing |
| Geopolitical Risk | High due to global supply chain and US-China tensions | Moderate, less direct manufacturing exposure |
Broadcom’s most impactful risks stem from its significant leverage and geopolitical exposure amid evolving global trade tensions, while CEVA faces higher market volatility and operational risks related to its smaller scale and dependency on technology licensing. Both companies remain in a safe financial zone but require vigilance on market shifts and regulatory changes.
Which Stock to Choose?
Broadcom Inc. (AVGO) shows a strong income evolution with significant revenue and net income growth over 2021-2025, supported by favorable profitability metrics and solid financial ratios. Its debt levels are moderate, and the overall rating is very favorable, reflecting efficient capital use and value creation.
CEVA, Inc. (CEVA) presents mixed income results with some revenue growth but persistent net income losses and negative profitability ratios. Financial ratios indicate challenges in operating efficiency, though debt levels remain low. The rating is very favorable but tempered by unfavorable returns and profitability.
For investors, AVGO might appear more attractive due to its very favorable rating, robust income growth, and strong financial ratios, suggesting a durable competitive advantage. CEVA could be seen as more suitable for those willing to tolerate higher risk, as its financials show value destruction but with potential for turnaround depending on investor risk appetite and strategy.
Disclaimer: Investment carries a risk of loss of initial capital. The past performance is not a reliable indicator of future results. Be sure to understand risks before making an investment decision.
Go Further
I encourage you to read the complete analyses of Broadcom Inc. and CEVA, Inc. to enhance your investment decisions: