Home > Comparison > Consumer Defensive > PM vs BTI
The strategic rivalry between Philip Morris International Inc. and British American Tobacco p.l.c. shapes the global tobacco landscape. Philip Morris, a US-based giant, advances a smoke-free future with a diverse portfolio, while British American Tobacco, a UK leader, emphasizes broad geographic reach and traditional plus modern nicotine products. This analysis pits innovation against scale to identify which trajectory offers superior risk-adjusted returns for a diversified portfolio in the Consumer Defensive sector.
Table of contents
Companies Overview
Philip Morris International and British American Tobacco stand as titans in the global tobacco market. Their strategies shape an evolving industry with shifting consumer preferences and regulatory pressures.
Philip Morris International: Pioneer of the Smoke-Free Future
Philip Morris International dominates the tobacco sector with a bold commitment to a smoke-free future. It generates revenue primarily through combustible cigarettes and a growing portfolio of smoke-free products like heat-not-burn and vapor. In 2026, the company’s strategic focus sharpens on expanding its smoke-free offerings across 71 global markets, aiming to lead in innovation beyond traditional tobacco sales.
British American Tobacco: Global Nicotine Innovator
British American Tobacco excels as a worldwide supplier of tobacco and nicotine products spanning vapour, heated tobacco, and traditional cigarettes. Its diversified brand portfolio includes Vuse, glo, and Camel, distributing across six continents. In 2026, BAT emphasizes modern oral nicotine and vapour products, intensifying its push into next-generation segments while maintaining strong combustible cigarette sales.
Strategic Collision: Similarities & Divergences
Both players pursue next-gen nicotine products but diverge in geographic emphasis and brand strategies. Philip Morris focuses on a smoke-free portfolio as its competitive edge, while BAT balances innovation with diverse traditional brands. Their primary battlefront is market share in heated tobacco and vaping. Investors face contrasting risk profiles: Philip Morris bets heavily on transformation, whereas BAT hedges with broad product diversity.
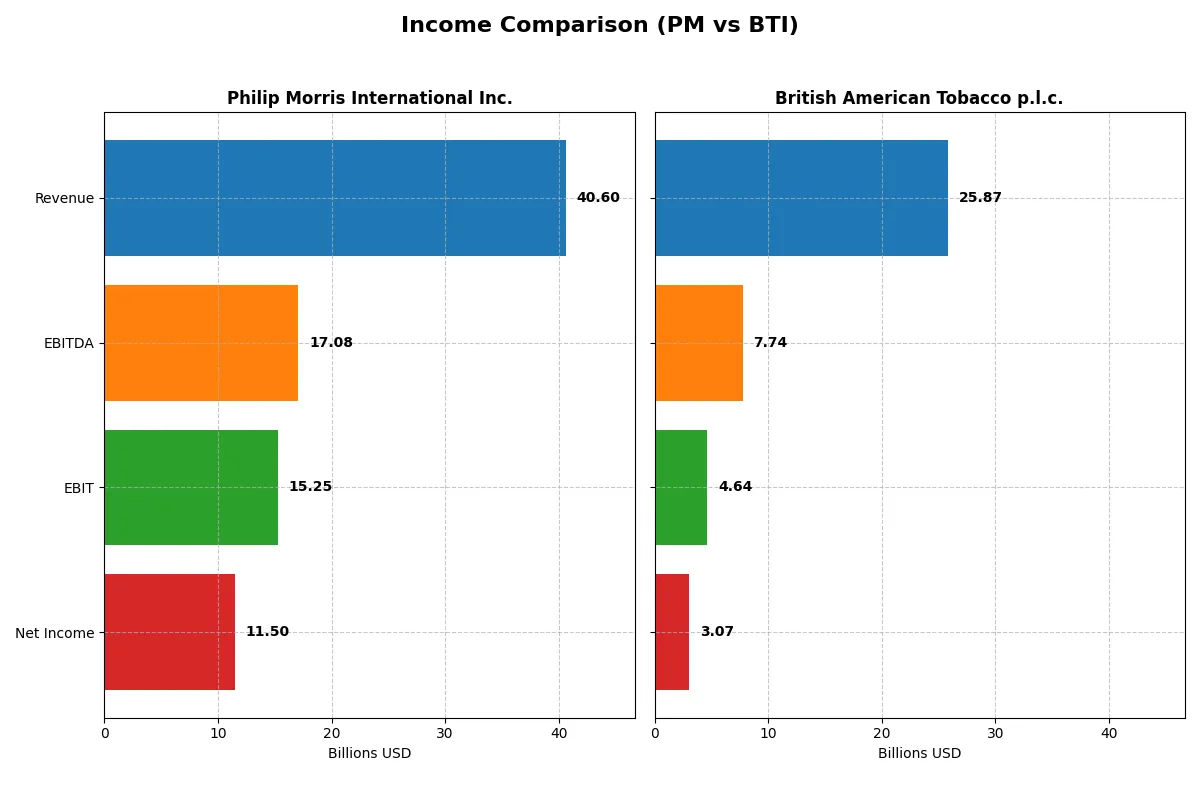
Income Statement Comparison
This data dissects the core profitability and scalability of both corporate engines to reveal who dominates the bottom line:
| Metric | Philip Morris International Inc. (PM) | British American Tobacco p.l.c. (BTI) |
|---|---|---|
| Revenue | 40.6B USD | 25.9B GBP |
| Cost of Revenue | 13.6B USD | 4.4B GBP |
| Operating Expenses | 11.8B USD | 18.6B GBP |
| Gross Profit | 27.0B USD | 21.4B GBP |
| EBITDA | 17.1B USD | 7.7B GBP |
| EBIT | 15.2B USD | 4.6B GBP |
| Interest Expense | 1.3B USD | 1.1B GBP |
| Net Income | 11.5B USD | 3.1B GBP |
| EPS | 7.51 USD | 1.37 GBP |
| Fiscal Year | 2025 | 2024 |
Income Statement Analysis: The Bottom-Line Duel
The income statement comparison reveals which company operates with greater efficiency and delivers stronger bottom-line results over recent years.
Philip Morris International Inc. Analysis
Philip Morris shows steady revenue growth from $31.4B in 2021 to $40.6B in 2025. Net income surged from $9.1B to $11.5B, reflecting expanding margins. Its 2025 net margin stands at a strong 28.3%, supported by a robust gross margin of 66.4%. Momentum accelerates with a 66% EPS growth in the latest year, signaling operational efficiency.
British American Tobacco p.l.c. Analysis
British American Tobacco’s revenue hovered around £25.7B-£27.7B between 2020-2024 but declined 5.2% in 2024 to £25.9B. Despite a high gross margin of 82.9%, net margin stayed modest at 11.9%. Net income fell sharply from £6.4B in 2020 to £3.1B in 2024. The recent year showed EPS rebound but overall trends signal weakening profitability and revenue contraction.
Margin Strength vs. Revenue Momentum
Philip Morris dominates in revenue growth and margin expansion, delivering consistent net income gains and impressive EPS momentum. British American Tobacco, despite a superior gross margin, suffers from declining revenue and net income over the period. For investors seeking stable earnings with improving profitability, Philip Morris offers a clearer fundamental advantage.
Financial Ratios Comparison
These vital ratios act as a diagnostic tool to expose the underlying fiscal health, valuation premiums, and capital efficiency of the companies compared below:
| Ratios | Philip Morris International Inc. (PM) | British American Tobacco p.l.c. (BTI) |
|---|---|---|
| ROE | -1.15 | 0.06 |
| ROIC | 0.28 | 0.02 |
| P/E | 21.0 | 20.9 |
| P/B | -24.1 | 1.29 |
| Current Ratio | 29 | 0.76 |
| Quick Ratio | 29 | 0.52 |
| D/E | -4.53 | 0.74 |
| Debt-to-Assets | 0.65 | 0.31 |
| Interest Coverage | 11.7 | 2.49 |
| Asset Turnover | 0.59 | 0.22 |
| Fixed Asset Turnover | 4.83 | 5.91 |
| Payout ratio | 0.74 | 1.70 |
| Dividend yield | 3.52% | 8.11% |
| Fiscal Year | 2025 | 2024 |
Efficiency & Valuation Duel: The Vital Signs
Ratios act as a company’s DNA, revealing hidden risks and operational excellence that influence investment decisions profoundly.
Philip Morris International Inc.
Philip Morris displays strong operational efficiency with a favorable 28.3% net margin and an impressive 28.0% ROIC, well above its 5.3% WACC. The stock trades at a neutral 21x P/E, reflecting fair valuation despite a deeply negative ROE. It supports shareholders with a 3.5% dividend yield, signaling steady income return amid reinvestment challenges.
British American Tobacco p.l.c.
British American Tobacco posts a lower 11.9% net margin and a modest 2.4% ROIC, underperforming versus Philip Morris and its WACC of 4.2%. The valuation aligns with a 21x P/E but comes with a higher 8.1% dividend yield, offsetting weaker profitability. However, multiple unfavorable ratios signal operational and leverage concerns.
Premium Valuation vs. Operational Safety
Philip Morris balances premium profitability and disciplined capital returns despite a negative ROE, offering a more favorable risk-reward profile. British American Tobacco’s higher dividend yield compensates for operational inefficiencies and financial leverage. Investors seeking operational strength may prefer Philip Morris, while income-focused profiles might lean toward British American Tobacco.
Which one offers the Superior Shareholder Reward?
Philip Morris International (PM) and British American Tobacco (BTI) take contrasting approaches to shareholder rewards. PM yields 3.5% with a high payout ratio near 74%, supported by robust free cash flow of 8.1/share, signaling sustainability. PM also executes substantial buybacks, enhancing total returns. BTI offers a higher dividend yield at 8.1%, but with a payout ratio exceeding 170%, raising red flags on dividend sustainability. BTI’s free cash flow per share is lower at 4.3, though its aggressive buyback program complements income returns. I view PM’s balanced dividend and buyback mix as a more sustainable model. In 2026, PM delivers a superior total shareholder return profile due to prudent capital allocation and reliable cash flows.
Comparative Score Analysis: The Strategic Profile
The radar chart reveals the fundamental DNA and trade-offs of Philip Morris International Inc. and British American Tobacco p.l.c., highlighting their strategic financial profiles:
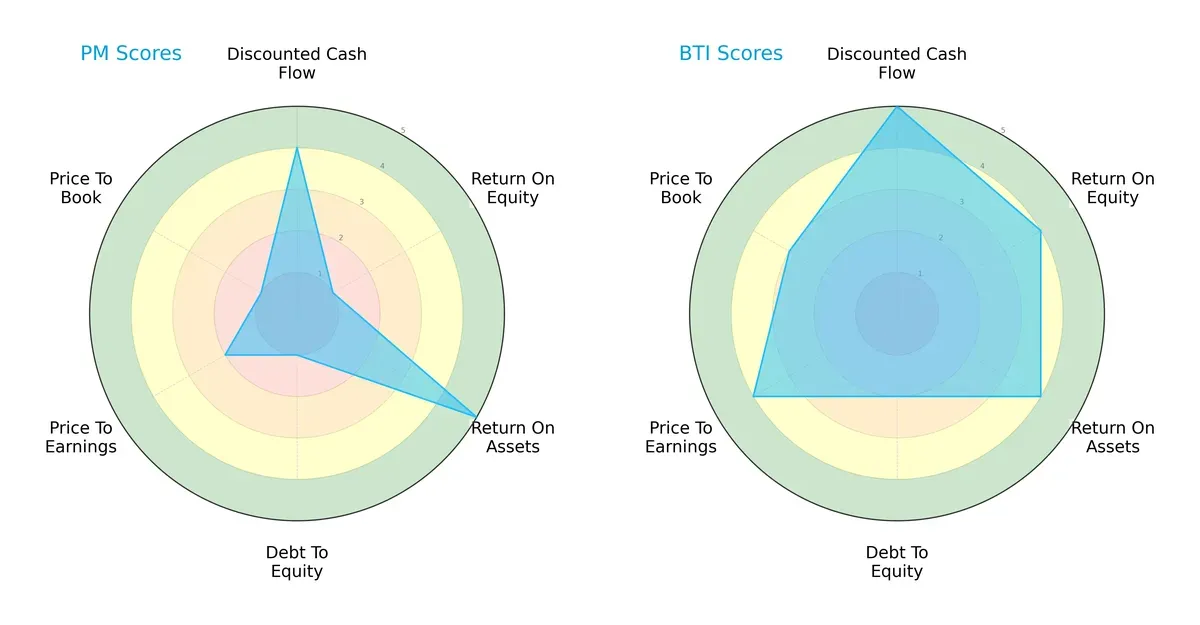
Philip Morris leans heavily on asset efficiency (ROA score 5) but struggles with equity returns (ROE score 1) and debt management (Debt/Equity score 1). British American Tobacco presents a more balanced, well-rounded profile, with strong DCF (5), ROE (4), and valuation metrics. BTI’s moderate leverage and valuation scores indicate prudent capital allocation, whereas PM shows vulnerability in financial stability and valuation.
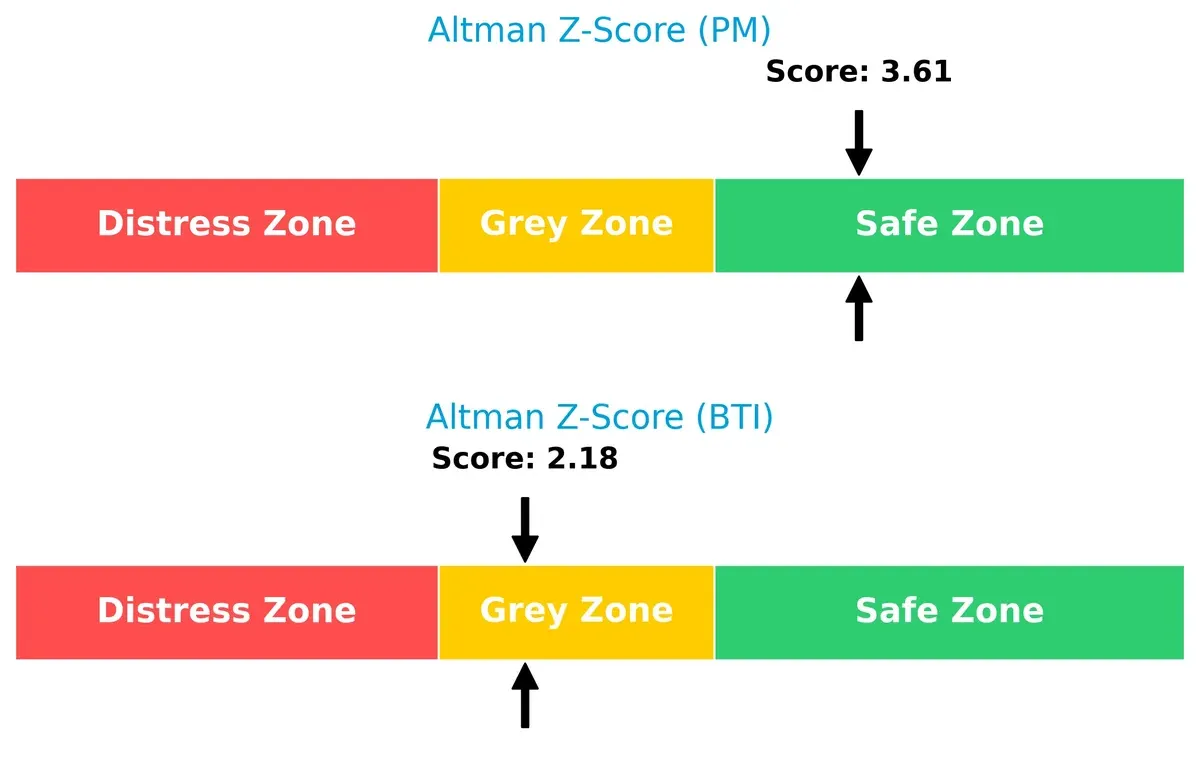
Bankruptcy Risk: Solvency Showdown
Philip Morris’s Altman Z-Score of 3.61 places it firmly in the safe zone, signaling robust solvency and low bankruptcy risk. British American Tobacco’s 2.18 falls in the grey zone, implying moderate financial distress risk in this cycle:
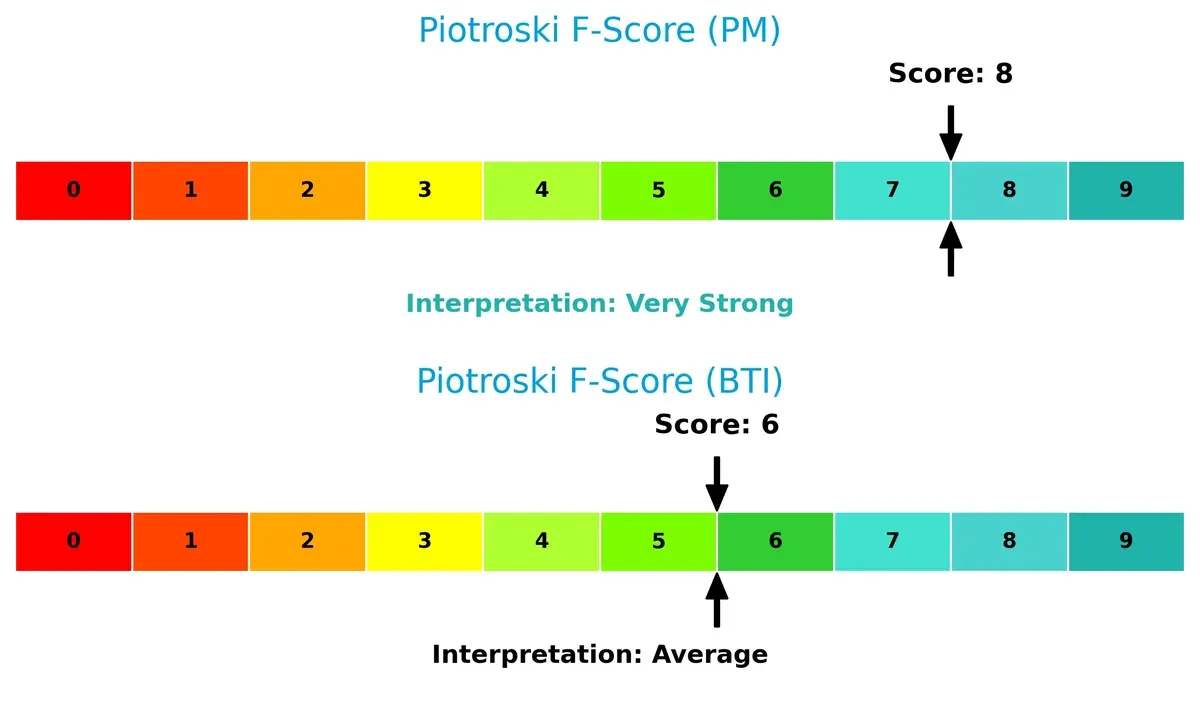
Financial Health: Quality of Operations
Philip Morris scores an 8 on the Piotroski F-Score, indicating very strong internal financial health and operational quality. British American Tobacco’s 6 reflects average strength but raises caution flags compared to PM’s superior score:
How are the two companies positioned?
This section dissects the operational DNA of Philip Morris and British American Tobacco by comparing their revenue distribution and internal strengths and weaknesses. The goal is to confront their economic moats to reveal which business model offers the most resilient, sustainable competitive advantage today.
Revenue Segmentation: The Strategic Mix
This visual comparison dissects how Philip Morris International and British American Tobacco diversify income streams and highlights their primary sector bets:
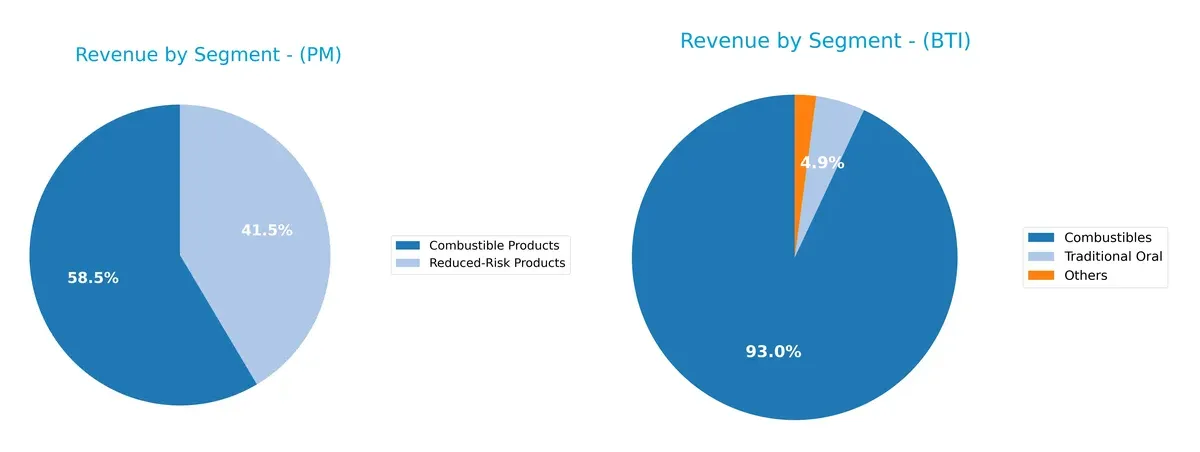
Philip Morris leans heavily on combustible products, generating $23.8B in 2025, but significantly grows its reduced-risk portfolio to $16.9B, showing strategic pivoting. British American Tobacco relies predominantly on combustibles with £23B in 2022, while its smaller oral and “others” segments under £1.3B reveal a narrower diversification. PM’s dual-segment approach reduces concentration risk, whereas BTI’s reliance on combustibles anchors its traditional market dominance but exposes it to regulatory shifts.
Strengths and Weaknesses Comparison
This table compares the strengths and weaknesses of Philip Morris International Inc. (PM) and British American Tobacco p.l.c. (BTI):
PM Strengths
- High net margin at 28.34%
- Favorable ROIC at 27.97% above WACC
- Strong quick ratio
- High interest coverage at 11.75
- Favorable fixed asset turnover
- Diversified geographic presence with key regions in Europe and Asia
BTI Strengths
- Favorable net margin at 11.86%
- Favorable WACC at 4.24%
- Favorable price-to-book ratio
- Favorable fixed asset turnover
- High dividend yield at 8.11%
- Stable foreign country revenue
PM Weaknesses
- Negative ROE at -115.11%
- Unfavorable current ratio of 29 (likely data anomaly)
- High debt to assets at 65.48%
- Negative price-to-book ratio
- Moderate asset turnover
- Heavy reliance on combustible products
BTI Weaknesses
- Low ROIC at 2.35% below WACC
- Unfavorable current and quick ratios
- Neutral to unfavorable debt metrics
- Low asset turnover at 0.22
- Lower interest coverage at 4.22
- Less diversified product segments
Philip Morris demonstrates strong profitability and capital efficiency, driven by favorable ROIC and margins, alongside a broad geographic reach. British American Tobacco shows solid net margin and dividend yield but faces challenges in capital returns and liquidity. Both companies have room to improve asset utilization and reduce financial risks.
The Moat Duel: Analyzing Competitive Defensibility
A structural moat is the only shield protecting long-term profits from relentless competition erosion. Let’s dissect the moats of two tobacco giants:
Philip Morris International Inc.: Innovation-Driven Switching Costs
Philip Morris leverages strong switching costs via its advanced smoke-free product portfolio. This fuels high ROIC near 23% and stable margins. New markets and product innovations in 2026 could deepen this advantage.
British American Tobacco p.l.c.: Legacy Brand Strength Under Pressure
British American Tobacco relies on brand recognition and scale but suffers declining ROIC below WACC and margin contraction. Its moat weakens amid revenue declines. Expansion into modern nicotine products offers potential but faces tough execution risks.
Innovation Moat vs. Brand Legacy: Who Holds the Line?
Philip Morris holds a wider, more sustainable moat, driven by superior capital efficiency and product innovation. British American Tobacco’s legacy brands struggle to defend market share amid profitability erosion. Philip Morris is better positioned to maintain competitive dominance.
Which stock offers better returns?
The past year shows strong bullish momentum for both stocks, with accelerating upward trends and notable price growth reflecting robust investor interest.
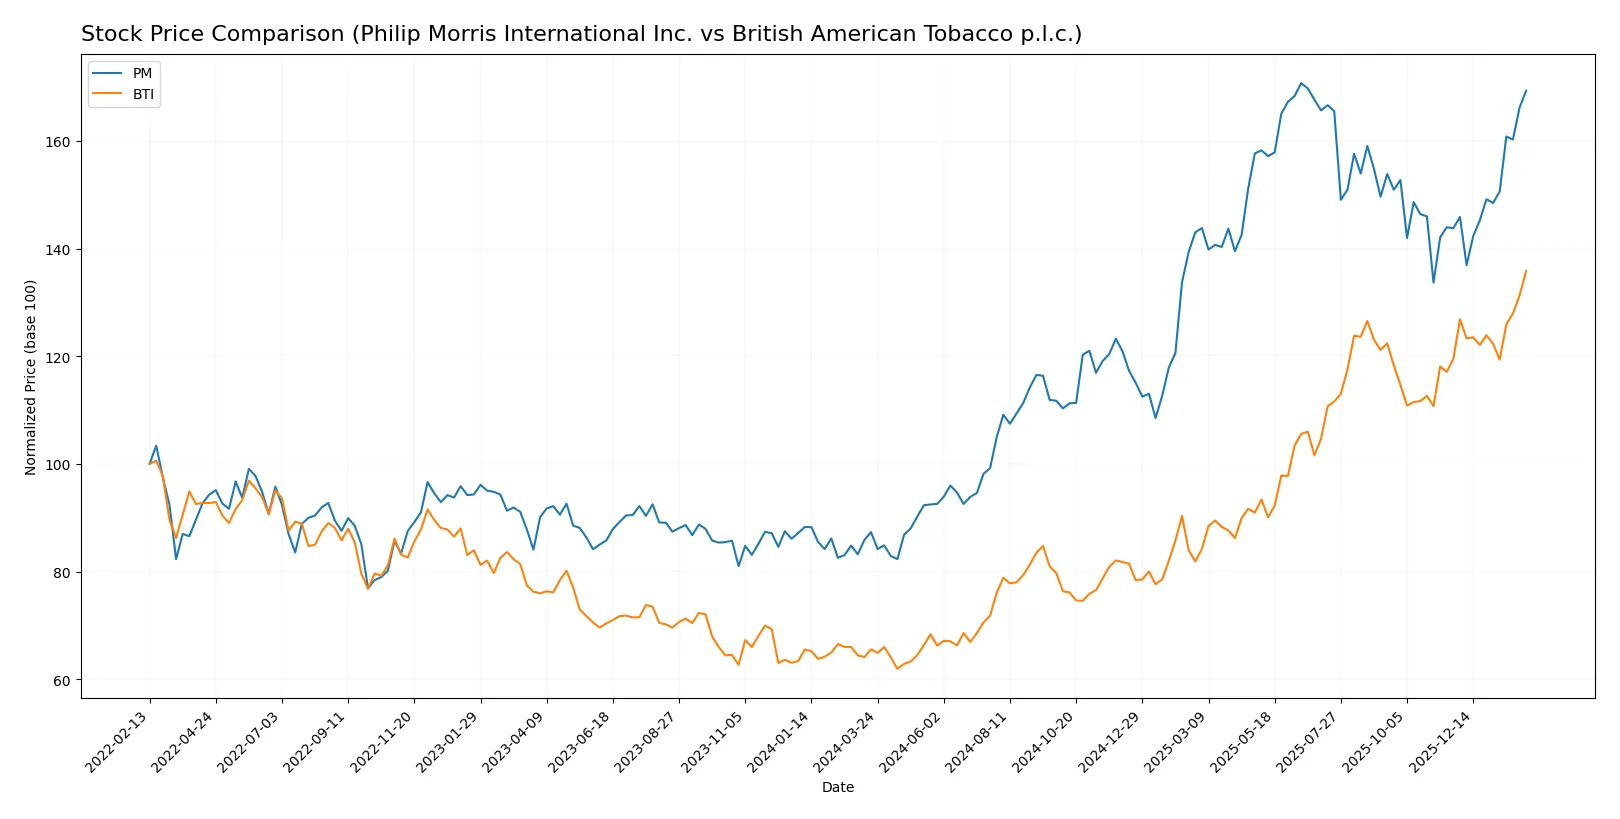
Trend Comparison
Philip Morris International Inc. (PM) exhibits a 93.92% price increase over 12 months with accelerating momentum. The stock ranged between 88.85 and 184.33, showing high volatility (28.13 std deviation).
British American Tobacco p.l.c. (BTI) outperformed PM with a 107.26% price rise over the same period. Its acceleration is evident, with lower volatility (9.71 std deviation) and a price range from 28.62 to 62.80.
BTI delivered stronger market performance, surpassing PM in gains and maintaining steadier price movement throughout the year.
Target Prices
Analysts present a mixed target consensus for Philip Morris International Inc. and British American Tobacco p.l.c.
| Company | Target Low | Target High | Consensus |
|---|---|---|---|
| Philip Morris International Inc. | 175 | 180 | 178.33 |
| British American Tobacco p.l.c. | 40 | 40 | 40 |
Philip Morris’s consensus target at 178.33 suggests a slight downside from the current 182.81 price. British American Tobacco’s consensus target at 40 is well below its current 62.8 price, indicating bearish analyst expectations.

Don’t Let Luck Decide Your Entry Point
Optimize your entry points with our advanced ProRealTime indicators. You’ll get efficient buy signals with precise price targets for maximum performance. Start outperforming now!
How do institutions grade them?
The following tables summarize recent institutional grades for each company:
Philip Morris International Inc. Grades
This table shows the latest grades and actions by reputable institutions for Philip Morris International Inc.:
| Grading Company | Action | New Grade | Date |
|---|---|---|---|
| Jefferies | Downgrade | Hold | 2026-01-20 |
| JP Morgan | Maintain | Overweight | 2025-11-26 |
| Barclays | Maintain | Overweight | 2025-11-17 |
| UBS | Maintain | Neutral | 2025-09-05 |
| Barclays | Maintain | Overweight | 2025-07-30 |
| Needham | Maintain | Buy | 2025-07-23 |
| UBS | Maintain | Neutral | 2025-07-14 |
| JP Morgan | Maintain | Overweight | 2025-07-10 |
| Barclays | Maintain | Overweight | 2025-07-10 |
| Citigroup | Maintain | Buy | 2025-07-10 |
British American Tobacco p.l.c. Grades
This table presents the recent institutional grade changes for British American Tobacco p.l.c.:
| Grading Company | Action | New Grade | Date |
|---|---|---|---|
| Argus Research | Upgrade | Buy | 2025-09-08 |
| UBS | Upgrade | Buy | 2025-01-27 |
Which company has the best grades?
British American Tobacco p.l.c. displays a stronger recent upgrade trend, with two upgrades to Buy in 2025. Philip Morris maintains mostly Overweight and Buy grades but saw a recent downgrade to Hold. Investors may view BAT’s upgrades as a bullish signal, while caution may be warranted given Philip Morris’s downgrade.
Risks specific to each company
The following categories identify the critical pressure points and systemic threats facing Philip Morris International Inc. and British American Tobacco p.l.c. in the 2026 market environment:
1. Market & Competition
Philip Morris International Inc.
- Faces intense competition while pivoting to smoke-free products in 71 markets.
British American Tobacco p.l.c.
- Competes globally with a broad portfolio, but slower innovation pace in nicotine alternatives.
2. Capital Structure & Debt
Philip Morris International Inc.
- High debt-to-assets ratio (65.5%) signals leverage risk despite strong interest coverage (11.75x).
British American Tobacco p.l.c.
- Moderate debt levels with debt-to-assets at 31.1%, but weaker interest coverage (4.22x) raises caution.
3. Stock Volatility
Philip Morris International Inc.
- Beta of 0.41 indicates moderate stock stability amid market fluctuations.
British American Tobacco p.l.c.
- Extremely low beta (0.06) suggests very stable stock with limited volatility exposure.
4. Regulatory & Legal
Philip Morris International Inc.
- Regulatory risks remain high in tobacco sectors, but diversification into smoke-free products mitigates some impact.
British American Tobacco p.l.c.
- Faces substantial regulatory scrutiny globally, particularly in Europe and the US, with slower product diversification.
5. Supply Chain & Operations
Philip Morris International Inc.
- Large global footprint requires robust supply chain management; operational efficiency is critical.
British American Tobacco p.l.c.
- Smaller workforce and global reach may reduce complexity but could limit scale economies.
6. ESG & Climate Transition
Philip Morris International Inc.
- Actively evolving portfolio toward smoke-free and less harmful products aligns with ESG trends.
British American Tobacco p.l.c.
- ESG progress slower; traditional tobacco products dominate, posing reputational and regulatory risks.
7. Geopolitical Exposure
Philip Morris International Inc.
- Exposure to diverse markets including Asia and emerging economies increases geopolitical risk.
British American Tobacco p.l.c.
- Global presence includes politically sensitive regions but less exposure to fast-growing markets.
Which company shows a better risk-adjusted profile?
Philip Morris International’s greatest risk lies in high leverage levels, threatening financial flexibility. British American Tobacco’s main risk is weaker profitability and operational efficiency. I see Philip Morris offering a better risk-adjusted profile, supported by superior Altman Z-score (3.6 safe zone) and a very strong Piotroski score (8) versus BTI’s grey zone Z-score (2.18) and average Piotroski (6). Despite leverage concerns, Philip Morris’s stronger financial health and innovation edge justify cautious preference.
Final Verdict: Which stock to choose?
Philip Morris International Inc. (PM) stands out for its superpower as a cash-generating machine, delivering consistently strong free cash flows and maintaining a robust economic moat despite a slight decline in profitability. Its high leverage and volatile return on equity warrant caution. PM suits portfolios targeting aggressive growth with a tolerance for financial complexity.
British American Tobacco p.l.c. (BTI) leverages a strategic moat rooted in its recurring revenue and strong brand presence, supported by a safer balance sheet relative to PM. While its profitability and capital returns lag, BTI offers a more stable income profile and better downside protection. It fits well with Growth at a Reasonable Price (GARP) investors seeking stability amid moderate growth.
If you prioritize high cash flow generation and are comfortable navigating financial leverage, PM is the compelling choice due to its value creation and growth momentum. However, if you seek steadier returns with a stronger safety cushion, BTI offers better stability despite its subdued profitability and declining ROIC. Each presents distinct risk-reward profiles aligned with different investor strategies.
Disclaimer: Investment carries a risk of loss of initial capital. The past performance is not a reliable indicator of future results. Be sure to understand risks before making an investment decision.
Go Further
I encourage you to read the complete analyses of Philip Morris International Inc. and British American Tobacco p.l.c. to enhance your investment decisions: