Home > Comparison > Healthcare > PFE vs BMY
The strategic rivalry between Pfizer Inc. and Bristol-Myers Squibb Company shapes the evolution of the healthcare sector. Pfizer operates as a diversified biopharmaceutical powerhouse with a broad portfolio spanning vaccines to biosimilars. In contrast, Bristol-Myers Squibb focuses on specialty biopharma with a stronghold in oncology and immunology. This analysis evaluates which company’s operational model and innovation pipeline present a superior risk-adjusted outlook for a well-diversified investment portfolio.

Table of contents
Companies Overview
Pfizer Inc. and Bristol-Myers Squibb Company dominate the global biopharmaceutical markets with robust portfolios and growth ambitions.
Pfizer Inc.: Global Biopharma Powerhouse
Pfizer leads as a diversified pharmaceutical giant, generating revenue from vaccines, biologics, and small molecules. Its strategic focus in 2026 centers on expanding its pipeline in immunotherapies and infectious disease treatments, leveraging partnerships and biosimilars to sustain growth across multiple therapeutic areas.
Bristol-Myers Squibb Company: Specialty Biopharma Innovator
Bristol-Myers Squibb excels as a specialty biopharmaceutical company with a strong foothold in oncology, hematology, and immunology. In 2026, it prioritizes advancing next-generation cancer therapies and immunomodulators, relying heavily on flagship drugs like Revlimid and Opdivo to drive revenue while expanding into novel cell and gene therapies.
Strategic Collision: Similarities & Divergences
Both companies pursue innovation in high-growth therapeutic segments but differ in scale and approach. Pfizer embraces a broad portfolio strategy with extensive product diversity. Bristol-Myers Squibb focuses on specialized, high-margin therapies. Their competitive battleground lies in oncology and immunology markets. Investors face distinct profiles: Pfizer offers stable diversification, while Bristol-Myers Squibb bets on concentrated innovation-driven growth.
Income Statement Comparison
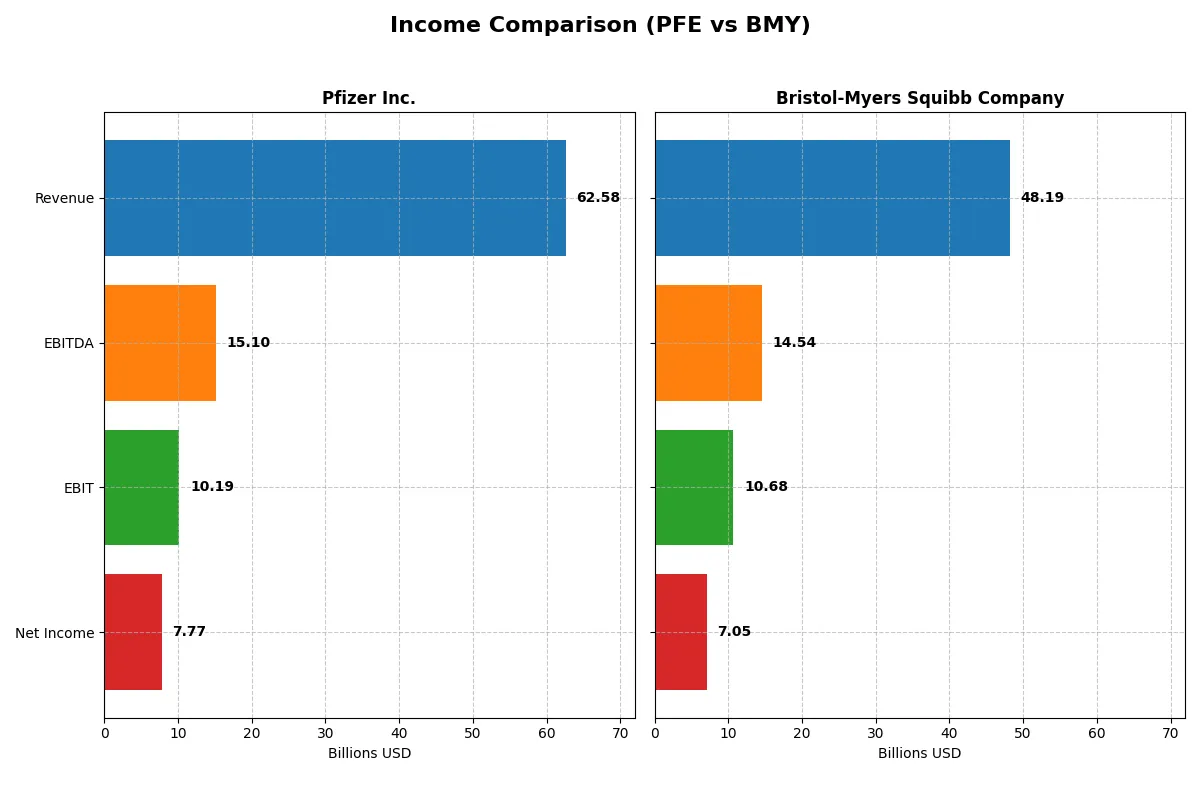
This data dissects the core profitability and scalability of both corporate engines to reveal who dominates the bottom line:
| Metric | Pfizer Inc. (PFE) | Bristol-Myers Squibb Company (BMY) |
|---|---|---|
| Revenue | 62.6B | 48.2B |
| Cost of Revenue | 18.6B | 15.6B |
| Operating Expenses | 28.6B | 19.9B |
| Gross Profit | 44.0B | 32.6B |
| EBITDA | 15.1B | 14.5B |
| EBIT | 10.2B | 10.7B |
| Interest Expense | 2.7B | 1.5B |
| Net Income | 7.7B | 7.1B |
| EPS | 1.36 | 3.46 |
| Fiscal Year | 2025 | 2025 |
Income Statement Analysis: The Bottom-Line Duel
This income statement comparison reveals which company delivers superior operational efficiency and profitability in today’s pharmaceutical landscape.
Pfizer Inc. Analysis
Pfizer’s revenue declined from 63.6B in 2024 to 62.6B in 2025, showing a slight contraction. Net income also fell from 8.0B to 7.7B, reflecting margin pressure. Despite this, Pfizer maintains a robust gross margin above 70%, signaling strong cost control. However, net margin dipped to 12.4%, indicating challenges in converting sales growth into profits.
Bristol-Myers Squibb Company Analysis
Bristol-Myers reported stable revenue near 48.2B for 2025, down marginally from 48.3B in 2024. Net income rebounded sharply to 7.1B from a significant loss the prior year. Its gross margin at 67.7% remains healthy while the net margin expanded to 14.6%. This reflects strong operational leverage and improving bottom-line momentum.
Margin Quality vs. Recovery Momentum
Bristol-Myers demonstrates superior margin expansion and a dramatic net income recovery compared to Pfizer’s declining profits and revenue. Pfizer’s higher gross margin is offset by shrinking net margins, signaling erosion in profitability. For investors, Bristol-Myers’ profile of steady margins combined with turnaround momentum offers a more compelling earnings trajectory.
Financial Ratios Comparison
These vital ratios act as a diagnostic tool to expose the underlying fiscal health, valuation premiums, and capital efficiency of the companies analyzed:
| Ratios | Pfizer Inc. (PFE) | Bristol-Myers Squibb Company (BMY) |
|---|---|---|
| ROE | 8.35% (2025) | N/A (2025) |
| ROIC | N/A | N/A |
| P/E | 18.21 (2025) | 15.55 (2025) |
| P/B | 1.52 (2025) | N/A (2025) |
| Current Ratio | 0 (2025 est.) | 0 (2025 est.) |
| Quick Ratio | 0 (2025 est.) | 0 (2025 est.) |
| D/E | 0 (2025 est.) | 0 (2025 est.) |
| Debt-to-Assets | 0 (2025 est.) | 0 (2025 est.) |
| Interest Coverage | 5.78 (2025) | 4.93 (2025) |
| Asset Turnover | 0 (2025 est.) | 0 (2025 est.) |
| Fixed Asset Turnover | 0 (2025 est.) | 0 (2025 est.) |
| Payout ratio | 126% (2025) | 71.5% (2025) |
| Dividend yield | 6.91% (2025) | 4.60% (2025) |
| Fiscal Year | 2025 | 2025 |
Efficiency & Valuation Duel: The Vital Signs
Financial ratios act as a company’s DNA, revealing hidden risks and operational excellence critical for investment decisions.
Pfizer Inc.
Pfizer displays moderate profitability with an 8.35% ROE and a solid 12.42% net margin, indicating operational efficiency. Its P/E ratio of 18.21 and P/B of 1.52 suggest a fairly valued stock. Pfizer supports shareholders through a 6.91% dividend yield, balancing income with ongoing R&D reinvestment at nearly 19% of revenue.
Bristol-Myers Squibb Company
Bristol-Myers Squibb posts a higher net margin of 14.64% but reports no ROE data, limiting profitability insight. Its P/E ratio of 15.55 is slightly more attractive, and a favorable P/B ratio signals undervaluation. The company returns value with a 4.6% dividend yield while investing heavily in R&D at about 20% of revenue to fuel growth.
Valuation and Profitability: Balanced Yield vs. Growth Intensity
Bristol-Myers Squibb offers a more favorable valuation and higher profitability margin, while Pfizer provides a stronger dividend yield and consistent reinvestment. Investors prioritizing income may lean toward Pfizer; those seeking growth and valuation appeal might find Bristol-Myers Squibb more fitting.
Which one offers the Superior Shareholder Reward?
I compare Pfizer and Bristol-Myers Squibb’s shareholder rewards by analyzing dividends, payout ratios, and buyback intensity. Pfizer yields 6.9% with a payout ratio above 120%, signaling aggressive returns but potential sustainability risks. Bristol-Myers yields 4.6%, with a more conservative payout around 71%, supporting steadier dividends. Pfizer’s buyback activity remains robust, enhancing total return, while BMY’s buybacks are less pronounced, focusing more on R&D and growth. I view Pfizer’s model as higher yield but riskier; Bristol-Myers offers a more balanced, sustainable return. For 2026, I favor Pfizer for total return seekers, but cautious investors may prefer Bristol-Myers’ stability.
Comparative Score Analysis: The Strategic Profile
The radar chart reveals the fundamental DNA and trade-offs of Pfizer Inc. and Bristol-Myers Squibb Company, highlighting their financial strengths and valuation nuances:
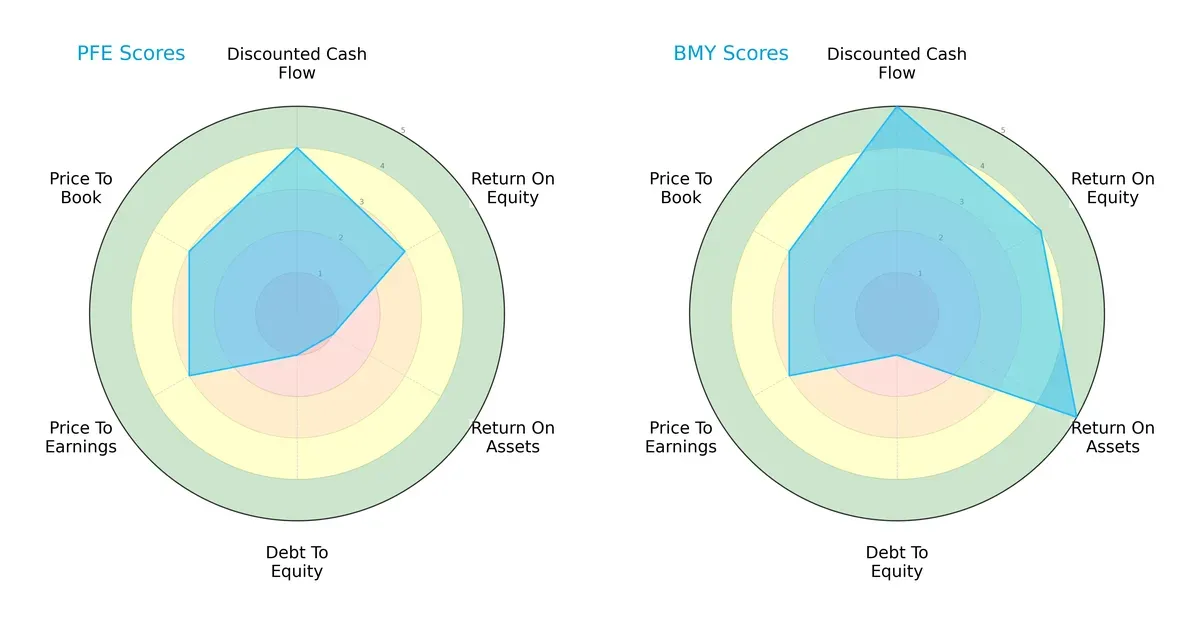
Bristol-Myers Squibb exhibits a more balanced and robust profile with top scores in discounted cash flow (5), return on equity (4), and return on assets (5). Pfizer relies on a moderate discounted cash flow (4) and return on equity (3) but lags considerably in asset efficiency (1) and debt management (1), signaling financial leverage risks. Both companies share moderate valuation scores, but Bristol-Myers leads with a stronger operational and cash flow foundation.
Financial Health: Quality of Operations
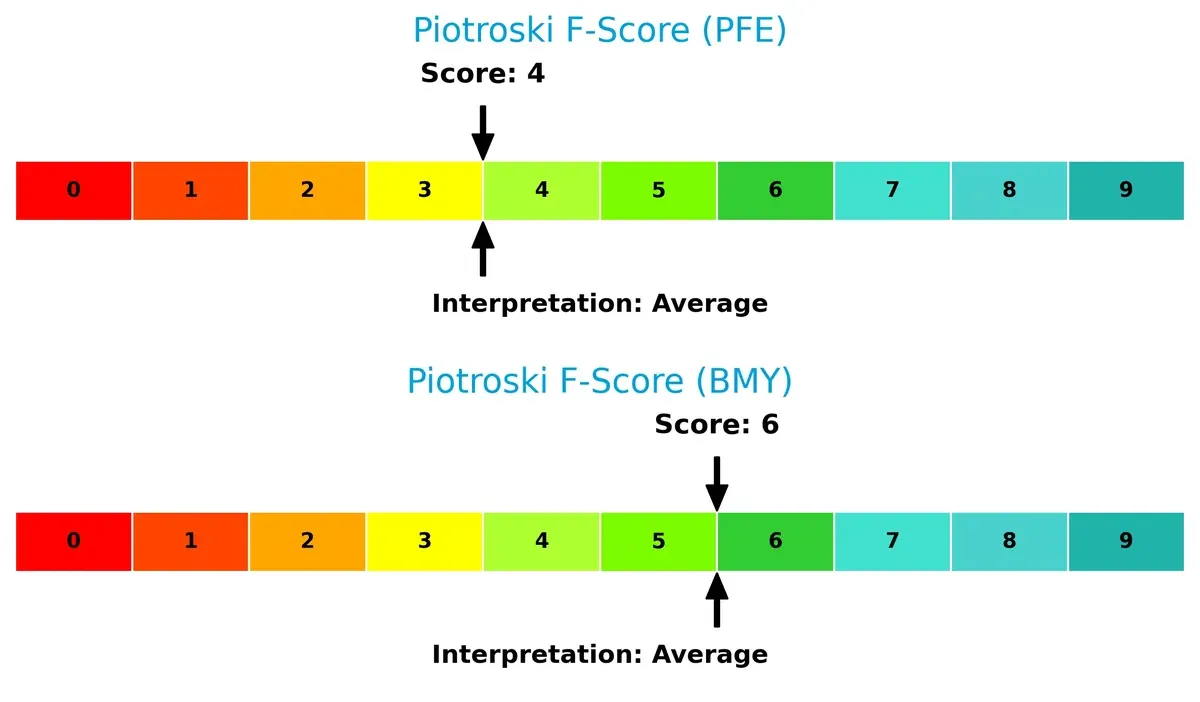
Bristol-Myers Squibb scores a 6 on the Piotroski F-Score, outperforming Pfizer’s 4, indicating better internal financial health and fewer red flags in profitability and liquidity metrics:
How are the two companies positioned?
This section dissects Pfizer and Bristol-Myers Squibb’s operational DNA by comparing their revenue distribution and internal strengths and weaknesses. The final goal is to confront their economic moats to identify which business model offers the most resilient and sustainable competitive advantage today.
Revenue Segmentation: The Strategic Mix
This visual comparison dissects how Pfizer Inc. and Bristol-Myers Squibb Company diversify their income streams and where their primary sector bets lie:
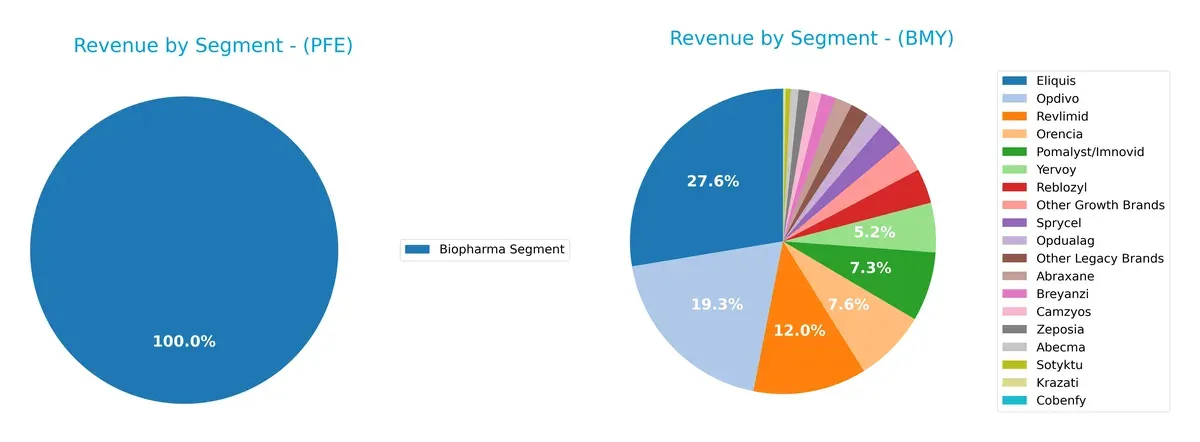
Pfizer anchors its revenue primarily in the Biopharma Segment, with $62.4B in 2024, showing a concentrated reliance. Bristol-Myers Squibb, by contrast, displays a more diversified portfolio with multiple brands like Eliquis ($13.3B), Opdivo ($9.3B), and Revlimid ($5.8B) each contributing significantly. Pfizer’s focus signals strength in biopharma innovation but raises concentration risk. BMY’s broad product mix supports ecosystem lock-in and reduces vulnerability to any single drug’s performance.
Strengths and Weaknesses Comparison
This table compares the strengths and weaknesses of Pfizer and Bristol-Myers Squibb based on diversification, profitability, financials, innovation, global presence, and market share:
Pfizer Strengths
- Large biopharma revenue of 62.4B in 2024
- Diversified product portfolio historically
- Significant US and developed markets presence with 54.7B in 2024
- Favorable net margin at 12.42%
- Low debt-to-assets ratio
- Neutral valuation multiples
Bristol-Myers Squibb Strengths
- Strong net margin at 14.64%
- Diverse oncology and immunology portfolio with multiple growth brands
- Higher interest coverage ratio at 7.08
- Favorable dividend yield at 4.6%
- Solid US market share with 34.1B revenue in 2024
- Consistent global presence including Europe and Rest of World
Pfizer Weaknesses
- Unfavorable ROE and ROIC indicating capital efficiency issues
- Zero current and quick ratios signal liquidity concerns
- Asset turnover ratios unfavorable
- Slightly unfavorable overall ratio evaluation
- Dividend yield neutral
- Moderate interest coverage at 3.82
Bristol-Myers Squibb Weaknesses
- Unfavorable ROE and ROIC showing challenges in capital returns
- Zero current and quick ratios indicate liquidity risks
- Lack of WACC data limits cost of capital assessment
- Lower diversification outside core products
- Neutral overall ratio evaluation
- Asset turnover ratios unfavorable
Pfizer demonstrates scale and market breadth but faces profitability and liquidity challenges. Bristol-Myers Squibb shows stronger margins and interest coverage yet shares similar capital efficiency and liquidity weaknesses. Both companies must address operational efficiency and balance sheet health to sustain competitive positioning.
The Moat Duel: Analyzing Competitive Defensibility
A structural moat stands as the only true shield protecting long-term profits from relentless competition erosion:
Pfizer Inc.: Intangible Assets and Scale Power
Pfizer’s moat stems from its vast portfolio of patented drugs and global scale, reflected in a historically strong 70% gross margin. Yet, declining ROIC signals weakening profitability, threatening its moat as biosimilars and generics rise in 2026.
Bristol-Myers Squibb Company: Focused Innovation and Portfolio Depth
Bristol-Myers leverages specialized oncology and immunology drugs, achieving superior EBIT margin (22%) and recent robust earnings growth. Its moat contrasts Pfizer’s scale with innovation-driven resilience, offering expansion potential in emerging therapies through 2026.
Patents and Scale vs. Innovation Focus: The Moat Face-off
Pfizer’s broad scale and intangible asset moat is under pressure from declining returns. Bristol-Myers’ innovation-centric moat, backed by margin strength and growth, appears deeper and better positioned to defend market share in 2026.
Which stock offers better returns?
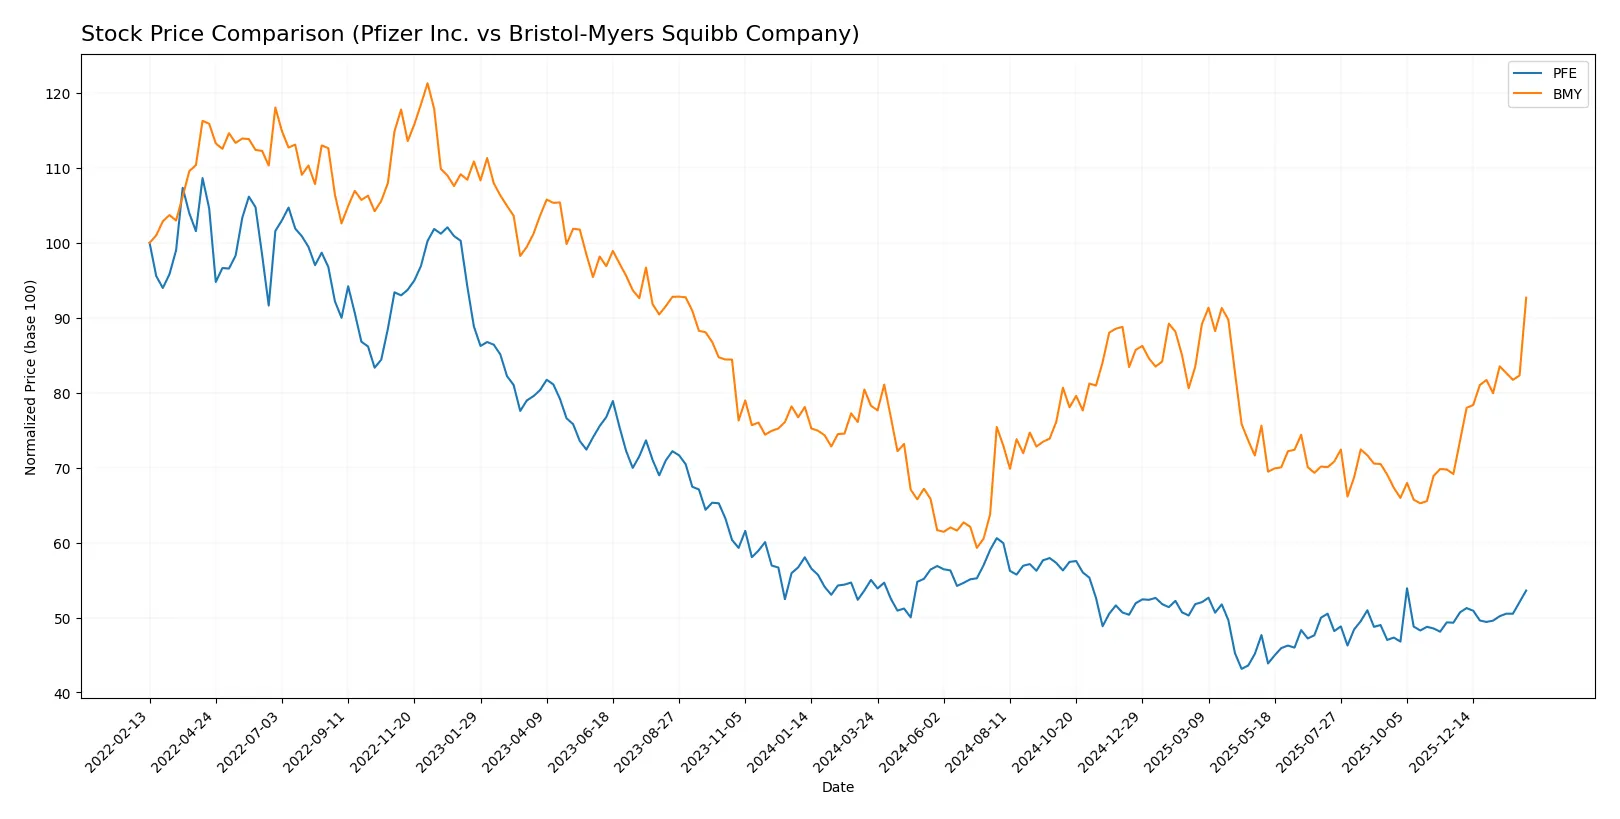
The past year reveals contrasting price dynamics: Pfizer Inc. shows a modest overall decline despite recent gains, while Bristol-Myers Squibb Company exhibits a strong upward trajectory marked by accelerating momentum.
Trend Comparison
Pfizer’s stock declined 2.58% over the past 12 months, indicating a bearish trend with accelerating downside momentum. The price ranged from $21.91 to $30.77, showing moderate volatility (1.97 std deviation).
Bristol-Myers Squibb’s stock rose 18.44% over the same period, reflecting a bullish trend with accelerating gains. The price fluctuated between $39.66 and $61.99, with higher volatility (5.52 std deviation).
Bristol-Myers Squibb outperformed Pfizer, delivering the highest market returns and demonstrating stronger price appreciation throughout the year.
Target Prices
Analysts present a clear consensus on target prices for Pfizer Inc. and Bristol-Myers Squibb Company.
| Company | Target Low | Target High | Consensus |
|---|---|---|---|
| Pfizer Inc. | 24 | 35 | 28 |
| Bristol-Myers Squibb Company | 40 | 72 | 60.11 |
Pfizer’s consensus target of $28 sits just above its current $27.22 price, suggesting moderate upside. Bristol-Myers Squibb’s $60.11 consensus aligns closely with its current $61.99 price, indicating stability with slight bullish potential.

Don’t Let Luck Decide Your Entry Point
Optimize your entry points with our advanced ProRealTime indicators. You’ll get efficient buy signals with precise price targets for maximum performance. Start outperforming now!
How do institutions grade them?
The following tables summarize recent institutional grades for Pfizer Inc. and Bristol-Myers Squibb Company:
Pfizer Inc. Grades
The table below shows Pfizer’s latest grades from key financial institutions.
| Grading Company | Action | New Grade | Date |
|---|---|---|---|
| Cantor Fitzgerald | Maintain | Neutral | 2026-02-04 |
| Cantor Fitzgerald | Maintain | Neutral | 2026-01-27 |
| Morgan Stanley | Maintain | Equal Weight | 2025-12-17 |
| B of A Securities | Maintain | Neutral | 2025-12-15 |
| Morgan Stanley | Maintain | Equal Weight | 2025-12-12 |
| Guggenheim | Maintain | Buy | 2025-11-24 |
| Morgan Stanley | Maintain | Equal Weight | 2025-10-10 |
| B of A Securities | Maintain | Neutral | 2025-10-03 |
| B of A Securities | Maintain | Neutral | 2025-08-06 |
| Morgan Stanley | Maintain | Equal Weight | 2025-08-06 |
Bristol-Myers Squibb Company Grades
Below are Bristol-Myers Squibb’s recent institutional grades reflecting varied outlooks.
| Grading Company | Action | New Grade | Date |
|---|---|---|---|
| Citigroup | Maintain | Neutral | 2026-02-06 |
| Wells Fargo | Maintain | Equal Weight | 2026-02-06 |
| Guggenheim | Maintain | Buy | 2026-02-06 |
| Piper Sandler | Maintain | Overweight | 2026-01-28 |
| Citigroup | Maintain | Neutral | 2026-01-27 |
| Leerink Partners | Maintain | Outperform | 2026-01-13 |
| Scotiabank | Maintain | Sector Perform | 2026-01-09 |
| UBS | Upgrade | Buy | 2026-01-07 |
| Citigroup | Maintain | Neutral | 2026-01-07 |
| B of A Securities | Upgrade | Buy | 2025-12-15 |
Which company has the best grades?
Bristol-Myers Squibb holds stronger grades overall, featuring upgrades to Buy and Outperform. Pfizer’s grades remain mostly Neutral and Equal Weight. This suggests Bristol-Myers Squibb may attract more positive investor sentiment.
Risks specific to each company
The following categories identify the critical pressure points and systemic threats facing both Pfizer Inc. and Bristol-Myers Squibb Company in the 2026 market environment:
1. Market & Competition
Pfizer Inc.
- Faces intense competition in biopharmaceuticals, with pressure on innovation and biosimilars.
Bristol-Myers Squibb Company
- Competes strongly in oncology and immunology but risks from emerging therapies and patent cliffs.
2. Capital Structure & Debt
Pfizer Inc.
- Maintains favorable debt-to-equity metrics but shows weak liquidity ratios, a red flag for short-term obligations.
Bristol-Myers Squibb Company
- Strong interest coverage signals good debt management, though debt-to-equity remains a concern.
3. Stock Volatility
Pfizer Inc.
- Low beta (0.441) indicates less volatility than the market, appealing for risk-averse investors.
Bristol-Myers Squibb Company
- Even lower beta (0.295) suggests Bristol-Myers Squibb is less volatile, offering defensive stock characteristics.
4. Regulatory & Legal
Pfizer Inc.
- Subject to global regulatory scrutiny, especially with complex vaccine and drug approvals.
Bristol-Myers Squibb Company
- Faces similar regulatory risks, with additional exposure in oncology drug approvals and patent litigation.
5. Supply Chain & Operations
Pfizer Inc.
- Complex global supply chain vulnerable to disruptions; contract manufacturing adds operational risk.
Bristol-Myers Squibb Company
- Also dependent on global suppliers; focus on specialty drugs adds operational complexity and risk.
6. ESG & Climate Transition
Pfizer Inc.
- Increasing pressure to improve ESG metrics; climate initiatives critical for reputation and regulatory compliance.
Bristol-Myers Squibb Company
- Stronger emphasis on sustainability reported; ESG risks tied to pharmaceutical waste and energy use.
7. Geopolitical Exposure
Pfizer Inc.
- Significant global footprint exposes Pfizer to geopolitical tensions and trade restrictions.
Bristol-Myers Squibb Company
- Also globally diversified but with slightly less exposure, reducing geopolitical risk somewhat.
Which company shows a better risk-adjusted profile?
Bristol-Myers Squibb’s strongest risk is its elevated debt-to-equity ratio, despite solid interest coverage. Pfizer’s liquidity weaknesses pose immediate financial stress risks. Bristol-Myers Squibb’s lower beta and safer Altman Z-score highlight a better risk-adjusted profile. Notably, Pfizer’s unfavorable ROIC versus WACC signals operational inefficiency, justifying caution.
Final Verdict: Which stock to choose?
Pfizer’s superpower lies in its consistent cash generation and strong gross margins, reflecting operational resilience. However, its declining returns on invested capital raise a point of vigilance. Pfizer suits investors seeking steady income with a tolerance for underlying profitability challenges—typically fitting an Income or Defensive Growth portfolio.
Bristol-Myers Squibb commands a strategic moat through its robust R&D pipeline and improving operating margins, reinforcing its innovation edge. It exhibits superior safety metrics and a more favorable recent price trajectory relative to Pfizer. This stock aligns well with investors favoring Growth at a Reasonable Price (GARP) profiles, balancing upside potential and financial stability.
If you prioritize reliable cash flow with moderate growth, Pfizer is the compelling choice due to its operational efficiency despite some value erosion risks. However, if you seek growth backed by innovation and better recent momentum, Bristol-Myers Squibb offers superior stability and upside potential, though with some debt considerations. Each scenario demands careful risk management aligned with your investment strategy.
Disclaimer: Investment carries a risk of loss of initial capital. The past performance is not a reliable indicator of future results. Be sure to understand risks before making an investment decision.
Go Further
I encourage you to read the complete analyses of Pfizer Inc. and Bristol-Myers Squibb Company to enhance your investment decisions: