Home > Comparison > Healthcare > MRK vs BMY
The strategic rivalry between Merck & Co., Inc. and Bristol-Myers Squibb Company shapes the healthcare sector’s evolution. Merck operates as a diversified pharmaceutical powerhouse with strong animal health and vaccine segments. Bristol-Myers Squibb excels as a focused biopharmaceutical innovator in oncology and immunology. This analysis contrasts their operational models to identify which offers superior risk-adjusted returns for diversified portfolios navigating healthcare’s dynamic landscape.

Table of contents
Companies Overview
Merck & Co. and Bristol-Myers Squibb shape the competitive landscape of the global pharmaceutical industry.
Merck & Co., Inc.: Diversified Healthcare Powerhouse
Merck & Co. dominates as a global healthcare company with two core segments: Pharmaceuticals and Animal Health. Its revenue stems from human pharmaceuticals in oncology, immunology, vaccines, and animal health products. In 2026, Merck prioritizes innovation in long-acting HIV treatments through strategic collaborations, reinforcing its competitive edge in specialty medicines.
Bristol-Myers Squibb Company: Biopharma Innovator
Bristol-Myers Squibb leads as a biopharmaceutical firm focused on hematology, oncology, cardiovascular, and immunology drugs. It generates revenue through a broad portfolio including Revlimid, Eliquis, and Opdivo. The company’s 2026 strategy emphasizes expanding immuno-oncology and specialty therapies, driving growth via novel treatments for cancer and autoimmune disorders.
Strategic Collision: Similarities & Divergences
Both firms compete fiercely in specialty pharmaceuticals but diverge in approach. Merck leans on a diversified portfolio and partnerships, while Bristol-Myers pursues deep innovation in biopharma niches. Their main battleground is oncology and immunology markets. Investors face distinct profiles: Merck offers broad exposure with steady dividend returns; Bristol-Myers targets higher growth through focused drug development.
Income Statement Comparison
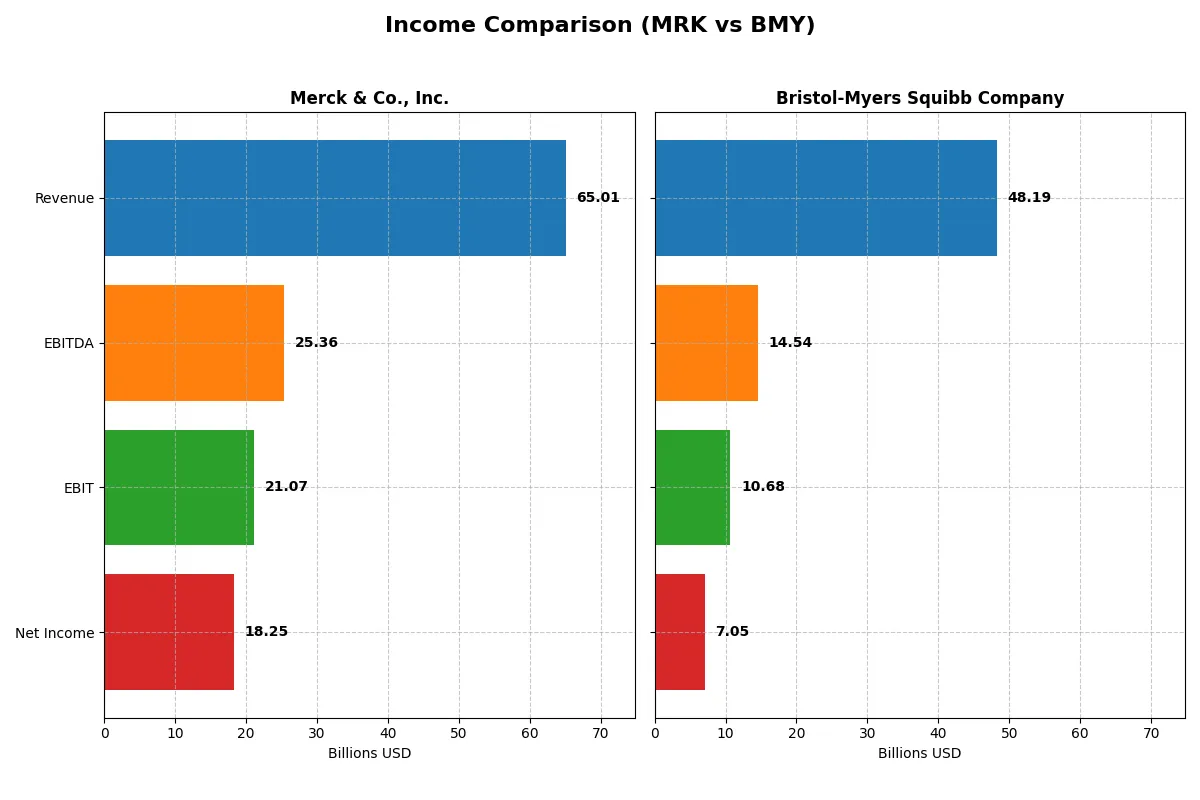
This data dissects the core profitability and scalability of both corporate engines to reveal who dominates the bottom line:
| Metric | Merck & Co., Inc. (MRK) | Bristol-Myers Squibb Company (BMY) |
|---|---|---|
| Revenue | 65B | 48.2B |
| Cost of Revenue | 12B | 15.6B |
| Operating Expenses | 26.2B | 19.9B |
| Gross Profit | 53B | 32.6B |
| EBITDA | 25.4B | 14.5B |
| EBIT | 21.1B | 10.7B |
| Interest Expense | 0 | 1.5B |
| Net Income | 18.3B | 7.1B |
| EPS | 7.28 | 3.46 |
| Fiscal Year | 2025 | 2025 |
Income Statement Analysis: The Bottom-Line Duel
The following income statement comparison reveals which company runs a more efficient and profitable business engine in a challenging pharmaceutical landscape.
Merck & Co., Inc. Analysis
Merck’s revenue climbed steadily from 49B in 2021 to 65B in 2025, with net income surging from 13B to 18.3B. Its gross margin remains robust at 81.5%, and net margin impresses at 28.1%. Despite a slight dip in EBIT growth last year, Merck sustains strong profitability momentum and operational efficiency.
Bristol-Myers Squibb Company Analysis
Bristol-Myers Squibb’s revenue showed minimal growth, hovering around 46B–48B from 2021 to 2025. Net income fluctuated widely, with a steep loss in 2024 before recovering to 7B in 2025. Its gross margin stands at a healthy 67.7%, but net margin lags at 14.6%. The firm posted a strong EBIT rebound last year, signaling a turnaround in operating performance.
Margin Dominance vs. Recovery Trajectory
Merck outpaces Bristol-Myers Squibb with superior revenue growth and consistently higher margins. Merck’s ability to convert sales into profit is nearly double BMY’s net margin, highlighting stronger operational leverage. For investors prioritizing disciplined profitability and steady expansion, Merck’s profile offers a more attractive and reliable income statement foundation.
Financial Ratios Comparison
These vital ratios act as a diagnostic tool to expose the underlying fiscal health, valuation premiums, and capital efficiency of the companies analyzed:
| Ratios | Merck & Co., Inc. (MRK) | Bristol-Myers Squibb Company (BMY) |
|---|---|---|
| ROE | 35.17% (2025) | N/A (2025) |
| ROIC | N/A | N/A |
| P/E | 14.46 (2025) | 15.55 (2025) |
| P/B | 5.08 (2025) | N/A |
| Current Ratio | 0.00 (2025) | 0.00 (2025) |
| Quick Ratio | 0.00 (2025) | 0.00 (2025) |
| D/E (Debt-to-Equity) | 0.00 (2025) | 0.00 (2025) |
| Debt-to-Assets | 0.00 (2025) | 0.00 (2025) |
| Interest Coverage | 0.00 (2025) | 4.93 (2025) |
| Asset Turnover | 0.00 (2025) | 0.00 (2025) |
| Fixed Asset Turnover | 0.00 (2025) | 0.00 (2025) |
| Payout ratio | 45.05% (2025) | 71.51% (2025) |
| Dividend yield | 3.12% (2025) | 4.60% (2025) |
| Fiscal Year | 2025 | 2025 |
Efficiency & Valuation Duel: The Vital Signs
Financial ratios serve as a company’s DNA, uncovering hidden risks and revealing operational excellence behind the numbers.
Merck & Co., Inc.
Merck delivers strong profitability with a 35.17% ROE and a robust 28.08% net margin, signaling operational efficiency. The stock trades at a favorable P/E of 14.46, suggesting reasonable valuation. Merck supports shareholders with a 3.12% dividend yield, balancing income with substantial reinvestment in R&D at 24%.
Bristol-Myers Squibb Company
Bristol-Myers Squibb posts a moderate 14.64% net margin but lacks reported ROE, indicating profitability concerns. Its P/E of 15.55 sits in neutral territory, reflecting fair valuation. The company offers a higher 4.6% dividend yield, prioritizing shareholder returns over aggressive reinvestment, with R&D spending near 21%.
Premium Valuation vs. Operational Safety
Merck’s superior profitability and favorable valuation create a stronger risk-reward profile despite fewer favorable ratios than Bristol-Myers. Bristol-Myers leans on dividends, appealing to income-focused investors, while Merck suits those seeking a blend of growth and income.
Which one offers the Superior Shareholder Reward?
I see Merck delivers a 3.1% dividend yield with a prudent 45% payout ratio, supported by stable free cash flow. Its moderate buyback activity complements dividends, creating balanced shareholder returns. Bristol-Myers Squibb yields 4.6%, but with a higher 71.5% payout, risking dividend sustainability. BMY’s aggressive buybacks boost returns but leverage raises caution. Historically, Merck’s distribution approach appears more sustainable for long-term value. I conclude Merck offers a superior total return profile for 2026 investors prioritizing reliable income and capital preservation.
Comparative Score Analysis: The Strategic Profile
The radar chart reveals the fundamental DNA and trade-offs of Merck & Co., Inc. and Bristol-Myers Squibb Company:
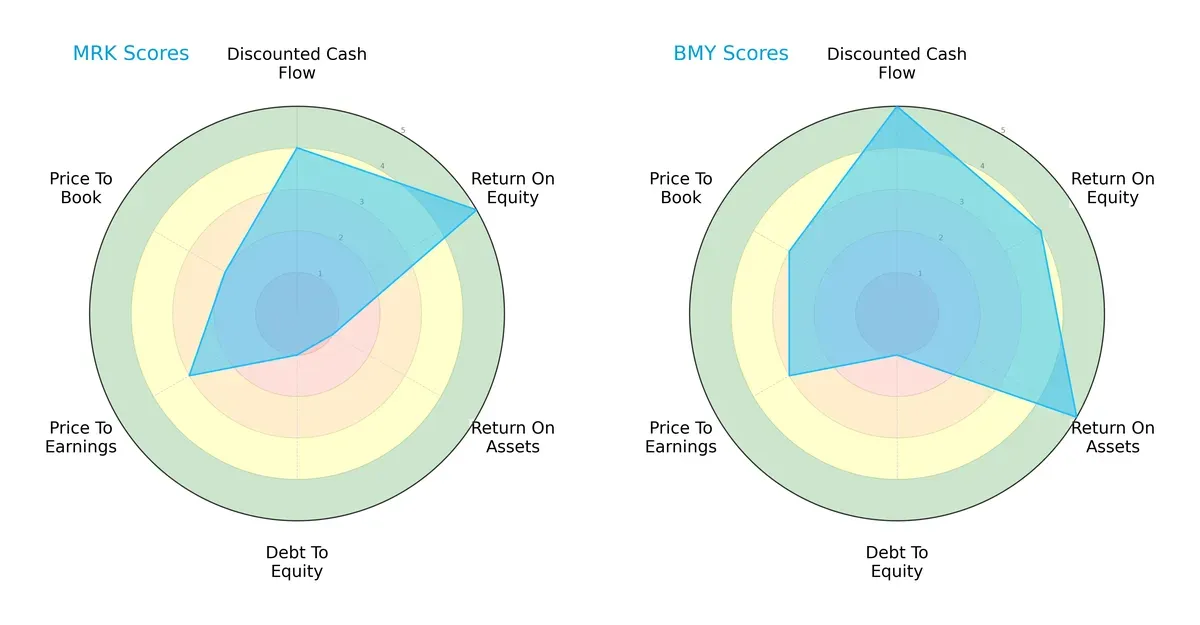
Merck shows strength in ROE (5) and DCF (4) but suffers from weak asset utilization (ROA 1) and high leverage (Debt/Equity 1). Bristol-Myers Squibb balances strong ROA (5) and DCF (5) with solid ROE (4), though both share high debt risk (Debt/Equity 1). Bristol-Myers Squibb presents a more balanced profile, while Merck relies heavily on equity efficiency.
Financial Health: Quality of Operations
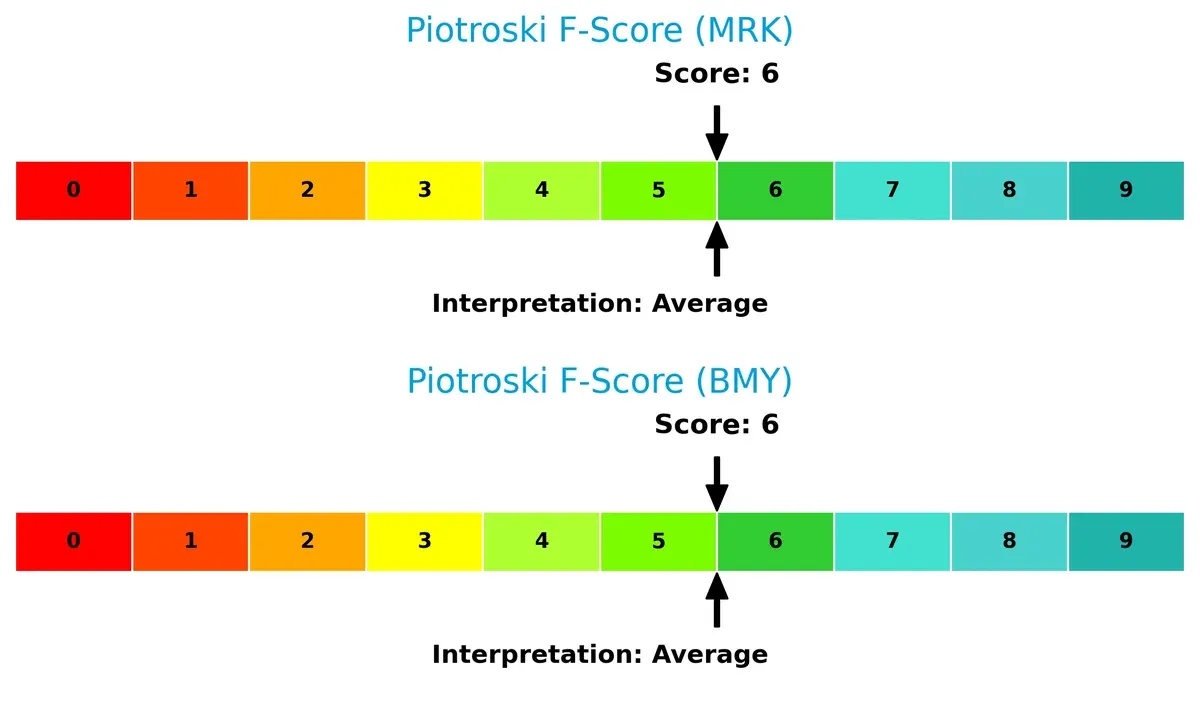
Both Merck and Bristol-Myers Squibb score 6 on the Piotroski F-Score, indicating average financial health and operational quality. Neither firm shows immediate red flags, but there is room for improvement in internal metrics:
How are the two companies positioned?
This section dissects the operational DNA of MRK and BMY by comparing their revenue distribution by segment and internal dynamics. The goal is to confront their economic moats to identify which model offers the most resilient and sustainable advantage today.
Revenue Segmentation: The Strategic Mix
This visual comparison dissects how Merck & Co., Inc. and Bristol-Myers Squibb Company diversify their income streams and where their primary sector bets lie:
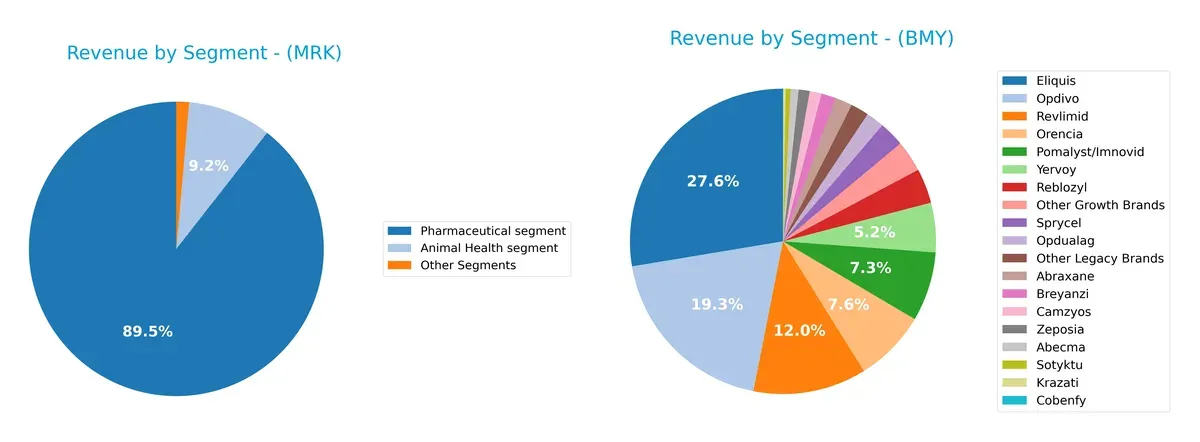
Merck anchors revenue heavily in its Pharmaceutical segment, generating $57.4B in 2024, dwarfing its Animal Health ($5.9B) and Other Segments ($0.9B). This concentration highlights its ecosystem lock-in on pharmaceuticals. Bristol-Myers Squibb exhibits a far more diversified mix, with top products like Eliquis ($13.3B), Opdivo ($9.3B), and Revlimid ($5.8B), but no single segment dominates as starkly. BMY’s strategy mitigates concentration risk while pivoting across multiple growth brands.
Strengths and Weaknesses Comparison
This table compares the Strengths and Weaknesses of Merck & Co., Inc. (MRK) and Bristol-Myers Squibb Company (BMY):
MRK Strengths
- Strong pharmaceutical segment revenue exceeding 57B USD
- Favorable net margin of 28% and ROE above 35%
- Robust dividend yield at 3.12%
- Global presence with significant U.S. and diverse international sales
BMY Strengths
- Diversified product portfolio with multiple growth and legacy brands
- Favorable net margin at 14.6%
- Solid dividend yield at 4.6%
- Strong U.S. market presence with over 34B USD revenue
MRK Weaknesses
- Unfavorable ROIC at 0% indicating capital inefficiency
- Weak liquidity ratios with current and quick ratios at 0
- High price-to-book at 5.08 may suggest valuation concerns
- Unfavorable asset turnover ratios
BMY Weaknesses
- Unfavorable ROE and ROIC at 0%, signaling profitability issues
- Missing WACC data limits cost of capital assessment
- Weak liquidity ratios with current and quick ratios at 0
- Neutral PE ratio suggests market uncertainty
Merck demonstrates strong profitability and global diversification but faces challenges in capital efficiency and liquidity. Bristol-Myers Squibb shows broad product diversification and steady dividends but struggles with return metrics and incomplete cost of capital data. Both companies must address operational efficiency to strengthen their financial foundation.
The Moat Duel: Analyzing Competitive Defensibility
A structural moat is the only enduring shield protecting long-term profits from relentless competitive erosion. Let’s dissect the moats of two pharma giants:
Merck & Co., Inc.: Intangible Assets and Diversified Innovation
Merck leverages patented drugs and vaccines, sustaining high margins around 32% EBIT despite flat revenue growth in 2025. Its broad R&D pipeline and global reach bolster its moat, though declining ROIC signals caution for future capital efficiency.
Bristol-Myers Squibb Company: Portfolio Depth and Market Penetration
Bristol-Myers Squibb’s moat centers on a diversified product portfolio in oncology and immunology, fueling strong EBIT growth of 266% last year. Though ROIC trends decline and WACC data is missing, its aggressive expansion in immunotherapies suggests potential deepening of competitive advantage.
Patent Strength vs. Portfolio Expansion: Who Holds the Moat Edge?
Merck’s high margin stability contrasts Bristol-Myers’ explosive EBIT growth, but Merck’s negative ROIC compared to WACC warns of deteriorating capital returns. Without clear ROIC data, Bristol-Myers’ moat depth is uncertain but poised for growth. I view Merck’s intangible asset moat as currently wider, yet Bristol-Myers may better defend market share through innovation-driven expansion.
Which stock offers better returns?
Both Merck & Co., Inc. and Bristol-Myers Squibb Company show strong price movements over the past year, with accelerating bullish trends and notable highs reached recently.
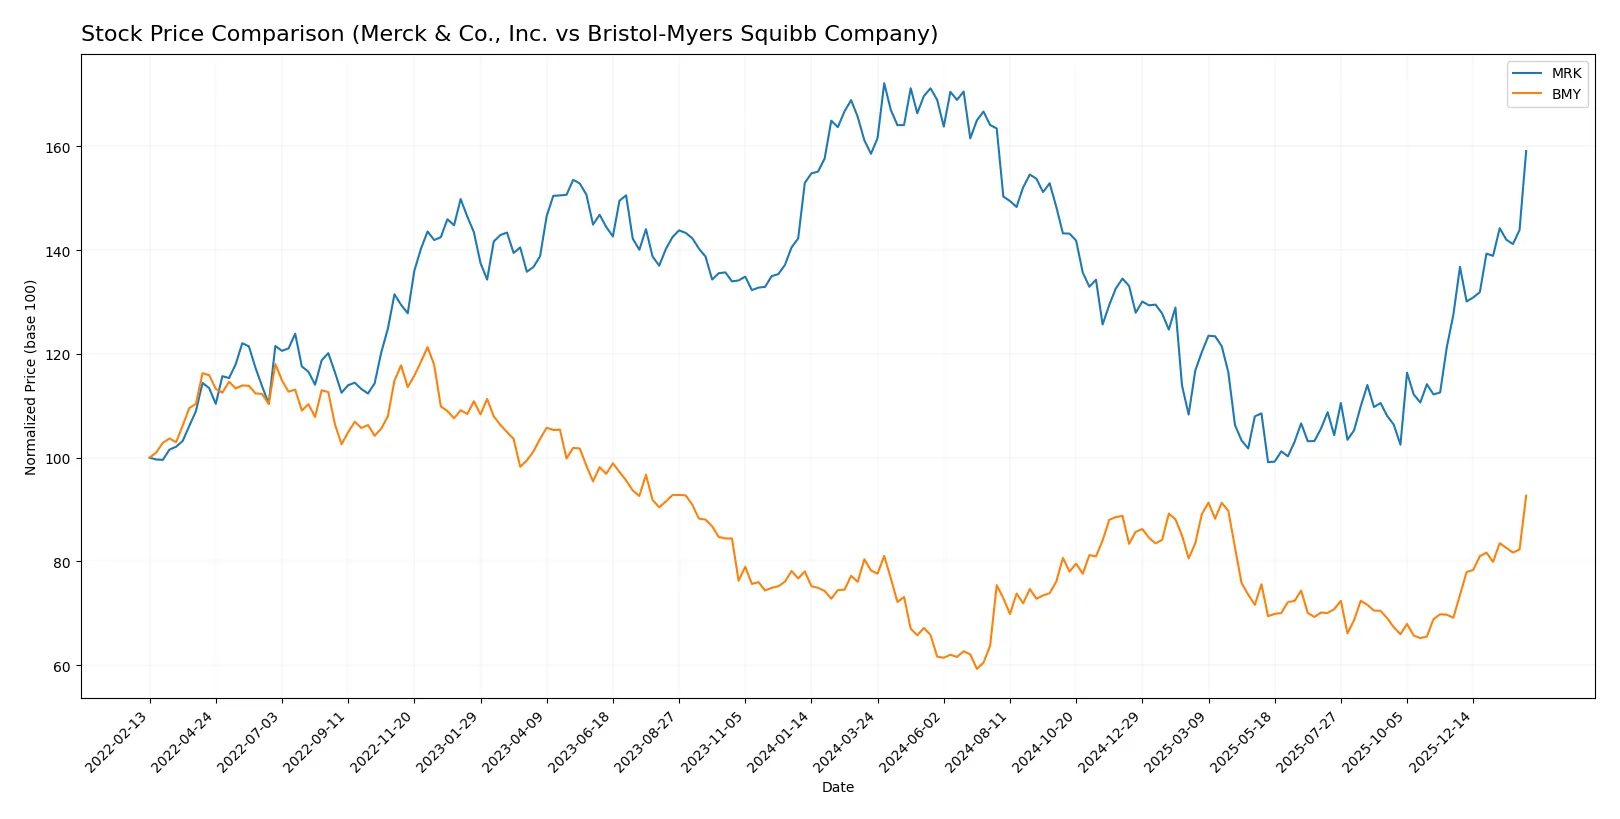
Trend Comparison
Merck’s stock gained 0.34% over the past year, maintaining a bullish trend with accelerating momentum and a wide price range between 76 and 132. Volatility is relatively high at 17.48.
Bristol-Myers Squibb’s stock rose 18.44%, showing a bullish and accelerating trend with less volatility at 5.52. The price fluctuated between 40 and 62, reflecting steady upward momentum.
BMY delivered the highest market performance with an 18.44% gain versus MRK’s 0.34%, both accelerating but BMY showing stronger sustained price appreciation.
Target Prices
Analysts present a clear target consensus for Merck & Co., Inc. and Bristol-Myers Squibb Company.
| Company | Target Low | Target High | Consensus |
|---|---|---|---|
| Merck & Co., Inc. | 90 | 136 | 119.91 |
| Bristol-Myers Squibb | 40 | 72 | 60.11 |
Merck’s consensus target of 119.91 sits slightly below its current price of 121.93, suggesting limited upside. Bristol-Myers’ consensus target of 60.11 aligns closely with its current price of 61.99, indicating a stable outlook.

Don’t Let Luck Decide Your Entry Point
Optimize your entry points with our advanced ProRealTime indicators. You’ll get efficient buy signals with precise price targets for maximum performance. Start outperforming now!
How do institutions grade them?
The following tables summarize recent institutional grades for Merck & Co., Inc. and Bristol-Myers Squibb Company:
Merck & Co., Inc. Grades
This table presents the latest grades from established financial institutions for Merck & Co., Inc.
| Grading Company | Action | New Grade | Date |
|---|---|---|---|
| Wells Fargo | maintain | Overweight | 2026-02-04 |
| Citigroup | maintain | Neutral | 2026-02-04 |
| Cantor Fitzgerald | maintain | Neutral | 2026-02-04 |
| TD Cowen | maintain | Hold | 2026-01-20 |
| Wolfe Research | upgrade | Outperform | 2026-01-08 |
| UBS | maintain | Buy | 2026-01-07 |
| BMO Capital | upgrade | Outperform | 2025-12-18 |
| B of A Securities | maintain | Buy | 2025-12-15 |
Bristol-Myers Squibb Company Grades
This table shows recent grade updates from reputable institutions for Bristol-Myers Squibb Company.
| Grading Company | Action | New Grade | Date |
|---|---|---|---|
| Citigroup | maintain | Neutral | 2026-02-06 |
| Wells Fargo | maintain | Equal Weight | 2026-02-06 |
| Guggenheim | maintain | Buy | 2026-02-06 |
| Piper Sandler | maintain | Overweight | 2026-01-28 |
| Leerink Partners | maintain | Outperform | 2026-01-13 |
| Scotiabank | maintain | Sector Perform | 2026-01-09 |
| UBS | upgrade | Buy | 2026-01-07 |
| B of A Securities | upgrade | Buy | 2025-12-15 |
Which company has the best grades?
Merck shows a more consistent presence of “Buy” and “Outperform” grades, including recent upgrades by Wolfe Research and BMO Capital. Bristol-Myers Squibb has strong “Buy” support but more mixed neutrality and sector perform grades. Investors may view Merck’s stronger consensus upgrades as a sign of greater institutional confidence.
Risks specific to each company
The following categories identify the critical pressure points and systemic threats facing both firms in the 2026 market environment:
1. Market & Competition
Merck & Co., Inc.
- Operates in diverse therapeutic areas, facing intense competition from innovative biotech firms and generics.
Bristol-Myers Squibb Company
- Focuses on oncology and immunology, competing heavily with specialized biopharma and new entrants.
2. Capital Structure & Debt
Merck & Co., Inc.
- Maintains a conservative debt profile with strong interest coverage and low leverage.
Bristol-Myers Squibb Company
- Also shows low leverage but weaker debt-to-equity metrics indicating potential financial risk.
3. Stock Volatility
Merck & Co., Inc.
- Exhibits low beta (~0.30), indicating stability and lower sensitivity to market swings.
Bristol-Myers Squibb Company
- Similar low beta (~0.29), suggesting comparable market risk and stock price stability.
4. Regulatory & Legal
Merck & Co., Inc.
- Faces ongoing regulatory scrutiny in oncology and vaccine markets but benefits from established approvals.
Bristol-Myers Squibb Company
- Regulatory exposure heightened in newly launched therapies and immuno-oncology segments, increasing legal risks.
5. Supply Chain & Operations
Merck & Co., Inc.
- Strong global supply chains with digital traceability; however, operational efficiency metrics are unfavorable.
Bristol-Myers Squibb Company
- Operational metrics also weak; risks include supply disruptions and integration challenges post acquisitions.
6. ESG & Climate Transition
Merck & Co., Inc.
- Focuses on sustainability initiatives, but climate transition costs could pressure margins.
Bristol-Myers Squibb Company
- ESG efforts improving, yet transition risks remain significant given energy-intensive manufacturing.
7. Geopolitical Exposure
Merck & Co., Inc.
- Global footprint exposes it to trade tensions and regulatory divergence, especially in emerging markets.
Bristol-Myers Squibb Company
- Similar global risks with added sensitivity to US healthcare policy changes and international patent laws.
Which company shows a better risk-adjusted profile?
Merck faces its greatest risk from operational inefficiencies despite strong capital structure and market positioning. Bristol-Myers Squibb’s most critical risk lies in its debt-to-equity profile amid regulatory and integration challenges. Given Merck’s superior interest coverage and lower financial risk, it shows a better risk-adjusted profile. Notably, Merck’s low beta and robust dividend yield reinforce its defensive stance in volatile markets.
Final Verdict: Which stock to choose?
Merck’s superpower lies in its robust profitability and disciplined capital allocation, delivering strong returns on equity and steady dividend yield. However, its declining ROIC and stretched valuation multiples signal a point of vigilance. It suits portfolios aiming for stable income with moderate growth exposure.
Bristol-Myers Squibb boasts a strategic moat through its recurring revenue streams and solid free cash flow yield. Relative to Merck, it offers better recent price momentum and a stronger balance sheet safety profile. It fits well within GARP portfolios seeking growth balanced with reasonable valuation.
If you prioritize consistent profitability and income stability, Merck is the compelling choice due to its strong net margins and shareholder returns. However, if you seek growth with a focus on cash flow and balance sheet resilience, Bristol-Myers Squibb offers better stability and momentum, commanding a premium in risk-managed growth strategies.
Disclaimer: Investment carries a risk of loss of initial capital. The past performance is not a reliable indicator of future results. Be sure to understand risks before making an investment decision.
Go Further
I encourage you to read the complete analyses of Merck & Co., Inc. and Bristol-Myers Squibb Company to enhance your investment decisions: