Home > Comparison > Healthcare > JNJ vs BMY
The strategic rivalry between Johnson & Johnson and Bristol-Myers Squibb defines the current trajectory of the healthcare sector. Johnson & Johnson operates as a diversified healthcare giant with robust medical devices and innovative medicine segments. Bristol-Myers Squibb focuses on biopharmaceutical innovation, targeting oncology and immunology with a leaner operational model. This analysis will assess which company’s strategy offers superior risk-adjusted returns for a diversified portfolio in this dynamic industry.

Table of contents
Companies Overview
Johnson & Johnson and Bristol-Myers Squibb Company are titans in the global pharmaceutical landscape, shaping healthcare innovation.
Johnson & Johnson: Healthcare Innovator with Diverse MedTech Focus
Johnson & Johnson dominates as a healthcare conglomerate with a market cap of 578B. It earns most revenue from its Innovative Medicine segment, addressing complex diseases like cancer and neurodegenerative disorders. In 2026, it sharpened its strategic focus by spinning off Consumer Health to concentrate on high-growth pharmaceuticals and advanced medical devices.
Bristol-Myers Squibb Company: Biopharma Powerhouse with Oncology Emphasis
Bristol-Myers Squibb specializes as a biopharmaceutical leader with a 126B market cap. Its core revenue derives from specialty drugs targeting oncology, hematology, and immunology, including blockbuster therapies like Revlimid and Opdivo. The company’s 2026 strategy emphasizes expanding its pipeline in cancer and immune-mediated diseases to sustain growth.
Strategic Collision: Specialty Pharma vs. Diversified Healthcare
Johnson & Johnson pursues a broad healthcare model combining pharmaceuticals and medical devices, while Bristol-Myers Squibb focuses on a specialized biopharma portfolio. Their primary battle lies in oncology treatments and immunology drugs. Johnson & Johnson offers a diversified risk profile, whereas Bristol-Myers Squibb presents a concentrated growth opportunity rooted in innovation-driven drug development.
Income Statement Comparison
This data dissects the core profitability and scalability of both corporate engines to reveal who dominates the bottom line:
| Metric | Johnson & Johnson (JNJ) | Bristol-Myers Squibb Company (BMY) |
|---|---|---|
| Revenue | 94.2B | 48.2B |
| Cost of Revenue | 25.6B | 15.6B |
| Operating Expenses | 42.9B | 19.9B |
| Gross Profit | 68.6B | 32.6B |
| EBITDA | 32.6B | 14.5B |
| EBIT | 32.6B | 10.7B |
| Interest Expense | 0 | 1.5B |
| Net Income | 26.8B | 7.1B |
| EPS | 11.03 | 3.45 |
| Fiscal Year | 2025 | 2025 |
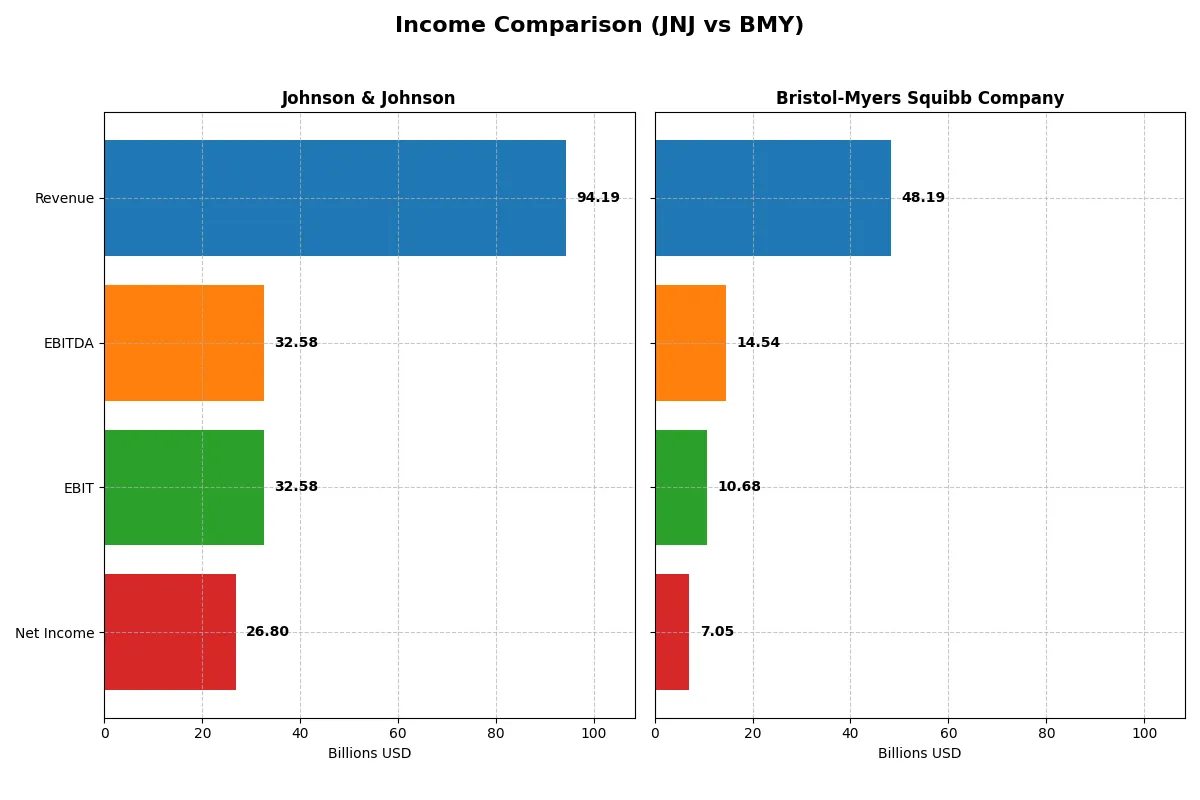
Income Statement Analysis: The Bottom-Line Duel
This income statement comparison reveals which company executes its business model most efficiently and sustains profitability.
Johnson & Johnson Analysis
Johnson & Johnson’s revenue rose steadily, reaching 94.2B in 2025, with net income surging to 26.8B. Its gross margin remained robust at 72.8%, and net margin improved sharply to 28.5%. The 2025 results show accelerating profitability and efficient cost control, despite a slight unfavorable operating expense growth relative to revenue.
Bristol-Myers Squibb Company Analysis
Bristol-Myers Squibb’s revenue hovered near 48.2B in 2025, showing minimal growth. Net income rebounded strongly to 7.1B after a prior loss. Gross margin held favorably at 67.6%, with net margin at 14.6%. The company displayed impressive EBIT and earnings growth momentum in 2025, but revenue stagnation and higher interest expense remain concerns.
Margin Leadership vs. Earnings Momentum
Johnson & Johnson dominates with superior margins and consistent revenue growth, delivering higher profitability and margin expansion. Bristol-Myers Squibb shows strong earnings recovery and margin improvement but lags in top-line growth and margin scale. Investors seeking stable, high-margin performance may prefer Johnson & Johnson’s profile over Bristol-Myers Squibb’s rebound-driven momentum.
Financial Ratios Comparison
These vital ratios act as a diagnostic tool to expose the underlying fiscal health, valuation premiums, and capital efficiency of the companies compared below:
| Ratios | Johnson & Johnson (JNJ) | Bristol-Myers Squibb (BMY) |
|---|---|---|
| ROE | 19.7% (2024) | -54.8% (2024) |
| ROIC | 13.8% (2024) | 13.6% (2024) |
| P/E | 24.5 (2024) | -12.8 (2024) |
| P/B | 4.83 (2024) | 7.02 (2024) |
| Current Ratio | 1.11 (2024) | 1.25 (2024) |
| Quick Ratio | 0.86 (2024) | 1.15 (2024) |
| D/E | 0.51 (2024) | 3.13 (2024) |
| Debt-to-Assets | 20.3% (2024) | 55.3% (2024) |
| Interest Coverage | 29.3 (2024) | 5.0 (2024) |
| Asset Turnover | 0.49 (2024) | 0.52 (2024) |
| Fixed Asset Turnover | 4.33 (2024) | 5.78 (2024) |
| Payout ratio | 84.1% (2024) | -54.3% (2024) |
| Dividend yield | 3.43% (2024) | 4.24% (2024) |
| Fiscal Year | 2024 | 2024 |
Efficiency & Valuation Duel: The Vital Signs
Ratios act as a company’s DNA, revealing hidden risks and operational excellence that numbers alone cannot convey.
Johnson & Johnson
Johnson & Johnson posts a favorable net margin of 28.46%, signaling strong profitability, while its P/E ratio of 18.75 suggests a fairly valued stock. Despite neutral valuation, its 2.48% dividend yield rewards shareholders steadily. The firm balances reinvestment with income distribution, reflecting a mature capital allocation approach.
Bristol-Myers Squibb Company
Bristol-Myers Squibb shows a solid net margin of 14.64%, indicating reasonable profitability, and a P/E of 15.55 denotes moderate valuation. Its higher 4.6% dividend yield offers compelling income, complemented by a favorable interest coverage ratio of 7.08. The firm emphasizes shareholder returns through dividends amid cautious reinvestment.
Dividend Yield Strength vs. Profitability Edge
Both companies share a neutral overall ratio profile, but J&J offers superior profitability with moderate income returns, while BMY prioritizes higher dividend yield and interest coverage. Investors seeking stable growth may lean toward J&J’s operational edge; income-focused investors might favor BMY’s payout profile.
Which one offers the Superior Shareholder Reward?
I see Johnson & Johnson pays a 2.48% dividend yield with a moderate 46.5% payout ratio, balancing income and retained earnings. JNJ also pursues consistent buybacks, enhancing total returns sustainably. Bristol-Myers Squibb offers a higher 4.6% yield but with a riskier 71.5% payout ratio and higher leverage, exposing investors to potential payout cuts. While BMY’s yield is attractive, JNJ’s balanced distribution and strong buyback discipline deliver a more reliable long-term shareholder reward in 2026.
Comparative Score Analysis: The Strategic Profile
The radar chart reveals the fundamental DNA and trade-offs of Johnson & Johnson and Bristol-Myers Squibb Company:
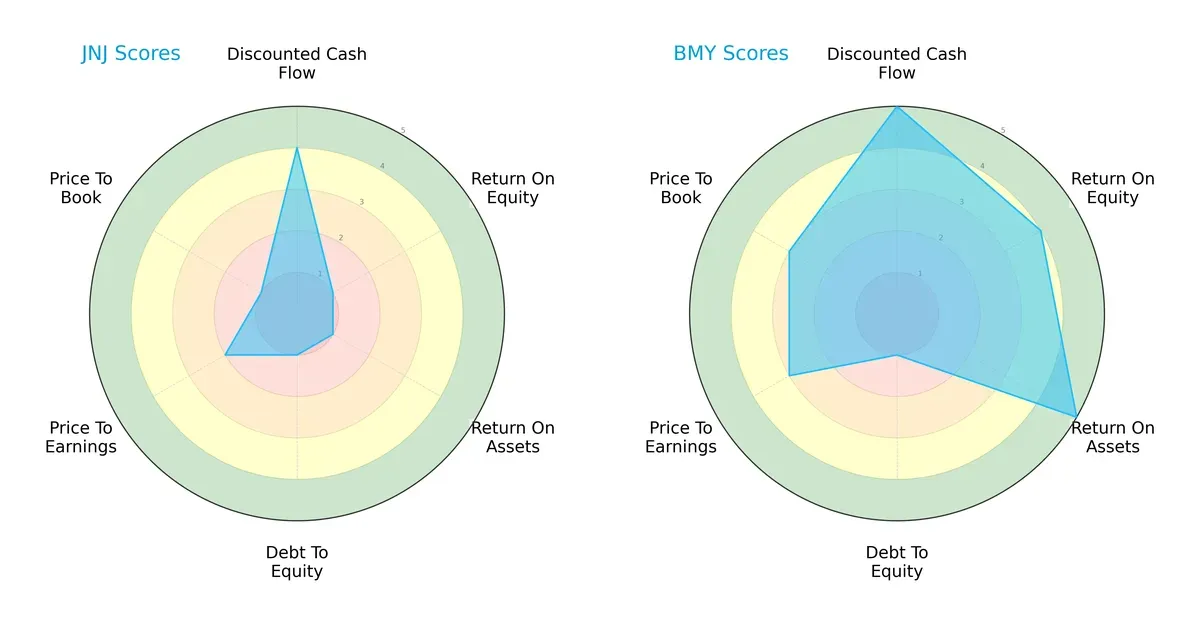
Bristol-Myers Squibb shows a robust performance with high DCF (5), ROE (4), and ROA (5) scores, signaling operational efficiency and growth potential. Johnson & Johnson, in contrast, has a more muted profile with moderate DCF (4) but very weak ROE (1) and ROA (1), highlighting profitability challenges. Both share a weak debt-to-equity score (1), but Bristol-Myers offers better valuation metrics (PE/PB of 3 each) compared to Johnson & Johnson’s unfavorable scores (2 and 1). Bristol-Myers presents a more balanced and growth-oriented profile, while Johnson & Johnson relies heavily on discounted cash flow strength alone.
Bankruptcy Risk: Solvency Showdown
The Altman Z-Score underscores Bristol-Myers Squibb’s superior financial safety (7.64) over Johnson & Johnson (5.25), both comfortably in the safe zone:
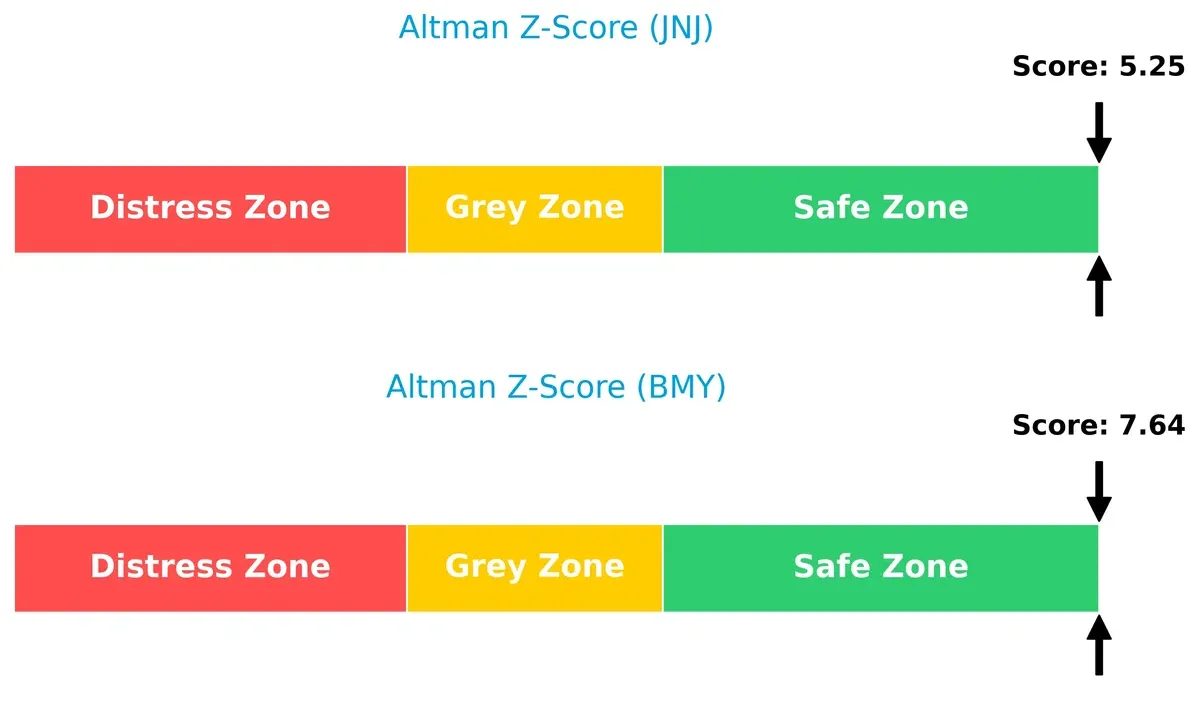
Bristol-Myers’ higher Z-Score indicates stronger resilience to economic stress and lower bankruptcy risk across this cycle. Johnson & Johnson remains solvent but with less cushion, suggesting more vigilance is warranted.
Financial Health: Quality of Operations
Piotroski F-Scores reveal Bristol-Myers Squibb’s healthier internal metrics (6) versus Johnson & Johnson’s average (4):
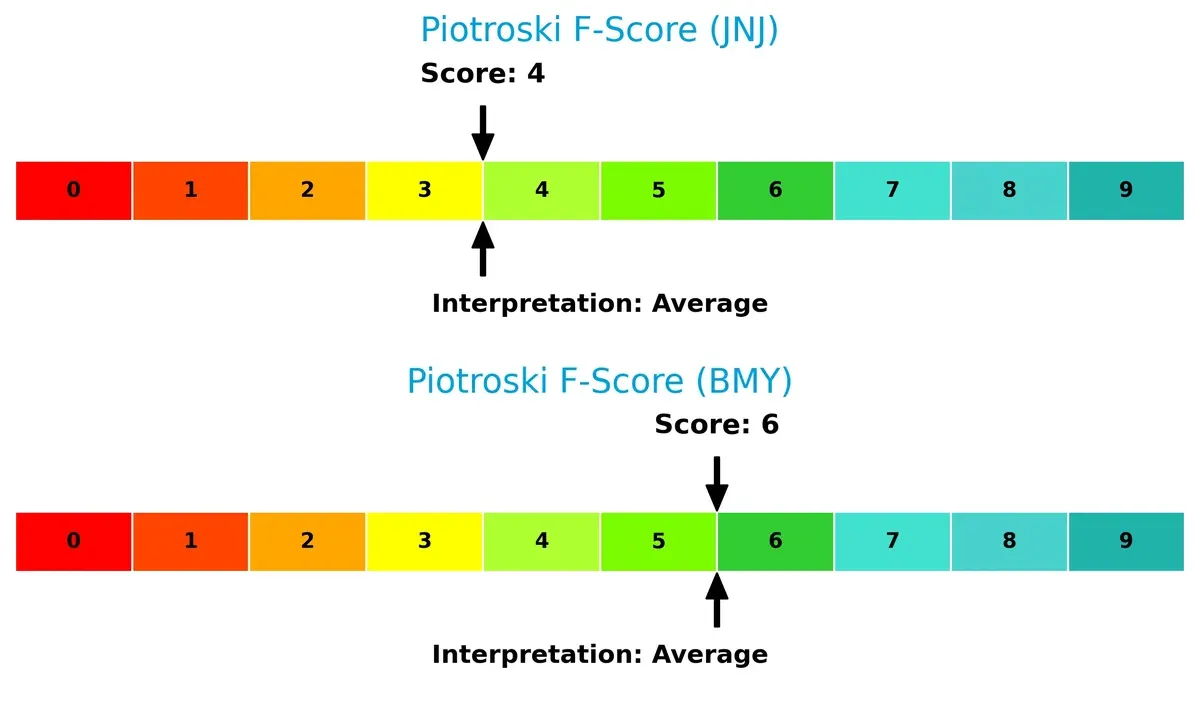
While neither company scores in the “strong” range, Bristol-Myers demonstrates superior profitability, liquidity, and efficiency signals. Johnson & Johnson’s lower score flags potential internal weaknesses and operational risks that investors should monitor carefully.
How are the two companies positioned?
This section dissects the operational DNA of JNJ and BMY by comparing their revenue distribution by segment and internal dynamics. The goal is to confront their economic moats and identify which business model offers the most resilient and sustainable competitive advantage today.
Revenue Segmentation: The Strategic Mix
This visual comparison dissects how Johnson & Johnson and Bristol-Myers Squibb diversify their income streams and where their primary sector bets lie:
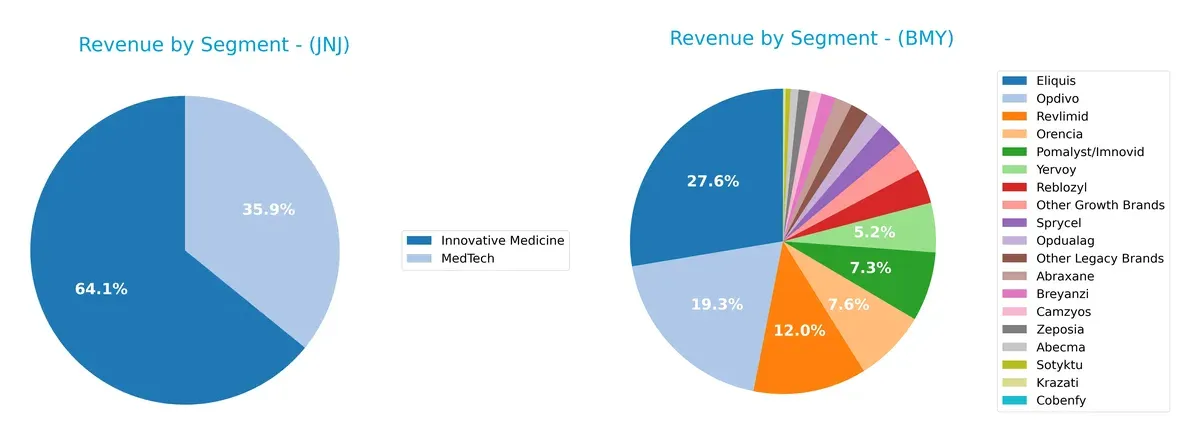
Johnson & Johnson’s revenue pivots on two dominant segments: Innovative Medicine ($57B) and MedTech ($32B), showcasing a balanced but focused portfolio. Bristol-Myers Squibb dwarfs with a highly concentrated pharmaceutical mix, led by Eliquis ($13.3B) and Opdivo ($9.3B). J&J’s diversification cushions against sector risks, while BMY’s reliance on blockbuster drugs creates concentration risk but also signals a strong pharma moat anchored in specialty therapies.
Strengths and Weaknesses Comparison
This table compares the strengths and weaknesses of Johnson & Johnson and Bristol-Myers Squibb Company based on key financial and market factors:
Johnson & Johnson Strengths
- Diversified revenue streams across Innovative Medicine, MedTech, and Consumer segments
- Strong global presence with significant sales in the U.S., Europe, and Asia-Pacific
- Favorable net margin at 28.46%
- Low debt-to-assets ratio indicating solid financial stability
- Dividend yield of 2.48% supports shareholder returns
Bristol-Myers Squibb Strengths
- Focused portfolio with leading products like Eliquis and Opdivo driving revenue
- Favorable net margin at 14.64% with efficient interest coverage of 7.08x
- Higher dividend yield at 4.6% indicating strong cash flow for dividends
- Favorable debt metrics like low debt-to-assets ratio
- Global sales distributed between U.S. and Rest of World regions
Johnson & Johnson Weaknesses
- Unfavorable ROE and ROIC at 0%, indicating weak capital efficiency
- Unavailable WACC data limits cost of capital assessment
- Poor liquidity ratios (current and quick ratios at 0) pose short-term risk
- Neutral P/E of 18.75 suggests moderate valuation
- Unfavorable asset turnover ratios suggest operational inefficiency
Bristol-Myers Squibb Weaknesses
- Similarly unfavorable ROE and ROIC at 0%, signaling capital allocation challenges
- Unavailable WACC data restricts full financial analysis
- Weak liquidity ratios (current and quick ratios at 0) raise caution
- Neutral P/E of 15.55 reflects moderate market pricing
- Unfavorable asset turnover ratios point to less efficient asset use
Both companies show balanced favorable and unfavorable financial metrics resulting in neutral overall financial health. J&J’s broader diversification and global footprint contrast with BMY’s concentrated product strength and higher dividend yield, shaping different strategic priorities. Each faces liquidity and capital efficiency challenges that require ongoing management focus.
The Moat Duel: Analyzing Competitive Defensibility
A structural moat is the only true barrier protecting long-term profits from relentless competitive pressure and market disruption:
Johnson & Johnson: Innovation-Driven Scale and Diversification
JNJ’s moat stems from its diversified portfolio and strong intangible assets in pharmaceuticals and MedTech. High gross margins (73%) and EBIT margins (35%) reflect this. New therapies and tech could deepen its moat but require vigilance against patent cliffs in 2026.
Bristol-Myers Squibb Company: Focused Biopharma Pipeline
BMY relies on specialized drug innovation and patent-protected oncology treatments, contrasting JNJ’s broad base. Despite lower margins (gross 68%, EBIT 22%), BMY’s sharp EBIT growth signals efficient capital use. Pipeline expansion into immunology offers disruption potential.
Innovation Breadth vs. Focused Pipeline: Who Defends Better?
JNJ’s wider moat arises from its diversified product base and stable, high margins, offering resilience. BMY’s deeper but narrower moat depends on successful pipeline launches. I see JNJ better equipped to defend market share in 2026’s evolving healthcare landscape.
Which stock offers better returns?
Over the past year, Johnson & Johnson and Bristol-Myers Squibb exhibited strong price appreciation, with notable acceleration and varying trading volume trends shaping their market dynamics.
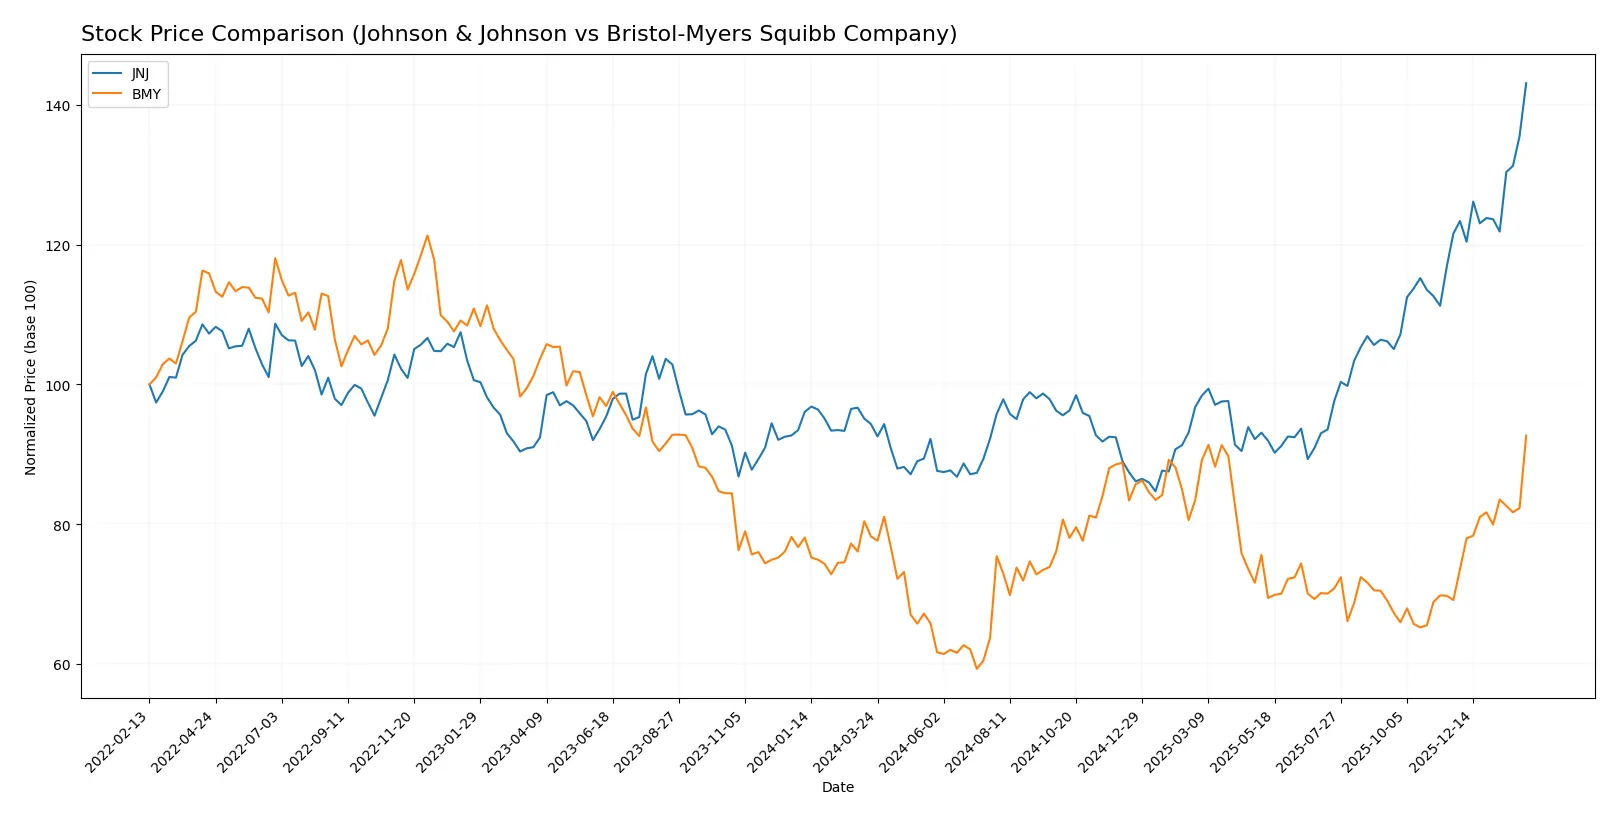
Trend Comparison
Johnson & Johnson’s stock gained 51.72% over the past year, showing a bullish trend with price acceleration and a high volatility level (21.25 std deviation). The price ranged between 142.06 and 239.99.
Bristol-Myers Squibb’s stock rose 18.44% over the same period, also bullish with accelerating gains but lower volatility (5.52 std deviation). Its price fluctuated between 39.66 and 61.99.
Johnson & Johnson outperformed Bristol-Myers Squibb by delivering the highest market return with stronger price gains and greater trading volume growth.
Target Prices
The current consensus targets suggest moderate upside potential for both Johnson & Johnson and Bristol-Myers Squibb.
| Company | Target Low | Target High | Consensus |
|---|---|---|---|
| Johnson & Johnson | 190 | 265 | 229.33 |
| Bristol-Myers Squibb | 40 | 72 | 60.11 |
Analysts expect Johnson & Johnson’s price to modestly exceed its current 240 USD, while Bristol-Myers Squibb’s consensus target aligns closely with its current 62 USD price.

Don’t Let Luck Decide Your Entry Point
Optimize your entry points with our advanced ProRealTime indicators. You’ll get efficient buy signals with precise price targets for maximum performance. Start outperforming now!
How do institutions grade them?
Johnson & Johnson Grades
Here are the latest institutional grades for Johnson & Johnson from reputable firms:
| Grading Company | Action | New Grade | Date |
|---|---|---|---|
| RBC Capital | maintain | Outperform | 2026-02-03 |
| Morgan Stanley | upgrade | Overweight | 2026-01-28 |
| Freedom Capital Markets | maintain | Hold | 2026-01-27 |
| Guggenheim | maintain | Buy | 2026-01-23 |
| TD Cowen | maintain | Buy | 2026-01-22 |
| Citigroup | maintain | Buy | 2026-01-22 |
| Scotiabank | maintain | Sector Outperform | 2026-01-22 |
| B of A Securities | maintain | Neutral | 2026-01-22 |
| Morgan Stanley | maintain | Equal Weight | 2026-01-22 |
| Stifel | maintain | Hold | 2026-01-22 |
Bristol-Myers Squibb Company Grades
Below are the recent institutional grades for Bristol-Myers Squibb from established grading companies:
| Grading Company | Action | New Grade | Date |
|---|---|---|---|
| Citigroup | maintain | Neutral | 2026-02-06 |
| Wells Fargo | maintain | Equal Weight | 2026-02-06 |
| Guggenheim | maintain | Buy | 2026-02-06 |
| Piper Sandler | maintain | Overweight | 2026-01-28 |
| Citigroup | maintain | Neutral | 2026-01-27 |
| Leerink Partners | maintain | Outperform | 2026-01-13 |
| Scotiabank | maintain | Sector Perform | 2026-01-09 |
| UBS | upgrade | Buy | 2026-01-07 |
| Citigroup | maintain | Neutral | 2026-01-07 |
| B of A Securities | upgrade | Buy | 2025-12-15 |
Which company has the best grades?
Johnson & Johnson holds a stronger consensus with multiple “Buy” and “Outperform” ratings and an upgrade to “Overweight” by Morgan Stanley. Bristol-Myers Squibb also receives positive grades but has more “Neutral” ratings. Investors might view Johnson & Johnson as having more robust institutional confidence currently.
Risks specific to each company
The following categories identify the critical pressure points and systemic threats facing both firms in the 2026 market environment:
1. Market & Competition
Johnson & Johnson
- Faces intense competition in pharmaceuticals and MedTech, especially after spinning off Consumer Health.
Bristol-Myers Squibb Company
- Competes heavily in biopharma oncology and immunology with a narrower product portfolio.
2. Capital Structure & Debt
Johnson & Johnson
- Maintains a strong balance sheet with favorable debt ratios and infinite interest coverage.
Bristol-Myers Squibb Company
- Shows favorable debt metrics but interest coverage is significantly lower, indicating higher financial risk.
3. Stock Volatility
Johnson & Johnson
- Exhibits low beta (0.347), indicating lower stock volatility versus market benchmarks.
Bristol-Myers Squibb Company
- Even lower beta (0.295) suggests very stable stock price fluctuations amid market changes.
4. Regulatory & Legal
Johnson & Johnson
- Subject to complex regulations globally, especially in pharmaceuticals and medical devices sectors.
Bristol-Myers Squibb Company
- Exposed to regulatory risks primarily in drug approvals and patent expirations in biopharma.
5. Supply Chain & Operations
Johnson & Johnson
- Large, diversified supply chain with potential operational inefficiencies flagged by low asset turnover ratios.
Bristol-Myers Squibb Company
- Faces operational challenges with lower asset efficiency but smaller scale may allow quicker adaptation.
6. ESG & Climate Transition
Johnson & Johnson
- Increasing ESG pressures due to diversified global footprint; must address sustainability in MedTech and pharma.
Bristol-Myers Squibb Company
- Faces growing ESG expectations, particularly in environmental impact and access to medicines.
7. Geopolitical Exposure
Johnson & Johnson
- Broad global operations expose it to geopolitical risks including trade tensions and regulatory divergence.
Bristol-Myers Squibb Company
- Also globally diversified but with less geographic spread, somewhat limiting geopolitical risk exposure.
Which company shows a better risk-adjusted profile?
Bristol-Myers Squibb’s primary risk lies in its capital structure, with lower interest coverage signaling higher financial leverage. Johnson & Johnson faces operational inefficiencies, notably poor asset turnover. BMY’s stronger Altman Z-score and financial scores suggest a better risk-adjusted profile. However, JNJ’s balance sheet strength and market stability remain compelling despite operational red flags. The recent spin-off of JNJ’s Consumer Health business intensifies its operational risk but sharpens its innovation focus, a key trend to watch.
Final Verdict: Which stock to choose?
Johnson & Johnson’s superpower lies in its robust cash generation and resilient profit margins, enabling steady reinvestment into innovation. Its main point of vigilance is the declining ROIC trend, signaling potential challenges in capital efficiency. It suits portfolios targeting long-term stability with moderate growth.
Bristol-Myers Squibb offers a strategic moat rooted in focused R&D and a growing free cash flow yield, supporting dividend strength and operational safety. Compared to Johnson & Johnson, it presents a more attractive valuation and higher recent price momentum, fitting well in GARP portfolios seeking balanced growth and income.
If you prioritize capital efficiency and a proven ability to sustain profits, Johnson & Johnson is the compelling choice due to its strong income statement and scale. However, if you seek a blend of growth potential with better valuation and dividend yield, Bristol-Myers Squibb offers better stability and upside in a moderately volatile environment.
Disclaimer: Investment carries a risk of loss of initial capital. The past performance is not a reliable indicator of future results. Be sure to understand risks before making an investment decision.
Go Further
I encourage you to read the complete analyses of Johnson & Johnson and Bristol-Myers Squibb Company to enhance your investment decisions: