Home > Comparison > Healthcare > GILD vs BMY
The strategic rivalry between Gilead Sciences, Inc. and Bristol-Myers Squibb Company shapes the healthcare sector’s competitive landscape. Gilead operates as a focused biopharmaceutical innovator with a lean workforce, while Bristol-Myers Squibb stands as a diversified drug manufacturer with a broader therapeutic scope and larger scale. This analysis pits growth specialization against diversified resilience, aiming to identify which trajectory delivers superior risk-adjusted returns for a balanced portfolio in 2026.
Table of contents
Companies Overview
Gilead Sciences and Bristol-Myers Squibb both command significant influence in the global pharmaceutical sector.
Gilead Sciences, Inc.: Pioneer in Antiviral and Cell Therapy
Gilead Sciences dominates as a biopharmaceutical leader, earning most revenue from HIV/AIDS and liver disease treatments. Its strategic focus in 2026 centers on advancing cell therapies and expanding its antiviral portfolio. The company leverages strong collaboration agreements to enhance its drug pipeline and sustain competitive advantage.
Bristol-Myers Squibb Company: Broad-Spectrum Biopharmaceutical Innovator
Bristol-Myers Squibb stands out with a diversified product lineup spanning oncology, cardiovascular, and immunology. Its core revenue derives from oral immunomodulatory and cancer therapies. In 2026, the firm prioritizes expanding immuno-oncology and autoimmune franchises while integrating recent acquisitions to deepen market penetration.
Strategic Collision: Similarities & Divergences
Both companies thrive on innovation but diverge in scope: Gilead focuses on specialized antiviral and cell therapies, while Bristol-Myers pursues broad disease categories. Their primary battleground is oncology, where targeted therapies shape future growth. Investors face distinct profiles: Gilead offers concentrated niche leadership, Bristol-Myers provides diversification with steady pipeline expansion.
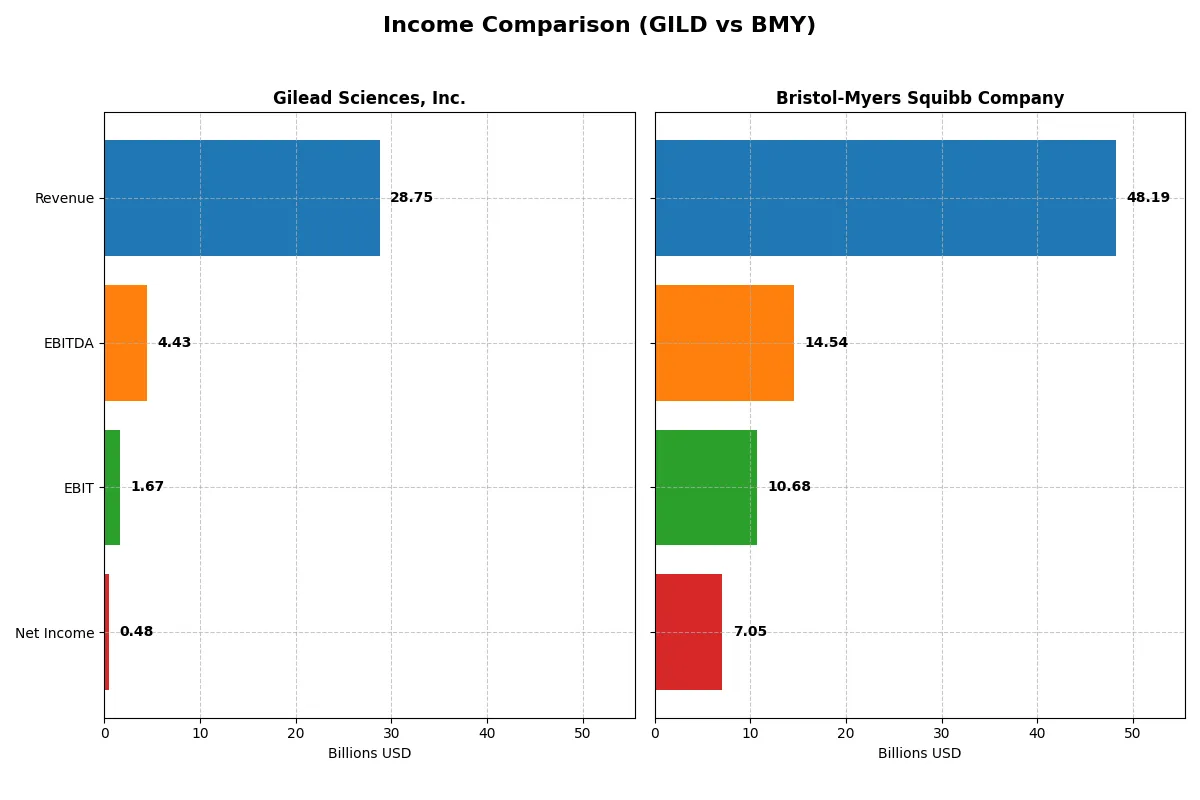
Income Statement Comparison
This data dissects the core profitability and scalability of both corporate engines to reveal who dominates the bottom line:
| Metric | Gilead Sciences, Inc. (GILD) | Bristol-Myers Squibb Company (BMY) |
|---|---|---|
| Revenue | 28.8B | 48.2B |
| Cost of Revenue | 6.3B | 15.6B |
| Operating Expenses | 20.8B | 19.9B |
| Gross Profit | 22.5B | 32.6B |
| EBITDA | 4.4B | 14.5B |
| EBIT | 1.7B | 10.7B |
| Interest Expense | 977M | 1.5B |
| Net Income | 480M | 7.1B |
| EPS | 0.38 | 3.46 |
| Fiscal Year | 2024 | 2025 |
Income Statement Analysis: The Bottom-Line Duel
This income statement comparison exposes the true operational efficiency and profitability of two major biotech giants over recent years.
Gilead Sciences, Inc. Analysis
Gilead’s revenue climbed steadily from 24.7B in 2020 to 28.8B in 2024, with net income surging from 123M to 480M last year, despite a sharp dip from prior peaks. Its gross margin remains strong at 78%, but net margin compressed to 1.7%, reflecting rising expenses and declining EBIT. The recent year shows a slowdown in profitability momentum.
Bristol-Myers Squibb Company Analysis
Bristol-Myers Squibb reported revenues near 48B in 2025, stable but slightly down from the previous year. Net income recovered robustly to 7.05B after a sharp loss in 2024. Gross margin stands at a solid 67.6%, with a notably higher EBIT margin of 22%, showcasing better operational leverage. The company regained strong profitability and margin expansion in the latest fiscal year.
Margin Resilience vs. Profit Recovery
Gilead delivers higher gross margins but struggles with net profitability and recent margin contraction. Bristol-Myers shows superior EBIT and net margins, recovering sharply from a one-year loss with strong profit growth. For investors, Bristol-Myers’ profile offers more attractive bottom-line stability and operational efficiency compared to Gilead’s uneven income trajectory.
Financial Ratios Comparison
These vital ratios act as a diagnostic tool to expose the underlying fiscal health, valuation premiums, and capital efficiency of the companies compared below:
| Ratios | Gilead Sciences, Inc. (GILD) | Bristol-Myers Squibb Company (BMY) |
|---|---|---|
| ROE | 2.48% | 0% (2025) |
| ROIC | 2.36% | 0% (2025) |
| P/E | 240.0x | 15.6x (2025) |
| P/B | 5.96x | 0 (2025) |
| Current Ratio | 1.60 | 0 (2025) |
| Quick Ratio | 1.45 | 0 (2025) |
| D/E | 1.38 | 0 (2025) |
| Debt-to-Assets | 45.3% | 0 (2025) |
| Interest Coverage | 1.70 | 4.93 (2025) |
| Asset Turnover | 0.49 | 0 (2025) |
| Fixed Asset Turnover | 5.31 | 0 (2025) |
| Payout Ratio | 8.16% | 71.5% (2025) |
| Dividend Yield | 3.40% | 4.60% (2025) |
| Fiscal Year | 2024 | 2025 |
Efficiency & Valuation Duel: The Vital Signs
Financial ratios act as the company’s DNA, uncovering hidden risks and operational excellence beyond surface financial statements.
Gilead Sciences, Inc.
Gilead’s profitability shows strain with a low ROE of 2.48% and a razor-thin net margin of 1.67%, signaling operational challenges. Its P/E ratio is stretched at 240x, reflecting expensive valuation. The company supports shareholders through a 3.4% dividend yield, balancing modest returns with sustained R&D investment at 20.5% of revenue.
Bristol-Myers Squibb Company
Bristol-Myers posts a robust net margin of 14.64%, but zero reported ROE and ROIC metrics cloud profitability insights. The stock trades at a reasonable P/E of 15.55, suggesting fair valuation. It delivers a healthy 4.6% dividend yield, emphasizing shareholder returns amid ongoing R&D spending near 20.6% of revenue, aiming for growth.
Premium Valuation vs. Operational Stability
Gilead’s high valuation contrasts with weak profitability metrics, raising risk concerns. Bristol-Myers offers stronger margins and a better dividend yield, presenting a more balanced risk-reward profile. Investors favoring yield and stable operations may lean toward Bristol-Myers, while those betting on growth might scrutinize Gilead’s stretched valuation carefully.
Which one offers the Superior Shareholder Reward?
I observe that in 2026, Bristol-Myers Squibb (BMY) delivers a higher dividend yield of 4.60% versus Gilead Sciences’ (GILD) 3.40%. BMY sustains a payout ratio around 71.5%, slightly higher than GILD’s conservative 8.2%. However, GILD’s free cash flow coverage of dividends exceeds 240%, signaling a robust distribution safety. GILD aggressively supports buybacks, enhancing total return, while BMY appears more dividend-focused with less recent buyback emphasis. Historically, GILD’s buybacks complement its dividend, fostering durable shareholder value. I conclude GILD offers a superior total return profile due to balanced dividends and intense buybacks, making it more sustainable for long-term investors in 2026.
Comparative Score Analysis: The Strategic Profile
The radar chart reveals the fundamental DNA and trade-offs of Gilead Sciences and Bristol-Myers Squibb, highlighting their core financial strengths and vulnerabilities:
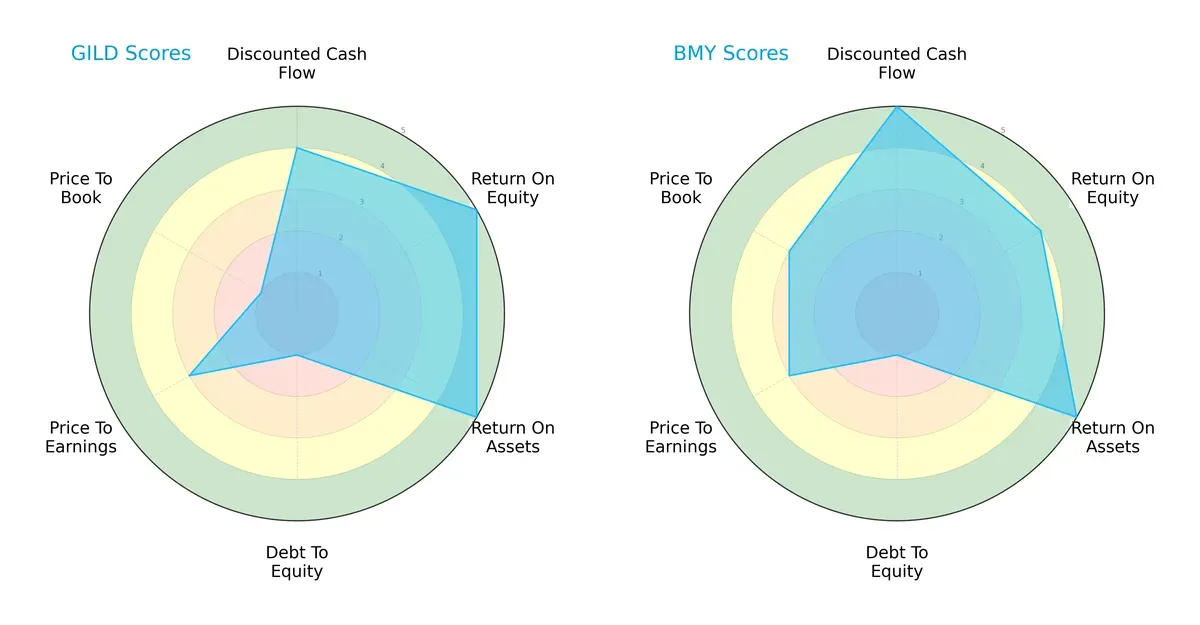
Gilead excels in return metrics with very favorable ROE and ROA scores of 5 each, signaling efficient profit generation and asset use. Bristol-Myers Squibb shows a more balanced profile, scoring higher overall (4 vs. 3) and topping Gilead in discounted cash flow with a 5 versus 4. Both struggle with debt-to-equity (score 1), signaling elevated leverage risk. Valuation metrics favor Bristol-Myers on price-to-book (3 vs. 1), suggesting Gilead may face market skepticism on asset value.
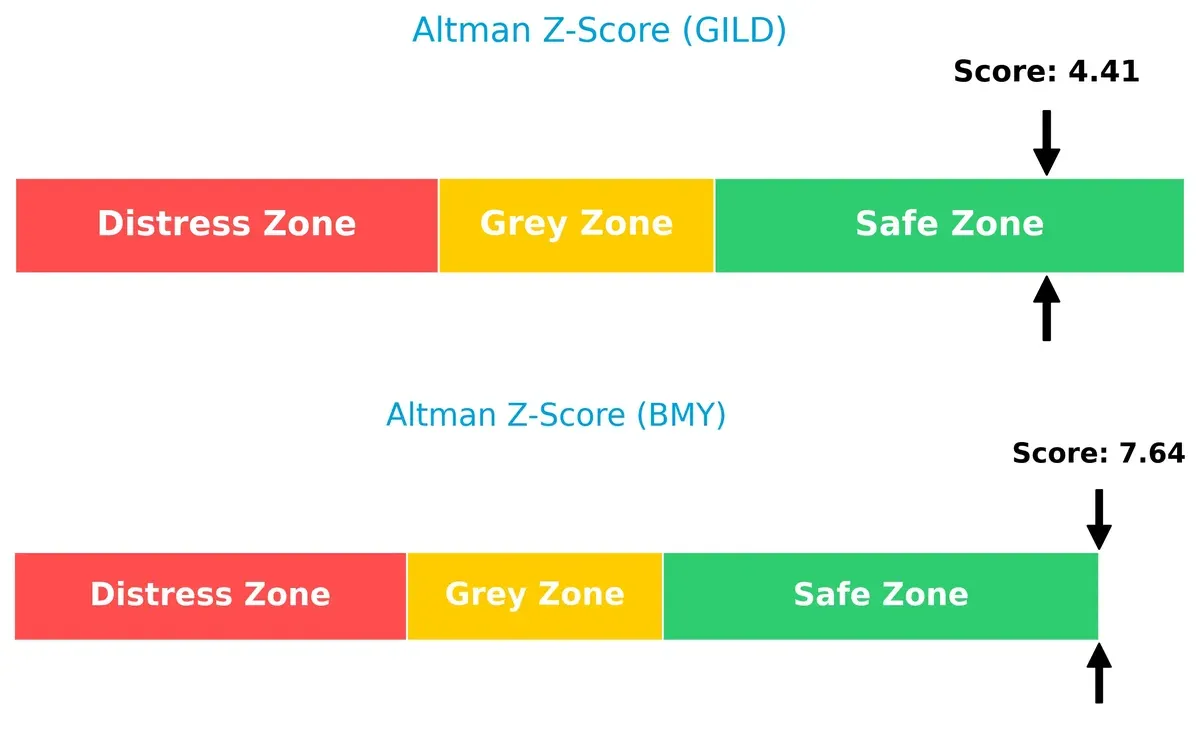
Bankruptcy Risk: Solvency Showdown
The Altman Z-Score gap between Gilead (4.41) and Bristol-Myers (7.64) signals both firms occupy the safe zone, but Bristol-Myers has a stronger margin against financial distress in this cycle:
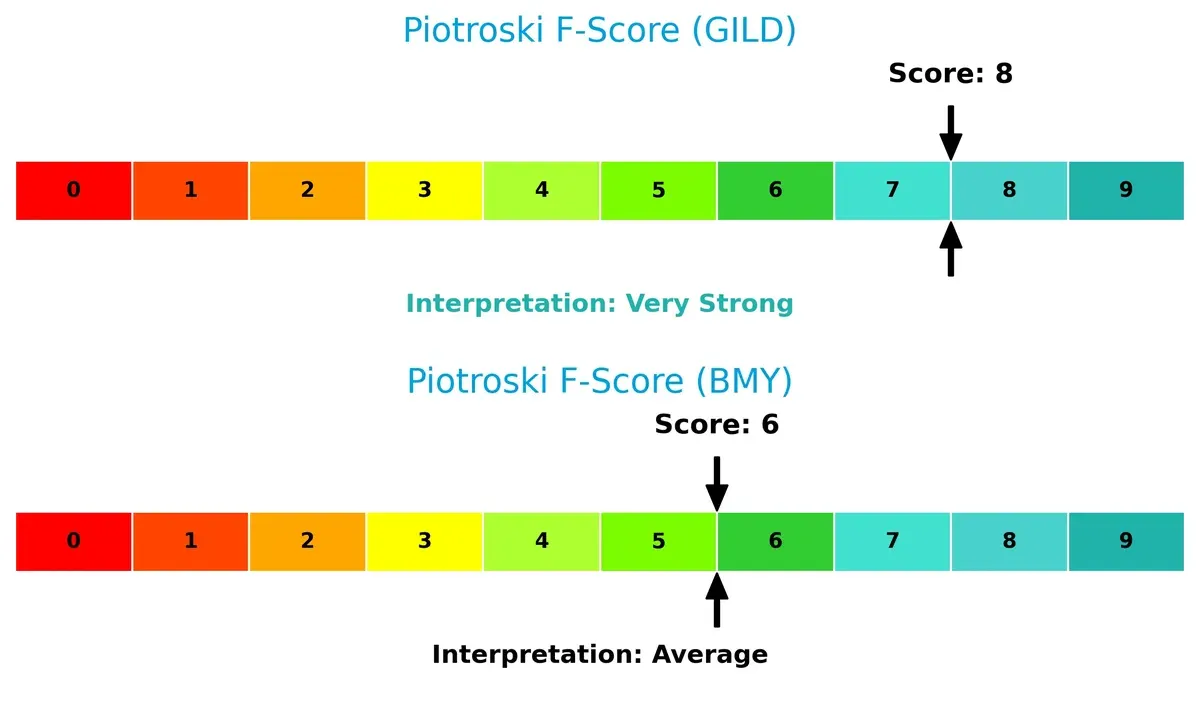
Financial Health: Quality of Operations
Gilead’s Piotroski F-Score of 8 indicates very strong operational health compared to Bristol-Myers’ 6, which is average and signals some red flags in internal financial metrics:
How are the two companies positioned?
This section dissects GILD and BMY’s operational DNA by comparing their revenue distribution and internal dynamics. The objective: confront their economic moats to reveal the most resilient competitive advantage today.
Revenue Segmentation: The Strategic Mix
This visual comparison dissects how Gilead Sciences, Inc. and Bristol-Myers Squibb Company diversify their income streams and where their primary sector bets lie:
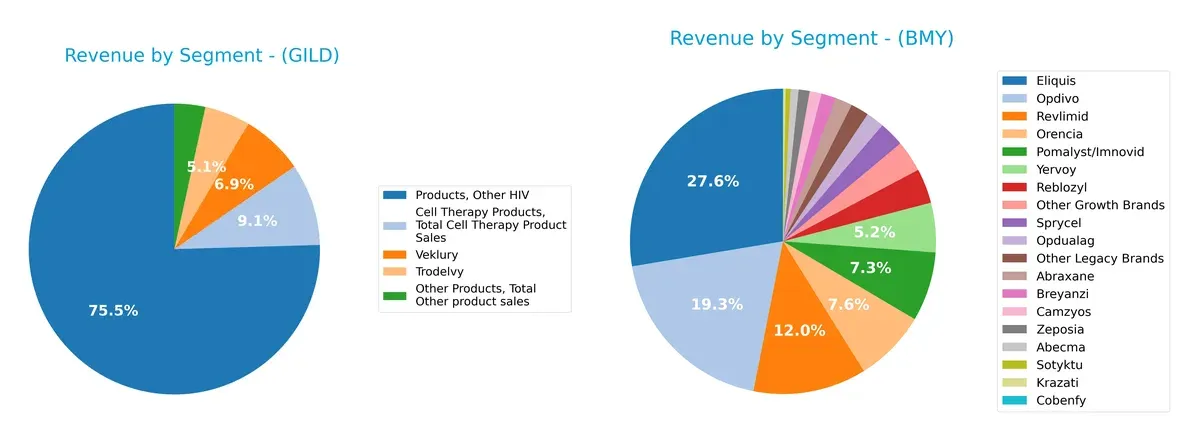
Gilead anchors its revenue heavily in “Other HIV” products at $19.6B, with cell therapy and Veklury trailing far behind. Bristol-Myers Squibb shows a more balanced mix, with Eliquis dominating at $13.3B, but multiple other strong contributors like Opdivo ($9.3B) and Revlimid ($5.8B). Gilead’s concentration signals dependence on HIV therapies, posing concentration risk. BMY’s diversification across oncology, immunology, and cardiovascular drugs suggests an ecosystem lock-in and broader resilience.
Strengths and Weaknesses Comparison
This table compares the Strengths and Weaknesses of Gilead Sciences, Inc. and Bristol-Myers Squibb Company:
GILD Strengths
- Diverse antiviral and cell therapy product portfolio
- Solid global presence with strong U.S. and European sales
- Favorable liquidity ratios with current and quick ratios above 1
BMY Strengths
- Broad product range across oncology and immunology
- Strong U.S. and global revenue base with notable market share in key drugs
- Favorable debt and interest coverage ratios supporting financial stability
GILD Weaknesses
- Low profitability with unfavorable net margin, ROE, and ROIC
- High valuation multiples with elevated P/E and P/B ratios
- Weak debt management and interest coverage ratios
BMY Weaknesses
- Zero reported ROE and ROIC indicating profitability challenges
- Unfavorable liquidity ratios with zero current and quick ratios reported
- Limited data on WACC and asset turnover ratios
Both companies demonstrate strong global presence and diversified portfolios, yet GILD faces profitability and valuation pressures. BMY shows financial stability but lacks profitability metrics and liquidity strength, implying strategic focus areas differ.
The Moat Duel: Analyzing Competitive Defensibility
A structural moat protects long-term profits from relentless competitive erosion. Without it, market advantages quickly vanish:
Gilead Sciences, Inc.: Innovation-Driven Intangible Assets
Gilead’s moat stems from patented biopharmaceutical innovations, reflected in a strong gross margin of 78%. Despite a slightly unfavorable ROIC vs. WACC, its growing profitability signals expanding value through new therapies in oncology and antivirals.
Bristol-Myers Squibb Company: Diversified Product Portfolio and Scale
Bristol-Myers leverages a broad, diversified drug portfolio generating a robust 22% EBIT margin, contrasting Gilead’s narrower focus. However, its declining ROIC trend hints at future margin pressure despite recent strong earnings growth.
Patents vs. Portfolio Breadth: Who Defends Better?
Gilead’s innovation moat is narrower but deepening with pipeline advances. Bristol-Myers’ wider portfolio offers scale but faces efficiency erosion. I see Gilead as better positioned to sustain market share amid intensifying competition.
Which stock offers better returns?
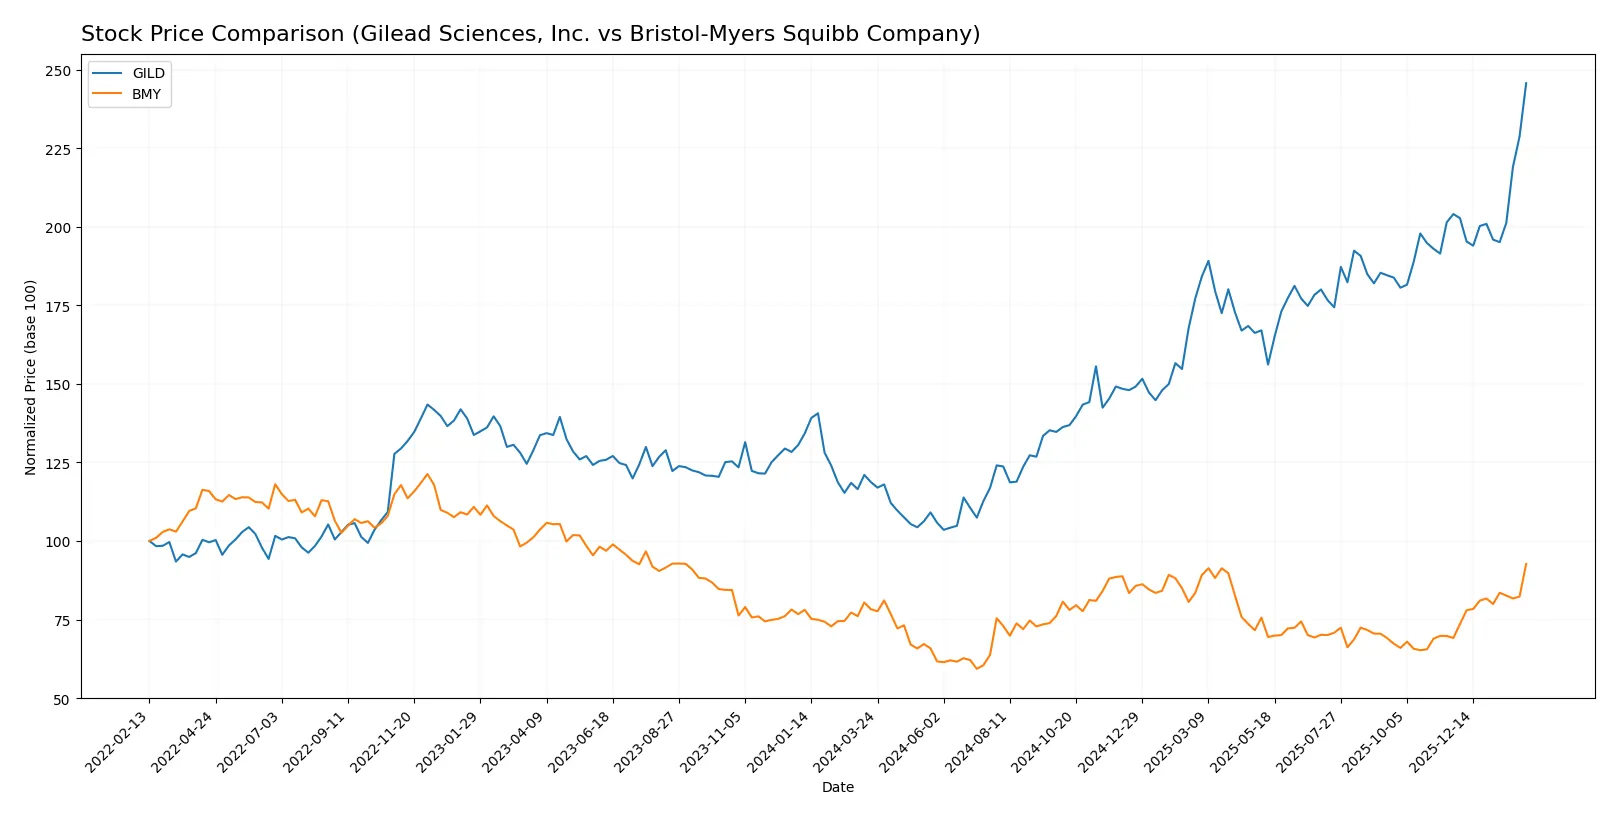
Over the past 12 months, both stocks showed upward price momentum, with Gilead Sciences accelerating sharply and Bristol-Myers Squibb posting steady gains amid shifting trading volumes.
Trend Comparison
Gilead Sciences, Inc. (GILD) experienced a 107% price increase over the past year, signaling a strong bullish trend with notable acceleration and a high volatility level (20.82 std deviation). Its price ranged from 64.27 to 152.5.
Bristol-Myers Squibb Company (BMY) recorded an 18.44% price rise, also bullish with acceleration but lower volatility (5.52 std deviation). The price fluctuated between 39.66 and 61.99 during the same period.
Comparing both, Gilead Sciences delivered the highest market performance with a more pronounced upward trend and larger price appreciation than Bristol-Myers Squibb.
Target Prices
Analysts present a mixed target consensus for these healthcare giants, reflecting cautious optimism amid sector challenges.
| Company | Target Low | Target High | Consensus |
|---|---|---|---|
| Gilead Sciences, Inc. | 105 | 155 | 137.38 |
| Bristol-Myers Squibb Company | 40 | 72 | 60.11 |
Gilead’s consensus sits slightly below its current price of 152.5, signaling limited upside. Bristol-Myers Squibb’s target aligns closely with its 61.99 market price, implying a stable outlook.

Don’t Let Luck Decide Your Entry Point
Optimize your entry points with our advanced ProRealTime indicators. You’ll get efficient buy signals with precise price targets for maximum performance. Start outperforming now!
How do institutions grade them?
This section compares the recent grades assigned to Gilead Sciences, Inc. and Bristol-Myers Squibb Company by major financial institutions:
Gilead Sciences, Inc. Grades
The table below summarizes Gilead Sciences’ most recent institutional grades and actions:
| Grading Company | Action | New Grade | Date |
|---|---|---|---|
| Citigroup | Maintain | Buy | 2026-01-27 |
| Truist Securities | Maintain | Buy | 2026-01-27 |
| UBS | Maintain | Buy | 2026-01-26 |
| Morgan Stanley | Maintain | Overweight | 2026-01-13 |
| Citigroup | Maintain | Buy | 2026-01-07 |
| Morgan Stanley | Maintain | Overweight | 2025-12-12 |
| Wells Fargo | Maintain | Overweight | 2025-12-10 |
| Needham | Maintain | Buy | 2025-11-13 |
| Truist Securities | Maintain | Buy | 2025-11-03 |
| Needham | Maintain | Buy | 2025-10-31 |
Bristol-Myers Squibb Company Grades
The table below summarizes Bristol-Myers Squibb’s latest institutional grades and changes:
| Grading Company | Action | New Grade | Date |
|---|---|---|---|
| Citigroup | Maintain | Neutral | 2026-02-06 |
| Wells Fargo | Maintain | Equal Weight | 2026-02-06 |
| Guggenheim | Maintain | Buy | 2026-02-06 |
| Piper Sandler | Maintain | Overweight | 2026-01-28 |
| Citigroup | Maintain | Neutral | 2026-01-27 |
| Leerink Partners | Maintain | Outperform | 2026-01-13 |
| Scotiabank | Maintain | Sector Perform | 2026-01-09 |
| UBS | Upgrade | Buy | 2026-01-07 |
| Citigroup | Maintain | Neutral | 2026-01-07 |
| B of A Securities | Upgrade | Buy | 2025-12-15 |
Which company has the best grades?
Gilead Sciences holds consistently strong Buy and Overweight grades from multiple institutions. Bristol-Myers Squibb shows more varied ratings, including Neutral and Equal Weight, although some upgrades to Buy exist. Investors may view Gilead’s steadier positive consensus as a stronger signal of confidence.
Risks specific to each company
The following categories identify critical pressure points and systemic threats facing Gilead Sciences, Inc. and Bristol-Myers Squibb Company in the 2026 market environment:
1. Market & Competition
Gilead Sciences, Inc.
- Faces pressure from patent cliffs and generic competition in HIV drugs.
Bristol-Myers Squibb Company
- Strong oncology portfolio but intense competition in immunology and hematology.
2. Capital Structure & Debt
Gilead Sciences, Inc.
- High debt-to-equity ratio (1.38) raises financial risk and interest burden.
Bristol-Myers Squibb Company
- Low debt usage signals financial prudence and stronger balance sheet stability.
3. Stock Volatility
Gilead Sciences, Inc.
- Beta of 0.387 implies relatively low market volatility and defensive characteristics.
Bristol-Myers Squibb Company
- Even lower beta of 0.295 indicates very stable stock price behavior.
4. Regulatory & Legal
Gilead Sciences, Inc.
- Risks from drug approvals and patent litigations in multiple jurisdictions.
Bristol-Myers Squibb Company
- Subject to regulatory scrutiny, especially around new oncology drug approvals.
5. Supply Chain & Operations
Gilead Sciences, Inc.
- Complex global supply chain with exposure to biotech collaborations and manufacturing risks.
Bristol-Myers Squibb Company
- Large operational footprint with potential vulnerabilities in raw material sourcing.
6. ESG & Climate Transition
Gilead Sciences, Inc.
- Increasing pressure to improve ESG disclosures and reduce carbon footprint.
Bristol-Myers Squibb Company
- Stronger ESG initiatives but ongoing challenges in climate-related transition risks.
7. Geopolitical Exposure
Gilead Sciences, Inc.
- Diverse international operations expose it to trade tensions and regulatory shifts.
Bristol-Myers Squibb Company
- Global presence also subjects it to geopolitical uncertainty, especially in emerging markets.
Which company shows a better risk-adjusted profile?
Gilead’s most impactful risk is its heavy debt load undermining financial flexibility. Bristol-Myers faces intense market competition in immuno-oncology. I see Bristol-Myers offering a better risk-adjusted profile, supported by its lower debt and stronger Altman Z-score of 7.64 versus Gilead’s 4.41, indicating superior financial stability and resilience.
Final Verdict: Which stock to choose?
Gilead Sciences, Inc. (GILD) wields a superpower in its accelerating revenue growth and improving profitability trends despite currently destroying value on invested capital. Its robust cash flow generation and efficient asset use make it a potential fit for aggressive growth portfolios willing to tolerate operational headwinds. The key point of vigilance remains its lingering low returns relative to capital cost.
Bristol-Myers Squibb Company (BMY) benefits from a strong strategic moat rooted in its consistent EBITDA margins and recurring revenue streams, offering greater financial stability compared to Gilead. Its solid dividend yield and favorable valuation metrics align well with growth at a reasonable price (GARP) investors seeking steadier income and less volatility.
If you prioritize aggressive growth and can absorb short-term value erosion, Gilead outshines with its upward momentum and improving profitability. However, if you seek better stability combined with consistent cash generation and dividend income, Bristol-Myers Squibb offers a safer harbor with a more defensive profile. Both present distinct analytical scenarios depending on your risk tolerance and investment horizon.
Disclaimer: Investment carries a risk of loss of initial capital. The past performance is not a reliable indicator of future results. Be sure to understand risks before making an investment decision.
Go Further
I encourage you to read the complete analyses of Gilead Sciences, Inc. and Bristol-Myers Squibb Company to enhance your investment decisions: