Home > Comparison > Healthcare > LLY vs BMY
The strategic rivalry between Eli Lilly and Company and Bristol-Myers Squibb defines the competitive landscape in healthcare’s drug manufacturing sector. Eli Lilly operates as a broad-based pharmaceutical innovator with a diverse portfolio, while Bristol-Myers focuses on specialized biopharmaceuticals targeting oncology and immunology. This head-to-head pits scale and innovation against targeted therapeutic depth. This analysis will reveal which path offers a superior risk-adjusted profile for a diversified investor portfolio.
Table of contents
Companies Overview
Eli Lilly and Bristol-Myers Squibb both wield significant influence in the global pharmaceutical arena.
Eli Lilly and Company: Innovator in Human Pharmaceuticals
Eli Lilly dominates as a leading drug manufacturer, generating revenue primarily through human pharmaceuticals. Its portfolio includes diabetes treatments like Humalog and Trulicity, oncology drugs such as Alimta, and immunology therapies like Taltz. In 2026, its strategic focus emphasizes expanding innovative biologics and strengthening collaborations with biotech firms to sustain growth.
Bristol-Myers Squibb Company: Biopharma Powerhouse
Bristol-Myers Squibb commands a strong market position as a biopharmaceutical developer with diverse treatments in oncology, immunology, and cardiovascular diseases. Its revenue stems from flagship drugs like Revlimid and Opdivo, supported by a broad pipeline. The 2026 strategy centers on advancing cell therapies and immuno-oncology to capture emerging therapeutic areas.
Strategic Collision: Similarities & Divergences
Both companies prioritize innovative pharmaceuticals but diverge in their core approaches: Eli Lilly focuses on diabetes and biologics, while Bristol-Myers pursues immuno-oncology and cell therapy. They compete intensely in oncology, a battleground for market share and clinical breakthroughs. Their distinct pipelines and therapeutic emphases define differentiated investment profiles within the healthcare sector.
Income Statement Comparison
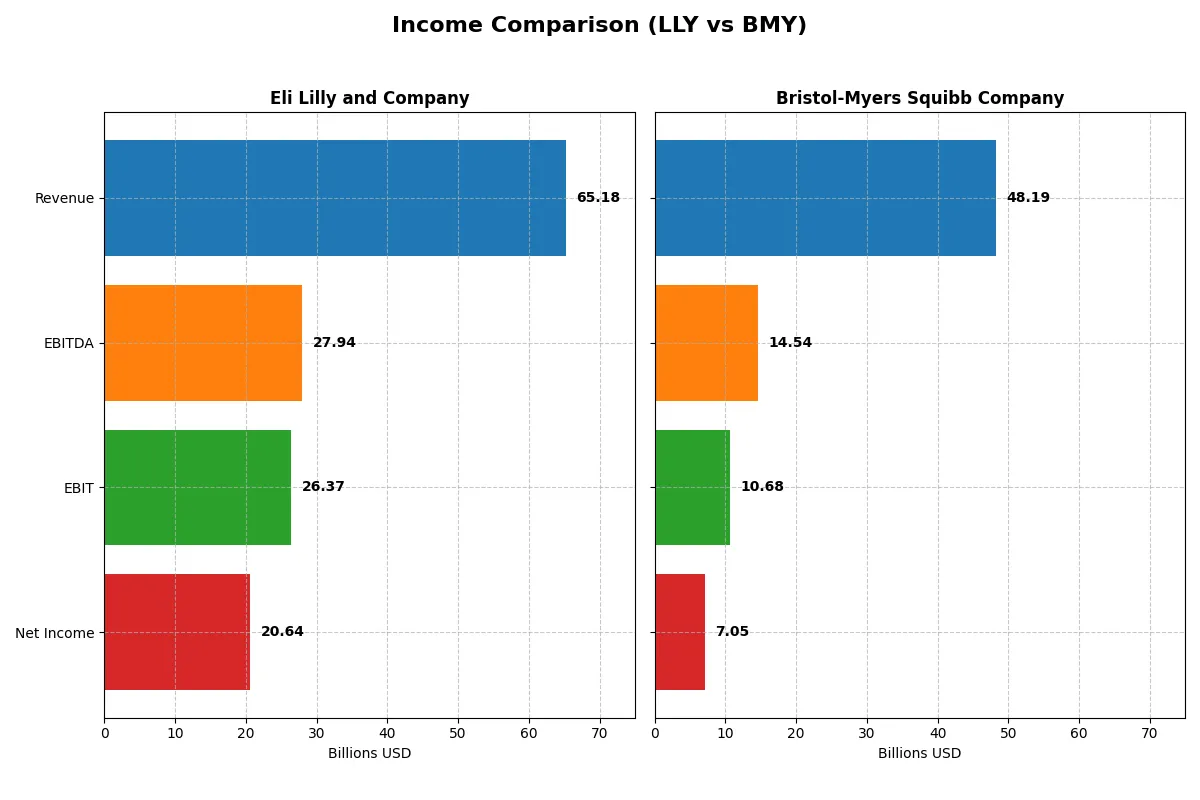
This data dissects the core profitability and scalability of both corporate engines to reveal who dominates the bottom line:
| Metric | Eli Lilly and Company (LLY) | Bristol-Myers Squibb Company (BMY) |
|---|---|---|
| Revenue | 65.2B | 48.2B |
| Cost of Revenue | 10.6B | 15.6B |
| Operating Expenses | 24.9B | 19.9B |
| Gross Profit | 54.6B | 32.6B |
| EBITDA | 27.9B | 14.5B |
| EBIT | 26.4B | 10.7B |
| Interest Expense | 0.8B | 1.5B |
| Net Income | 20.6B | 7.1B |
| EPS | 15.59 | 3.46 |
| Fiscal Year | 2025 | 2025 |
Income Statement Analysis: The Bottom-Line Duel
This income statement comparison reveals which company runs a more efficient and profitable financial engine through recent market cycles.
Eli Lilly and Company Analysis
Eli Lilly’s revenue surged from 28B in 2021 to 65B in 2025, with net income nearly quadrupling from 5.6B to 20.6B. Its gross margin impresses at 83.8%, with a net margin of 31.7%, both showing strong expansion. In 2025, Lilly’s operating efficiency intensified, evidenced by a 95.9% EBIT growth and EPS doubling, signaling robust momentum.
Bristol-Myers Squibb Company Analysis
Bristol-Myers Squibb’s revenue held steady around 46-48B from 2021 to 2025, while net income remained flat near 7B, dipping into negative territory in 2024. Its gross margin stands at 67.7%, and net margin at 14.6%, reflecting thinner profitability. Despite a 266% EBIT spike in 2025, overall growth is muted, with revenue and net income showing minimal progress over five years.
Margin Dominance vs. Revenue Resilience
Eli Lilly dominates with superior margin expansion and explosive earnings growth, while Bristol-Myers Squibb shows revenue stability but struggles with profitability. Lilly’s high-margin business and strong EPS momentum mark it as the fundamental winner. Investors favor a profile combining scalable revenue with expanding margins over stagnant earnings.
Financial Ratios Comparison
These vital ratios act as a diagnostic tool to expose the underlying fiscal health, valuation premiums, and capital efficiency of each company:
| Ratios | Eli Lilly and Company (LLY) | Bristol-Myers Squibb Company (BMY) |
|---|---|---|
| ROE | 74.6% | — |
| ROIC | 26.4% | 13.6% |
| P/E | 46.8 | 15.6 |
| P/B | 49.0 | 7.0 |
| Current Ratio | 1.15 | 1.25 |
| Quick Ratio | 0.89 | 1.15 |
| D/E | 2.37 | — |
| Debt-to-Assets | 42.7% | — |
| Interest Coverage | 37.3 | 4.93 |
| Asset Turnover | — | — |
| Fixed Asset Turnover | — | — |
| Payout ratio | 26.1% | 71.5% |
| Dividend yield | 0.56% | 4.60% |
| Fiscal Year | 2025 | 2025 |
Efficiency & Valuation Duel: The Vital Signs
Financial ratios act as a company’s DNA, unveiling hidden risks and operational excellence that shape investor decisions.
Eli Lilly and Company
Eli Lilly exhibits a strong net margin of 31.66%, signaling efficient profitability, but its P/E ratio of 46.76 suggests a stretched valuation. Despite favorable debt metrics and interest coverage, the absence of reported ROE and ROIC flags potential weakness. Its modest 0.56% dividend yield indicates limited shareholder returns, likely favoring reinvestment in growth or R&D.
Bristol-Myers Squibb Company
Bristol-Myers posts a moderate net margin of 14.64%, reflecting decent profitability with a reasonable P/E of 15.55, marking a neutral valuation stance. The company provides a robust 4.6% dividend yield, enhancing shareholder income. However, like Eli Lilly, missing ROE and ROIC data make efficiency assessment difficult, though debt and interest coverage remain favorable.
Premium Valuation vs. Balanced Yield
Eli Lilly’s high margin and stretched valuation contrast with Bristol-Myers’ moderate profitability and attractive dividend. Bristol-Myers offers a steadier risk-reward balance for income-focused investors. Eli Lilly suits those prioritizing growth potential over immediate returns.
Which one offers the Superior Shareholder Reward?
I compare Eli Lilly and Company (LLY) and Bristol-Myers Squibb Company (BMY) on dividends and buybacks. LLY yields 0.56% with a 26% payout ratio, indicating prudent dividend coverage by free cash flow. BMY offers a much higher 4.6% yield but pays out 72% of earnings, signaling less cushion. Both run significant buyback programs, but LLY’s free cash flow coverage and lower payout ratio suggest more sustainable returns. BMY’s higher yield suits income seekers but risks dividend cuts if earnings falter. I conclude LLY provides a superior total return profile in 2026 through balanced income and capital return.
Comparative Score Analysis: The Strategic Profile
The radar chart reveals the fundamental DNA and trade-offs of Eli Lilly and Company versus Bristol-Myers Squibb Company:
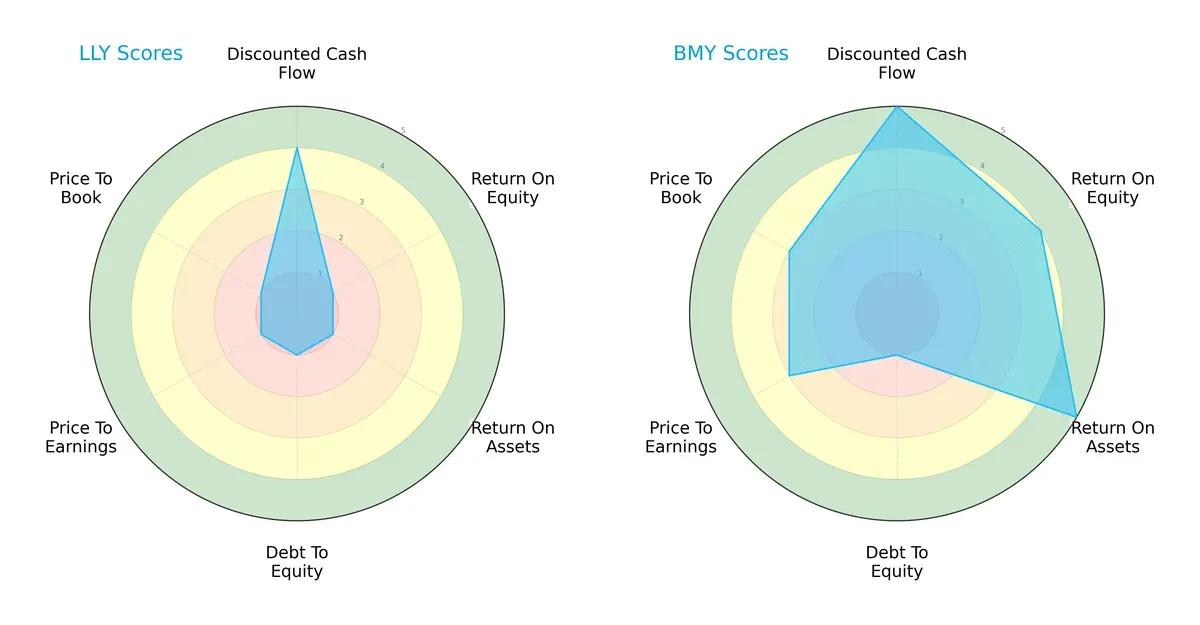
Bristol-Myers Squibb (BMY) dominates across DCF (5 vs. 4), ROE (4 vs. 1), and ROA (5 vs. 1), signaling superior profitability and asset efficiency. Both firms share weak debt-to-equity scores (1), exposing balance sheet risks. Eli Lilly (LLY) suffers valuation challenges with poor P/E and P/B scores (1 vs. BMY’s 3). BMY presents a more balanced, robust financial profile, while LLY relies heavily on discounted cash flow potential.
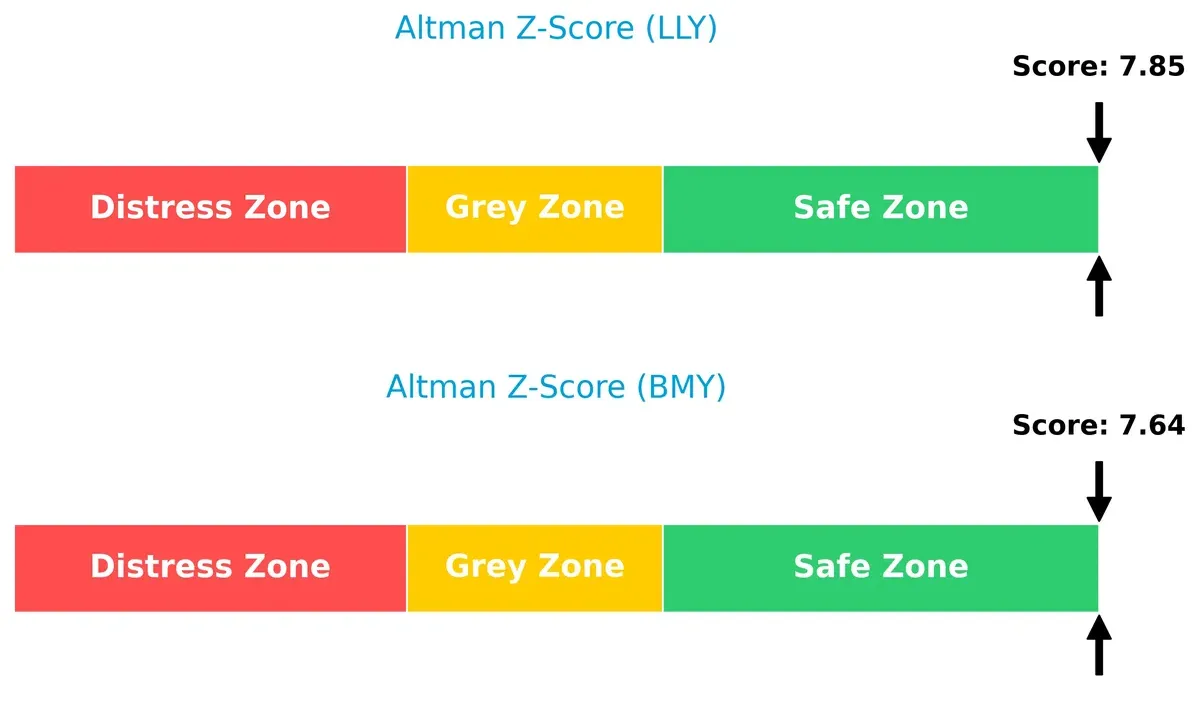
Bankruptcy Risk: Solvency Showdown
The Altman Z-Scores place both firms securely in the safe zone, with Eli Lilly slightly ahead at 7.85 versus Bristol-Myers’ 7.64, indicating strong long-term solvency and low bankruptcy risk in this cycle:
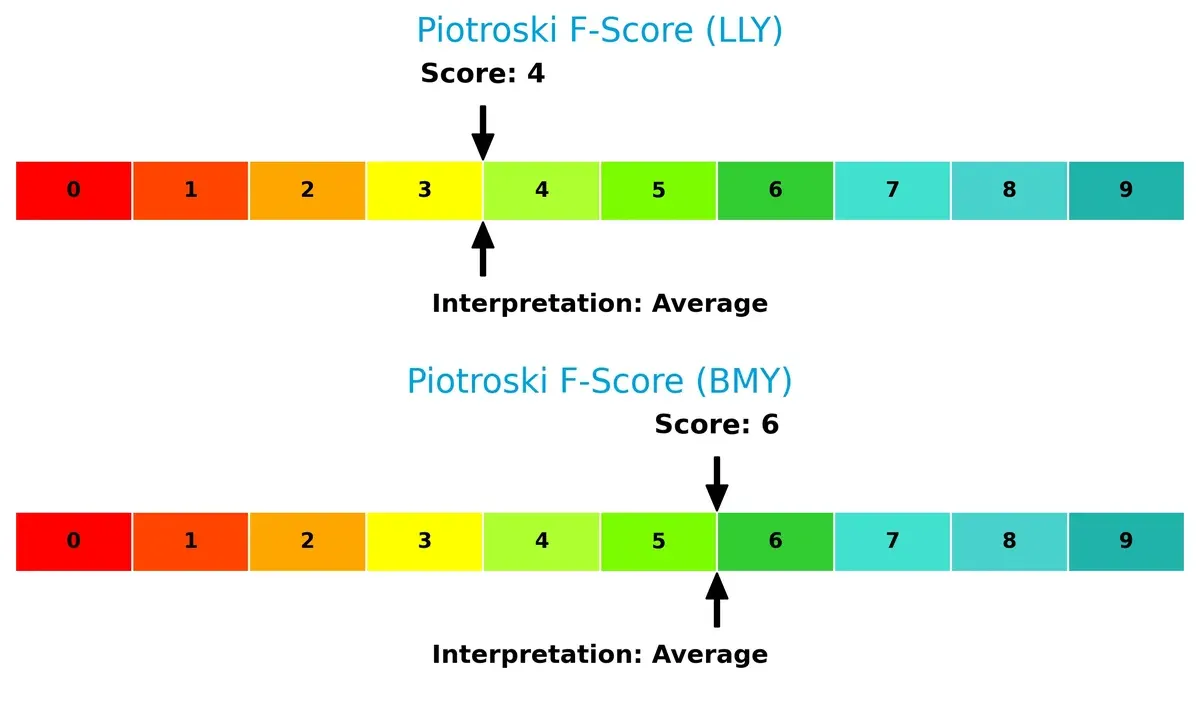
Financial Health: Quality of Operations
Bristol-Myers Squibb scores a healthier 6 on the Piotroski scale compared to Eli Lilly’s 4, reflecting stronger internal financial metrics. Eli Lilly’s lower score flags potential operational weaknesses relative to BMY’s steadier financial strength:
How are the two companies positioned?
This section dissects the operational DNA of Eli Lilly and BMY by comparing their revenue distribution and internal dynamics. The goal is to confront their economic moats and identify the most resilient competitive advantage today.
Revenue Segmentation: The Strategic Mix
This visual comparison dissects how Eli Lilly and Company and Bristol-Myers Squibb Company diversify their income streams and where their primary sector bets lie:
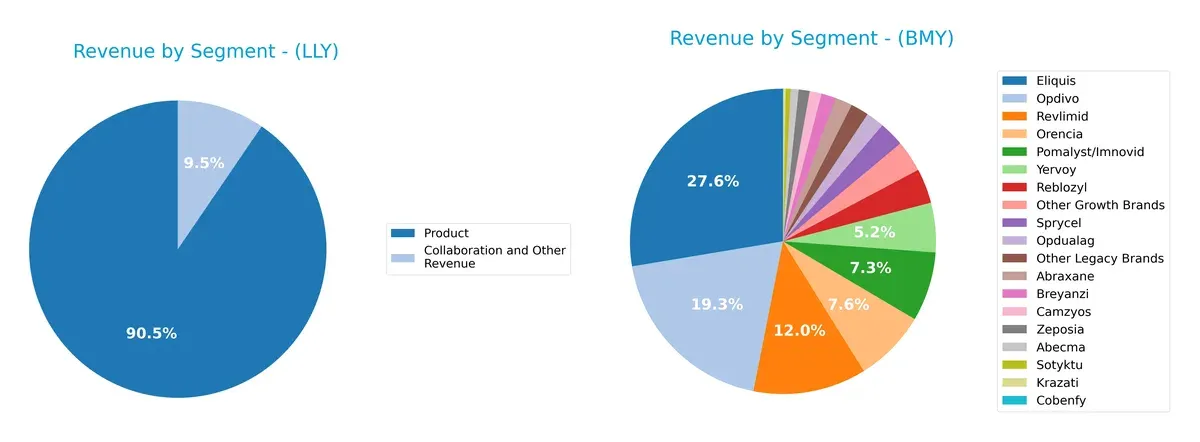
Eli Lilly anchors its revenue heavily in a single Product segment with $40.7B in 2024, supplemented by $4.3B from Collaboration and Other Revenue. In contrast, Bristol-Myers Squibb spreads its $26B+ revenue across multiple drugs, with Eliquis ($13.3B) and Opdivo ($9.3B) dominating. Lilly’s focused product base implies strong ecosystem lock-in but higher concentration risk. Bristol-Myers Squibb’s diversified portfolio reduces dependency on any single brand, offering more strategic resilience.
Strengths and Weaknesses Comparison
This table compares the strengths and weaknesses of Eli Lilly and Company (LLY) and Bristol-Myers Squibb Company (BMY):
LLY Strengths
- Strong profitability with a 31.66% net margin
- Favorable debt-to-assets and interest coverage ratios
- Significant U.S. revenue dominance with $30B in 2024
- Consistent collaboration and product revenue growth
BMY Strengths
- Balanced profitability with a 14.64% net margin
- Favorable debt metrics and strong interest coverage
- Diversified revenue across multiple brands
- Higher dividend yield at 4.6% supports income investors
LLY Weaknesses
- Unfavorable ROE and ROIC indicate potential capital inefficiency
- Weak liquidity ratios with zero current and quick ratio values
- High P/E ratio at 46.76 signals valuation risk
- Low dividend yield at 0.56% may deter income-focused investors
BMY Weaknesses
- Also suffers from unfavorable ROE and ROIC, showing capital return challenges
- Weak liquidity ratios with zero current and quick ratio values
- Neutral P/E ratio at 15.55 offers less valuation cushion
- Lower net margin compared to LLY limits profitability potential
LLY’s strengths lie in superior profitability and strong U.S. market presence, but it faces risks in capital efficiency and liquidity. BMY shows more balanced diversification and income appeal but contends with similar capital return issues and weaker margins. These factors shape each company’s strategic options in competitive pharmaceutical markets.
The Moat Duel: Analyzing Competitive Defensibility
A structural moat is the only reliable shield protecting long-term profits from relentless competitive erosion in pharma firms. Let’s dissect the moats of two giants:
Eli Lilly and Company: Innovation-Driven Intangible Assets
I see Eli Lilly’s competitive edge rooted in its strong portfolio of patented drugs and R&D prowess. This moat shows in its stellar 31.7% net margin and 44.7% revenue growth in 2025. New therapies in diabetes and oncology could deepen this advantage, though patent cliffs pose risks in 2026.
Bristol-Myers Squibb Company: Diversified Product Pipeline and Scale
Bristol-Myers’s moat contrasts with Lilly’s. It leverages scale and a broad biopharma portfolio, reflected in solid 22.2% EBIT margin and 266% EBIT growth last year. However, its sluggish revenue growth signals challenges. Expansion in immuno-oncology and cardiovascular drugs may disrupt markets and revive growth.
Innovation Moat vs. Scale and Diversification: The 2026 Moat Battle
Eli Lilly’s intangible asset moat is deeper, driven by rapid innovation and superior margin expansion. Bristol-Myers’s scale offers breadth but weaker growth momentum. Lilly stands better poised to defend and grow market share amid intensifying competition.
Which stock offers better returns?
The stock price dynamics of Eli Lilly and Bristol-Myers Squibb reveal distinct trajectories over the past 12 months, highlighting contrasting momentum and volume trends.
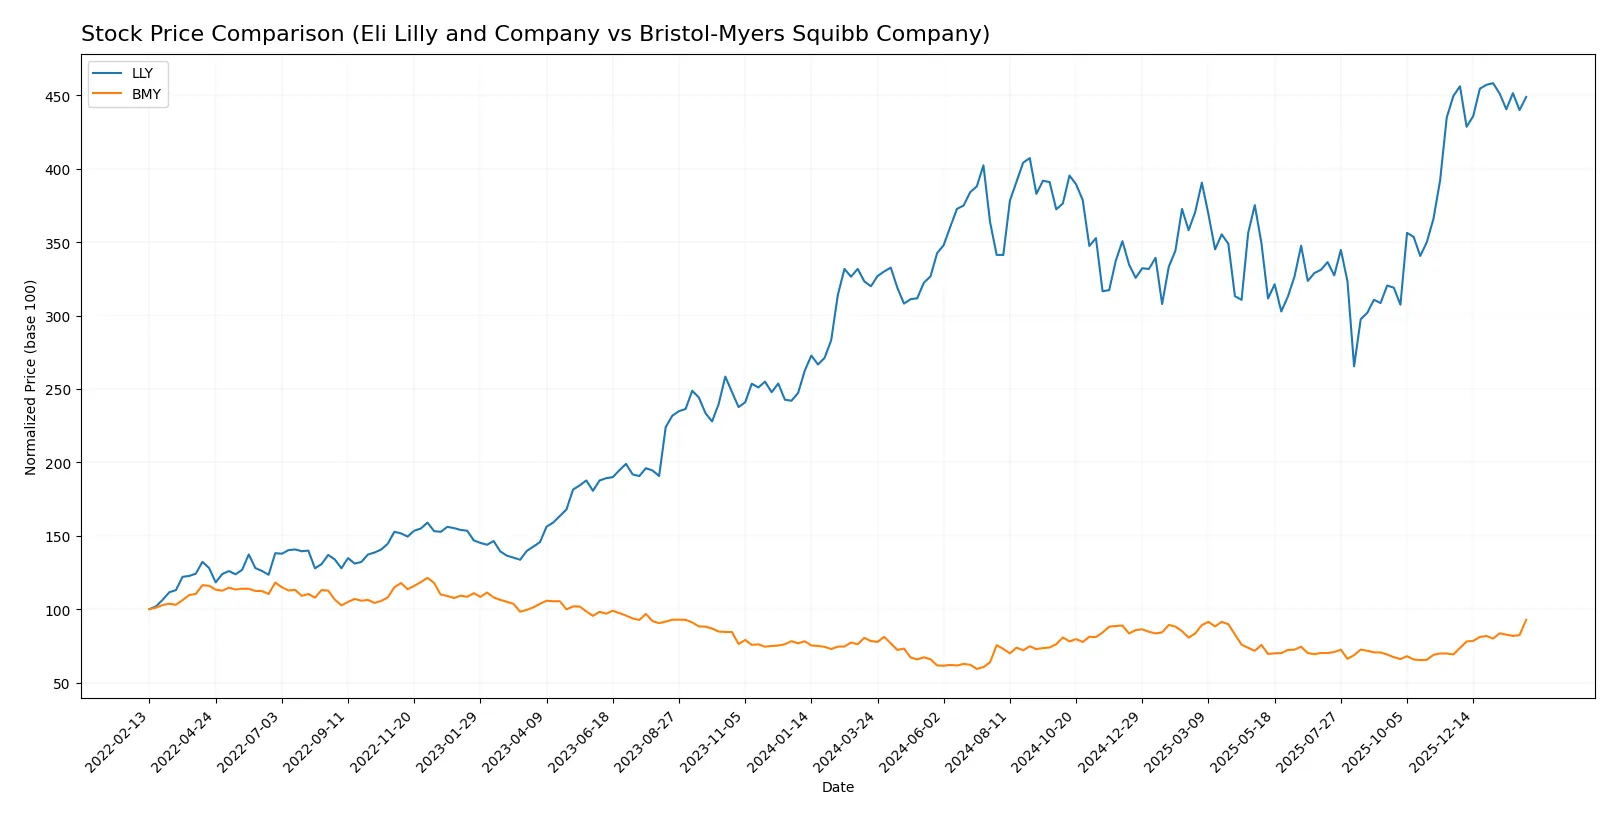
Trend Comparison
Eli Lilly’s stock rose 40.31% over the past year, showing a bullish trend but with decelerating momentum. The price ranged widely between 625.65 and 1080.36, indicating significant volatility.
Bristol-Myers Squibb gained 18.44% over the same period, with an accelerating bullish trend. The price stayed within a narrower band of 39.66 to 61.99, reflecting lower volatility.
Eli Lilly outperformed Bristol-Myers Squibb in market returns despite decelerating gains, delivering the highest price appreciation over the last year.
Target Prices
Analysts present a bullish consensus for both Eli Lilly and Company and Bristol-Myers Squibb Company.
| Company | Target Low | Target High | Consensus |
|---|---|---|---|
| Eli Lilly and Company | 830 | 1300 | 1187.94 |
| Bristol-Myers Squibb Company | 40 | 72 | 60.11 |
Eli Lilly’s target consensus at 1187.94 suggests upside potential from the current 1058.18 price. Bristol-Myers Squibb’s consensus of 60.11 is close to its current 61.99 price, indicating stable expectations.

Don’t Let Luck Decide Your Entry Point
Optimize your entry points with our advanced ProRealTime indicators. You’ll get efficient buy signals with precise price targets for maximum performance. Start outperforming now!
How do institutions grade them?
Here is a summary of the recent grades assigned by major financial institutions for both companies:
Eli Lilly and Company Grades
The table below lists Eli Lilly’s most recent grades from reputable firms:
| Grading Company | Action | New Grade | Date |
|---|---|---|---|
| Cantor Fitzgerald | maintain | Overweight | 2026-02-05 |
| Wells Fargo | maintain | Overweight | 2026-02-05 |
| JP Morgan | maintain | Overweight | 2026-02-05 |
| Morgan Stanley | maintain | Overweight | 2026-02-05 |
| Guggenheim | maintain | Buy | 2026-01-20 |
| B of A Securities | maintain | Buy | 2025-12-15 |
| Wells Fargo | maintain | Overweight | 2025-12-10 |
| BMO Capital | maintain | Outperform | 2025-12-04 |
| Guggenheim | maintain | Buy | 2025-12-03 |
| Bernstein | maintain | Outperform | 2025-11-24 |
Bristol-Myers Squibb Company Grades
The table below shows Bristol-Myers Squibb’s recent institutional grades:
| Grading Company | Action | New Grade | Date |
|---|---|---|---|
| Citigroup | maintain | Neutral | 2026-02-06 |
| Wells Fargo | maintain | Equal Weight | 2026-02-06 |
| Guggenheim | maintain | Buy | 2026-02-06 |
| Piper Sandler | maintain | Overweight | 2026-01-28 |
| Citigroup | maintain | Neutral | 2026-01-27 |
| Leerink Partners | maintain | Outperform | 2026-01-13 |
| Scotiabank | maintain | Sector Perform | 2026-01-09 |
| UBS | upgrade | Buy | 2026-01-07 |
| Citigroup | maintain | Neutral | 2026-01-07 |
| B of A Securities | upgrade | Buy | 2025-12-15 |
Which company has the best grades?
Eli Lilly consistently receives stronger grades—mostly Buy, Overweight, and Outperform—from top firms. Bristol-Myers Squibb’s ratings are more mixed, with Neutral and Equal Weight prevailing. Investors may interpret Eli Lilly’s superior grades as greater confidence from analysts.
Risks specific to each company
The following categories pinpoint critical pressure points and systemic threats facing Eli Lilly and Company and Bristol-Myers Squibb Company in the 2026 market environment:
1. Market & Competition
Eli Lilly and Company
- Faces intense competition in diabetes and oncology markets with premium pricing pressures
Bristol-Myers Squibb Company
- Competes broadly in hematology and oncology with diverse portfolio but faces pricing and patent risks
2. Capital Structure & Debt
Eli Lilly and Company
- Strong interest coverage (33.16) and low debt ratios signal solid financial stability
Bristol-Myers Squibb Company
- Moderate interest coverage (7.08) but concerning debt-to-equity score indicates higher leverage risk
3. Stock Volatility
Eli Lilly and Company
- Beta at 0.394 shows relatively low market volatility, offering stability
Bristol-Myers Squibb Company
- Even lower beta at 0.295 suggests less price fluctuation but may limit upside potential
4. Regulatory & Legal
Eli Lilly and Company
- Subject to rigorous FDA approvals; patent cliffs could pressure revenues
Bristol-Myers Squibb Company
- Faces ongoing litigation risks and regulatory scrutiny typical for large pharma
5. Supply Chain & Operations
Eli Lilly and Company
- Global operations with complex supply chains vulnerable to disruptions
Bristol-Myers Squibb Company
- Large manufacturing network with risks of raw material shortages and operational delays
6. ESG & Climate Transition
Eli Lilly and Company
- Increasing ESG initiatives but facing pressure to reduce environmental footprint
Bristol-Myers Squibb Company
- Active in ESG progress but must improve transparency and climate risk management
7. Geopolitical Exposure
Eli Lilly and Company
- Operations concentrated in the US with moderate global exposure
Bristol-Myers Squibb Company
- More diversified global presence increasing exposure to geopolitical tensions
Which company shows a better risk-adjusted profile?
Eli Lilly’s strongest risk is market competition with high pricing sensitivity. Bristol-Myers Squibb’s greatest risk lies in its elevated leverage and debt profile. Despite Eli Lilly’s unfavorable financial ratios and rating scores, its stellar interest coverage and low volatility improve risk resilience. Bristol-Myers Squibb’s more balanced financial scores and better profitability margins are offset by debt concerns. The recent interest coverage disparity highlights Eli Lilly’s superior capacity to service debt, favoring its risk-adjusted profile.
Final Verdict: Which stock to choose?
Eli Lilly’s superpower lies in its exceptional growth engine, fueled by robust innovation and expanding profit margins. Its relentless R&D investment drives superior top-line momentum. A point of vigilance is its stretched valuation and weakening returns on capital, which might pressure future upside. Best suited for aggressive growth portfolios willing to embrace volatility.
Bristol-Myers Squibb boasts a strategic moat through stable recurring revenues and disciplined capital allocation. It offers a more balanced risk profile with consistent free cash flow and attractive dividend yield. Compared to Lilly, it provides greater income stability, fitting well in GARP portfolios targeting growth with moderate valuation risk.
If you prioritize high-growth momentum and can tolerate valuation premiums, Eli Lilly outshines as the compelling choice due to its innovation-driven expansion. However, if you seek better income stability and a more conservative risk stance, Bristol-Myers Squibb offers superior resilience and yield potential. Both present viable but distinct investment scenarios based on your portfolio’s risk appetite.
Disclaimer: Investment carries a risk of loss of initial capital. The past performance is not a reliable indicator of future results. Be sure to understand risks before making an investment decision.
Go Further
I encourage you to read the complete analyses of Eli Lilly and Company and Bristol-Myers Squibb Company to enhance your investment decisions: