Home > Comparison > Healthcare > BSX vs SYK
The strategic rivalry between Boston Scientific Corporation and Stryker Corporation shapes the trajectory of the medical devices sector. Boston Scientific focuses on interventional medical specialties, offering diverse cardiovascular and neurotechnology products. In contrast, Stryker emphasizes orthopaedics, spine, and surgical equipment with a strong global distribution network. This analysis will evaluate which operational model presents the superior risk-adjusted return for a diversified healthcare portfolio amid evolving industry dynamics.

Table of contents
Companies Overview
Boston Scientific and Stryker dominate the medical devices sector with distinct yet overlapping specialties.
Boston Scientific Corporation: Interventional Medical Devices Leader
Boston Scientific commands a strong position in interventional medical devices worldwide. It generates revenue through diverse product lines, including cardiac rhythm management, neurostimulation, and structural heart therapies. In 2026, it focuses on expanding its minimally invasive solutions and enhancing remote patient management technologies to capture growing demand in chronic disease management.
Stryker Corporation: Orthopaedics and Surgical Innovation Powerhouse
Stryker excels as a medical technology innovator across orthopaedics, spine, and surgical equipment. Its revenue stems from implants, surgical navigation, and neurotechnology products offered globally through multiple channels. The company’s 2026 strategy prioritizes advancing minimally invasive surgical systems and expanding its neurotechnology portfolio to address evolving clinical needs.
Strategic Collision: Similarities & Divergences
Both companies pursue innovation-driven growth in medical devices but diverge in focus—Boston Scientific emphasizes interventional cardiology and rhythm management, while Stryker centers on orthopaedics and surgical technologies. Their primary battleground lies in minimally invasive procedures with overlapping neurotechnology efforts. Investors should note Boston Scientific’s broader device range versus Stryker’s concentrated specialty focus, shaping distinct risk and growth profiles.
Income Statement Comparison
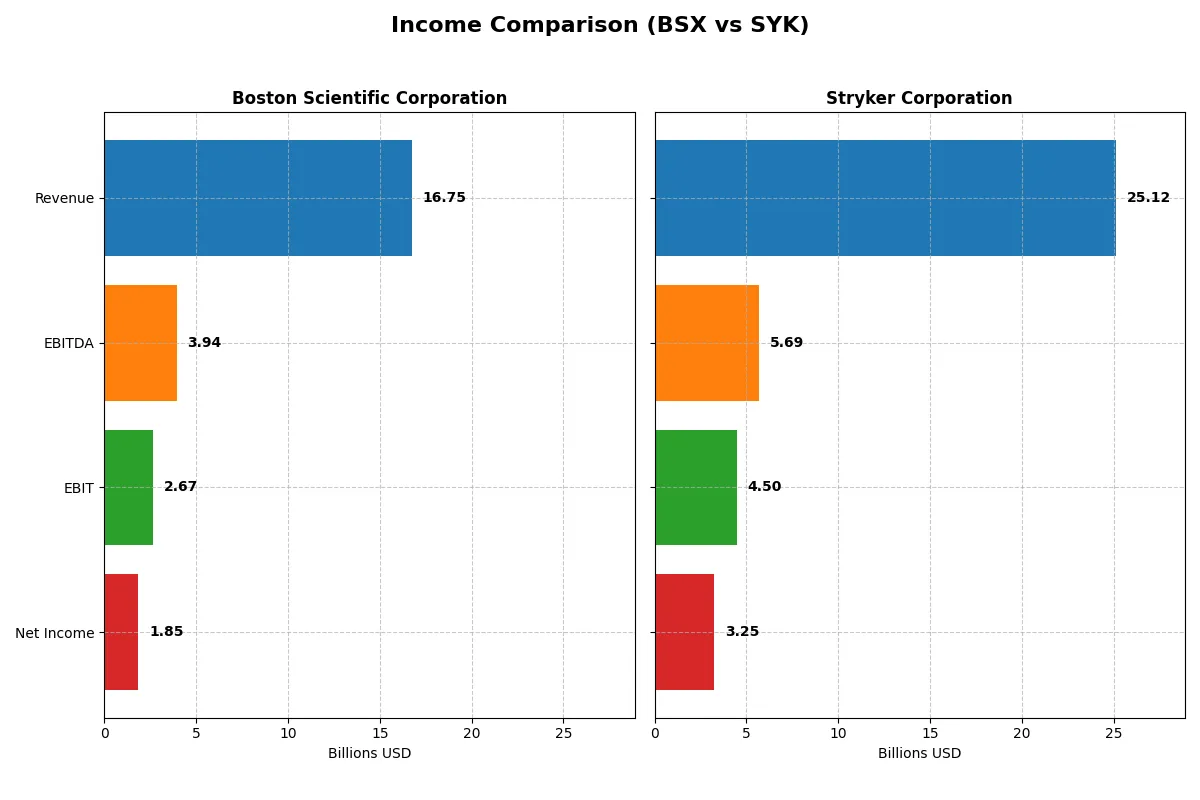
The following data dissects the core profitability and scalability of both corporate engines to reveal who dominates the bottom line:
| Metric | Boston Scientific Corporation (BSX) | Stryker Corporation (SYK) |
|---|---|---|
| Revenue | 16.7B | 25.1B |
| Cost of Revenue | 6.48B | 9.68B |
| Operating Expenses | 7.63B | 9.81B |
| Gross Profit | 10.3B | 15.4B |
| EBITDA | 3.94B | 5.69B |
| EBIT | 2.67B | 4.50B |
| Interest Expense | 387M | 0 |
| Net Income | 1.85B | 0 |
| EPS | 1.26 | 8.49 |
| Fiscal Year | 2024 | 2025 |
Income Statement Analysis: The Bottom-Line Duel
This income statement comparison reveals how efficiently each company converts sales into profit and sustains growth through operational excellence.
Boston Scientific Corporation Analysis
Boston Scientific’s revenue climbed from 9.9B in 2020 to 16.7B in 2024, showing a robust 69% growth over five years. Net income surged over 2300%, reaching 1.85B in 2024. Its gross margin holds strong at 61.3%, with a net margin of 11.1%, reflecting solid cost control. The company’s 2024 momentum is clear, with EBIT up 18% and EPS jumping 16.5%.
Stryker Corporation Analysis
Stryker’s revenue grew steadily by nearly 47% from 17.1B in 2021 to 25.1B in 2025. Net income expanded 63% to 3.25B in 2025, supporting a higher net margin of 12.9%. The gross margin remains competitive at 61.4%. In 2025, EBIT rose 15.7%, and EPS increased by 8.3%, demonstrating consistent operational efficiency and growth stability.
Growth Efficiency vs. Scale and Consistency
Boston Scientific excels in rapid net income expansion and margin improvement, showcasing impressive profitability gains from a smaller revenue base. Stryker commands a larger scale with higher absolute profits and slightly better net margins, reflecting steady growth. Investors valuing explosive earnings growth may favor Boston Scientific, while those seeking scale and stability might lean toward Stryker.
Financial Ratios Comparison
These vital ratios act as a diagnostic tool to expose the underlying fiscal health, valuation premiums, and capital efficiency of the companies compared below:
| Ratios | Boston Scientific (BSX) | Stryker Corporation (SYK) |
|---|---|---|
| ROE | 8.52% | 14.48% |
| ROIC | 6.13% | 7.37% |
| P/E | 70.9 | 41.4 |
| P/B | 6.04 | 5.99 |
| Current Ratio | 1.08 | 1.89 |
| Quick Ratio | 0.64 | 1.21 |
| D/E | 0.51 | 0.66 |
| Debt-to-Assets | 28.3% | 31.1% |
| Interest Coverage | 6.81 | 0 (not available) |
| Asset Turnover | 0.43 | 0.52 |
| Fixed Asset Turnover | 4.47 | 6.48 |
| Payout Ratio | 0% | 39.6% |
| Dividend Yield | 0% | 0.96% |
| Fiscal Year | 2024 | 2025 |
Efficiency & Valuation Duel: The Vital Signs
Financial ratios serve as a company’s DNA, unveiling hidden risks and operational strengths essential for investment insights.
Boston Scientific Corporation
Boston Scientific posts a moderate ROE of 8.5%, signaling modest profitability, while its net margin of 11.1% shows operational efficiency. However, the stock trades at a stretched P/E of 70.9, reflecting high valuation. The company offers no dividend, focusing instead on reinvestment in R&D, which consumes nearly 9.6% of revenue, aiming at future growth.
Stryker Corporation
Stryker demonstrates stronger profitability with a 14.5% ROE and a higher net margin of 12.9%. Its valuation is expensive but less stretched than Boston Scientific, with a P/E of 41.4. Stryker maintains a modest dividend yield of 0.96%, combining shareholder returns with efficient capital allocation to support growth and operational stability.
Valuation Stretch vs. Operational Strength: Finding the Balance
Stryker offers a better balance with superior profitability and a more reasonable valuation compared to Boston Scientific’s stretched multiples and weaker returns. Investors seeking a blend of income and growth may find Stryker’s profile more aligned with risk-managed equity exposure.
Which one offers the Superior Shareholder Reward?
I see Boston Scientific (BSX) pays no meaningful dividends, focusing on reinvestment to fuel growth, with a 0% dividend yield and zero payout ratio. Its free cash flow per share stands at $1.8, but buyback activity appears minimal. Stryker (SYK), by contrast, delivers a robust 0.9% dividend yield with a 40% payout ratio, balancing steady dividends with aggressive buybacks, supported by $11.2 free cash flow per share. Historically, SYK’s combination of sustainable dividends and significant buybacks offers a superior total shareholder return. I conclude that in 2026, Stryker provides the more attractive shareholder reward profile.
Comparative Score Analysis: The Strategic Profile
The radar chart reveals the fundamental DNA and trade-offs of Boston Scientific Corporation and Stryker Corporation, highlighting their financial strengths and valuation challenges:
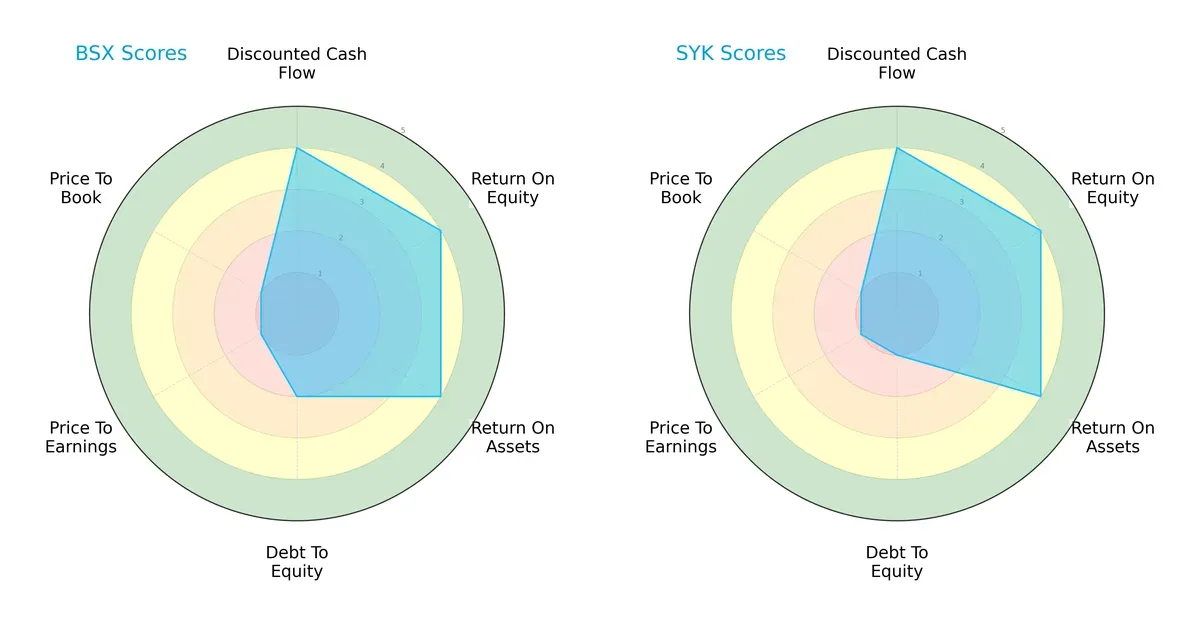
Both firms show strong operational efficiency with identical scores in DCF, ROE, and ROA, signaling robust profitability and asset utilization. Boston Scientific edges ahead in debt management with a moderate debt-to-equity score of 2 versus Stryker’s weaker 1, indicating better financial stability. However, both suffer from very unfavorable valuation metrics (PE and PB scores of 1), suggesting market skepticism or overvaluation. Boston Scientific presents a more balanced profile, while Stryker leans heavily on operational efficiency despite higher leverage risk.
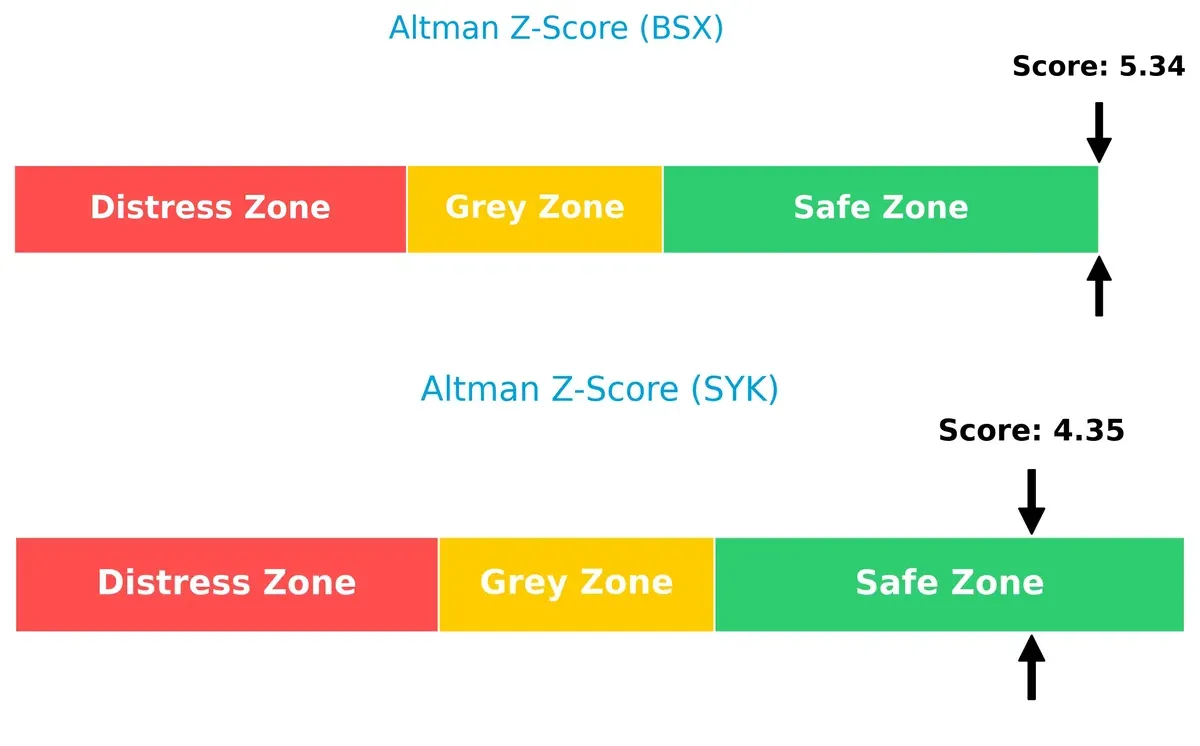
Bankruptcy Risk: Solvency Showdown
Boston Scientific’s Altman Z-Score of 5.34 outperforms Stryker’s 4.35, placing both comfortably in the safe zone but highlighting Boston Scientific’s stronger cushion against financial distress in this cycle:
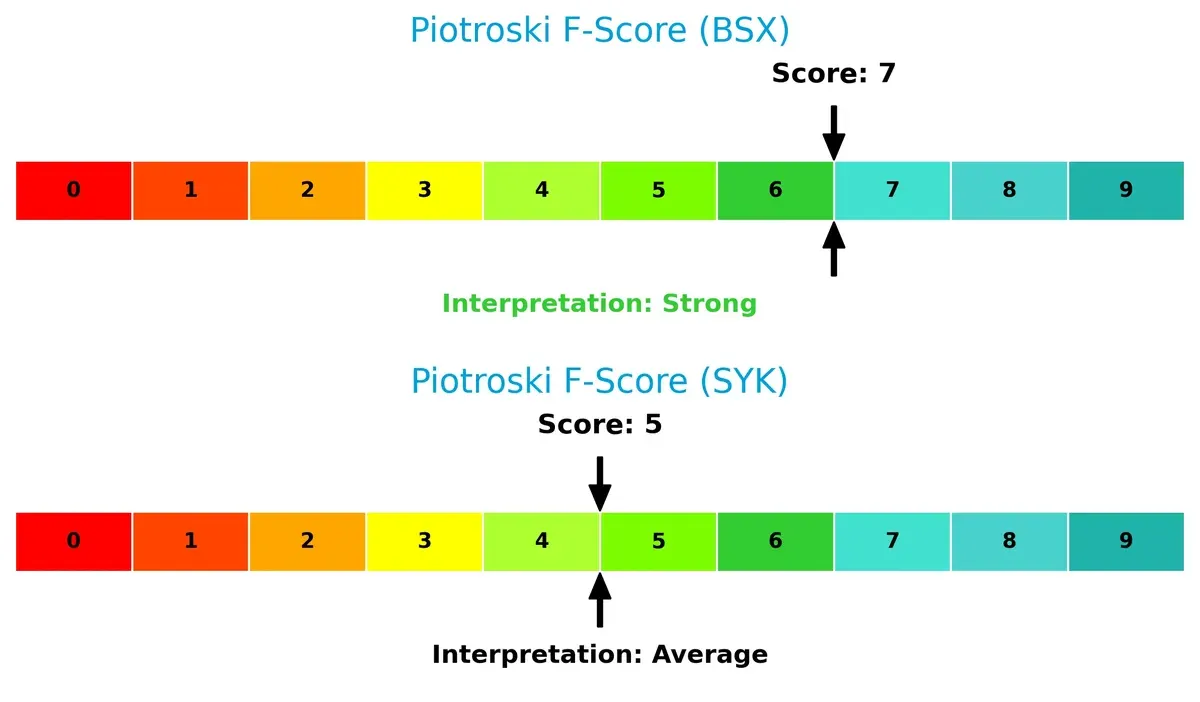
Financial Health: Quality of Operations
Boston Scientific’s Piotroski F-Score of 7 surpasses Stryker’s 5, indicating superior internal financial health and operational quality. Stryker’s average score raises caution about its profitability and efficiency metrics compared to Boston Scientific’s stronger fundamentals:
How are the two companies positioned?
This section dissects the operational DNA of BSX and SYK by comparing their revenue distribution and internal dynamics. The goal is to confront their economic moats to identify which model delivers the most resilient competitive advantage today.
Revenue Segmentation: The Strategic Mix
This visual comparison dissects how Boston Scientific Corporation and Stryker Corporation diversify their income streams and where their primary sector bets lie:
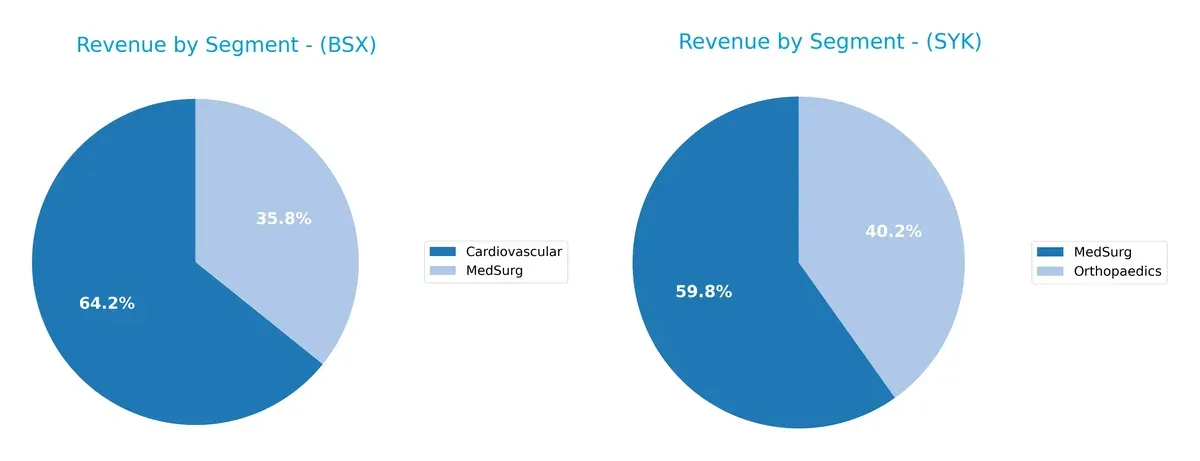
Boston Scientific anchors its revenue in Cardiovascular at $10.8B and MedSurg at $6B, showing moderate diversification. Stryker pivots between MedSurg at $13.5B and Orthopaedics at $9.1B, reflecting a balanced two-segment dominance. Boston Scientific’s focus on cardiovascular tech signals infrastructure strength but concentration risk. Stryker’s dual-segment reliance supports ecosystem lock-in and resilience against market shifts.
Strengths and Weaknesses Comparison
This table compares the strengths and weaknesses of Boston Scientific Corporation and Stryker Corporation:
Boston Scientific Corporation Strengths
- Strong revenue growth in Cardiovascular and MedSurg segments
- Favorable net margin of 11.07%
- Debt to assets ratio at 28.3% is conservative
- Interest coverage ratio of 6.9 supports debt service
- Favorable fixed asset turnover at 4.47
Stryker Corporation Strengths
- Higher net margin at 12.92% indicating better profitability
- Strong current and quick ratios (1.89 and 1.21) showing liquidity
- Infinite interest coverage indicates solid earnings vs. interest
- Favorable fixed asset turnover at 6.48 maximizes asset use
- Larger diversified MedSurg and Orthopaedics revenue base
Boston Scientific Corporation Weaknesses
- Unfavorable ROE at 8.52% below typical sector benchmarks
- High P/E of 70.89 and P/B of 6.04 indicate overvaluation risk
- Quick ratio of 0.64 suggests liquidity challenges
- Asset turnover at 0.43 is weak, limiting revenue generation
- No dividend yield may deter income-focused investors
Stryker Corporation Weaknesses
- Elevated P/E at 41.38 and P/B at 5.99 signal valuation concerns
- Neutral debt to assets at 31.06% is higher leverage risk
- Dividend yield low at 0.96% may disappoint income investors
- ROIC neutral at 7.37%, close to WACC, limits value creation
- Asset turnover at 0.52 only marginally better than BSX
Boston Scientific shows solid operational efficiency in fixed assets but struggles with liquidity and valuation metrics. Stryker delivers stronger profitability and liquidity, though valuation and leverage remain concerns. Both companies exhibit distinct financial profiles impacting their strategic flexibility.
The Moat Duel: Analyzing Competitive Defensibility
Structural moats are the only shield that protects long-term profits from relentless competition erosion. Let’s dissect the core moats of two medical device giants:
Boston Scientific Corporation: Innovation-Driven Intangible Assets
Boston Scientific leverages cutting-edge medical technologies and patents as its moat. This manifests in strong margin stability and a rapidly growing ROIC, signaling improving profitability. New product launches in cardiovascular and neurotechnology could deepen this advantage in 2026.
Stryker Corporation: Scale and Operational Efficiency
Stryker’s moat stems from its broad product portfolio and operational scale, enabling cost advantages and robust EBIT margins. However, its declining ROIC trend signals pressure on capital efficiency. Expansion in orthopaedics and neurotechnology offers growth but faces intensifying competition.
Verdict: Innovation Moat vs. Scale Moat Under Pressure
Boston Scientific’s expanding ROIC and innovation-led moat appear wider and more durable compared to Stryker’s scale advantage constrained by declining profitability. I see Boston Scientific better positioned to defend and grow its market share in 2026.
Which stock offers better returns?
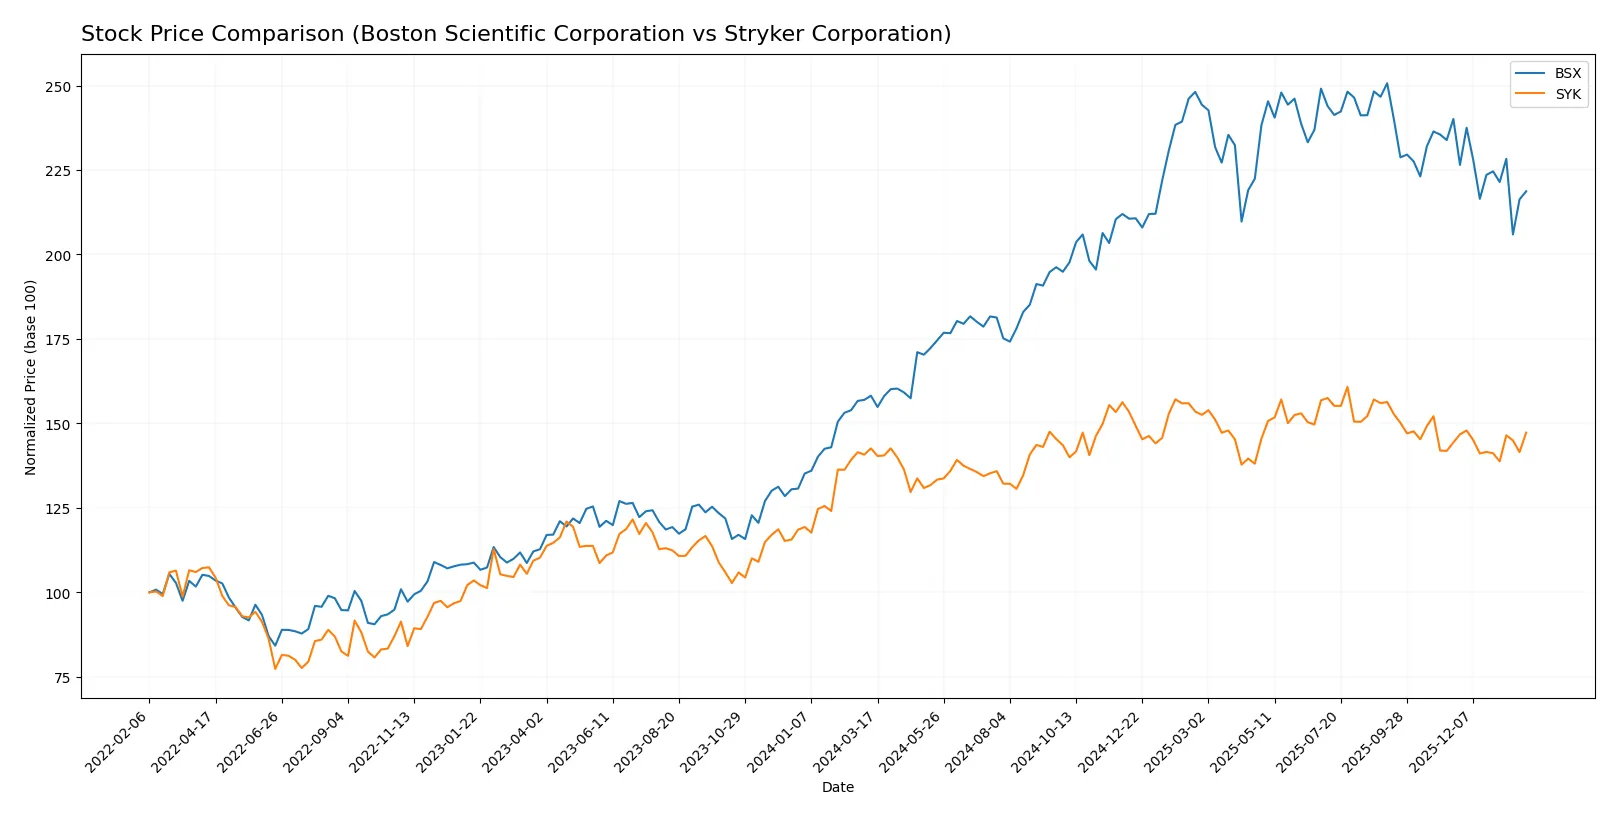
Over the past year, both stocks displayed bullish trends with Boston Scientific showing stronger gains but recent deceleration, while Stryker maintained modest growth with lower volatility.
Trend Comparison
Boston Scientific’s stock rose 38.24% over the last 12 months, marking a bullish trend with decelerating momentum and a price range between 66.23 and 107.22. Recent months show a slight downturn.
Stryker’s stock gained 3.27% in the past year, also bullish but with deceleration. Its price fluctuated between 325.43 and 403.53, showing a mild upward trend and moderate volatility.
Boston Scientific outperformed Stryker in market returns by a wide margin, although both stocks experienced decelerating trends near the period’s end.
Target Prices
Analysts show confident upside potential for Boston Scientific Corporation and Stryker Corporation over the next 12 months.
| Company | Target Low | Target High | Consensus |
|---|---|---|---|
| Boston Scientific Corporation | 100 | 140 | 124.67 |
| Stryker Corporation | 390 | 465 | 421.64 |
The consensus targets for both companies exceed current prices substantially, signaling strong analyst conviction in continued growth and value appreciation. Boston Scientific trades at $93.53 versus a $124.67 consensus, while Stryker’s $369.56 price lags its $421.64 target.

Don’t Let Luck Decide Your Entry Point
Optimize your entry points with our advanced ProRealTime indicators. You’ll get efficient buy signals with precise price targets for maximum performance. Start outperforming now!
How do institutions grade them?
Boston Scientific Corporation Grades
The following table summarizes recent analyst grades for Boston Scientific Corporation:
| Grading Company | Action | New Grade | Date |
|---|---|---|---|
| Oppenheimer | maintain | Outperform | 2026-01-16 |
| Truist Securities | maintain | Buy | 2025-12-18 |
| Canaccord Genuity | maintain | Buy | 2025-12-17 |
| RBC Capital | maintain | Outperform | 2025-12-17 |
| BTIG | maintain | Buy | 2025-11-21 |
| Truist Securities | maintain | Buy | 2025-10-23 |
| Canaccord Genuity | maintain | Buy | 2025-10-23 |
| Wells Fargo | maintain | Overweight | 2025-10-23 |
| Morgan Stanley | maintain | Overweight | 2025-10-23 |
| UBS | maintain | Buy | 2025-10-23 |
Stryker Corporation Grades
Below is a summary of recent analyst grades for Stryker Corporation:
| Grading Company | Action | New Grade | Date |
|---|---|---|---|
| Needham | maintain | Buy | 2026-01-30 |
| BTIG | maintain | Buy | 2026-01-30 |
| Bernstein | maintain | Outperform | 2026-01-09 |
| Citizens | upgrade | Market Outperform | 2025-12-19 |
| Truist Securities | maintain | Hold | 2025-12-18 |
| Citigroup | maintain | Buy | 2025-12-11 |
| Wells Fargo | maintain | Overweight | 2025-11-14 |
| Truist Securities | maintain | Hold | 2025-11-14 |
| Needham | maintain | Buy | 2025-11-14 |
| BTIG | maintain | Buy | 2025-11-14 |
Which company has the best grades?
Boston Scientific holds predominantly Buy and Outperform ratings, showing consistent confidence. Stryker also receives strong Buy and Outperform grades but includes Hold ratings, indicating more mixed views. Investors may interpret Boston Scientific’s grades as slightly more favorable overall.
Risks specific to each company
The following categories identify the critical pressure points and systemic threats facing both firms in the 2026 market environment:
1. Market & Competition
Boston Scientific Corporation
- Faces intense competition in cardiovascular and neuro markets; innovation pace is critical to maintain share.
Stryker Corporation
- Competes broadly in orthopedics and MedSurg; diversified portfolio cushions against single-market shocks.
2. Capital Structure & Debt
Boston Scientific Corporation
- Moderate leverage with debt-to-assets at 28.3%; interest coverage favorable at 6.9x, showing manageable debt risk.
Stryker Corporation
- Slightly higher leverage at 31.1% debt-to-assets; infinite interest coverage indicates very strong debt servicing capacity.
3. Stock Volatility
Boston Scientific Corporation
- Lower beta at 0.67 suggests lower volatility and defensive stock behavior.
Stryker Corporation
- Higher beta at 0.90 indicates greater price sensitivity to market swings, implying more risk.
4. Regulatory & Legal
Boston Scientific Corporation
- Operates in highly regulated medtech sectors; recalls or regulatory delays could impact revenue.
Stryker Corporation
- Also exposed to stringent regulations, especially in implantable devices; compliance costs may rise.
5. Supply Chain & Operations
Boston Scientific Corporation
- Global supply chain complexity poses risks amid geopolitical tensions; operational efficiency is a concern given low asset turnover.
Stryker Corporation
- Benefits from operational efficiency with higher fixed asset turnover; supply chain remains vulnerable to global disruptions.
6. ESG & Climate Transition
Boston Scientific Corporation
- Increasing pressure to reduce environmental impact; ESG integration is essential to meet investor expectations.
Stryker Corporation
- ESG initiatives progressing; must continue adapting to climate risks and regulatory expectations.
7. Geopolitical Exposure
Boston Scientific Corporation
- Moderate exposure to global markets with risks from trade policies and geopolitical tensions.
Stryker Corporation
- Similar international footprint; geopolitical risks could disrupt supply and sales in key regions.
Which company shows a better risk-adjusted profile?
Boston Scientific’s key risk lies in operational efficiency and market competition pressures, with a slightly unfavorable financial ratio profile. Stryker faces higher stock volatility and leverage concerns but benefits from strong debt coverage and operational metrics. Stryker’s better liquidity and higher Altman Z-score indicate a safer financial position. I consider Stryker’s robust interest coverage and stronger current ratios as decisive advantages. Boston Scientific’s relatively low quick ratio and high P/E multiple heighten concerns in a volatile market. Overall, Stryker offers a more balanced risk-adjusted profile in 2026.
Final Verdict: Which stock to choose?
Boston Scientific’s superpower lies in its accelerating profitability and strong income statement growth. However, its slight value destruction and stretched valuation ratios warrant caution. It fits portfolios seeking aggressive growth with an appetite for operational improvement and turnaround potential.
Stryker stands out with a solid strategic moat driven by efficient capital use and consistent profitability. It offers better liquidity and financial stability than Boston Scientific, suiting investors who prefer Growth at a Reasonable Price (GARP) with moderate risk tolerance.
If you prioritize dynamic growth potential and can tolerate some valuation premium, Boston Scientific is the compelling choice due to its improving profitability momentum. However, if you seek better financial stability and a durable competitive advantage, Stryker offers superior risk management and steady returns. Both present analytical scenarios tailored to distinct investor profiles.
Disclaimer: Investment carries a risk of loss of initial capital. The past performance is not a reliable indicator of future results. Be sure to understand risks before making an investment decision.
Go Further
I encourage you to read the complete analyses of Boston Scientific Corporation and Stryker Corporation to enhance your investment decisions: