Home > Comparison > Healthcare > BSX vs MDT
The strategic rivalry between Boston Scientific Corporation and Medtronic plc shapes the medical devices sector’s evolution. Boston Scientific operates as an innovative specialist focused on interventional medical technologies, while Medtronic commands a diversified portfolio spanning cardiovascular, surgical, neuroscience, and diabetes therapies. This duel highlights a contrast between Boston Scientific’s targeted innovation and Medtronic’s broad-based scale. I will analyze which trajectory delivers superior risk-adjusted returns for a balanced healthcare portfolio.

Table of contents
Companies Overview
Boston Scientific and Medtronic dominate the global medical devices market, shaping healthcare innovation worldwide.
Boston Scientific Corporation: Interventional Medical Devices Leader
Boston Scientific excels as a developer and manufacturer of medical devices for interventional specialties. Its core revenue comes from products treating cardiovascular, rhythm disorders, and oncology conditions. In 2026, it sharpens focus on expanding its MedSurg, Rhythm and Neuro, and Cardiovascular segments to enhance diagnostic and therapeutic technologies globally.
Medtronic plc: Comprehensive Medical Therapies Innovator
Medtronic leads by delivering device-based medical therapies across cardiovascular, neuroscience, and surgical fields. It generates revenue from implantable cardiac devices, surgical instruments, and diabetes care systems. The 2026 strategy emphasizes integrating robotic-assisted surgery and AI-driven solutions to broaden its footprint in minimally invasive and patient-centric healthcare.
Strategic Collision: Similarities & Divergences
Both companies prioritize advanced cardiovascular solutions yet diverge in scope—Boston Scientific concentrates on interventional devices, while Medtronic builds a broader platform including robotics and diabetes care. Their key battleground is cardiac innovation, competing for global market share. Boston Scientific offers a focused, agile profile; Medtronic presents a diversified, innovation-driven investment case.
Income Statement Comparison
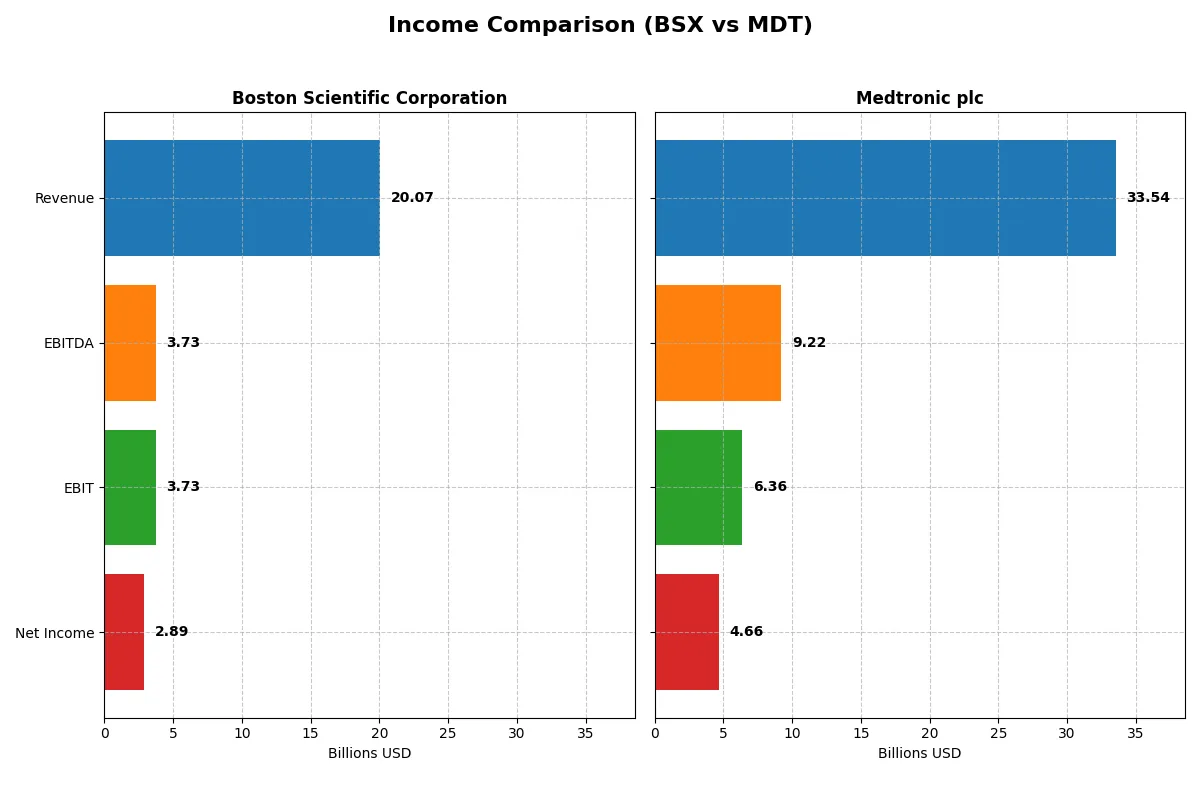
This data dissects the core profitability and scalability of both corporate engines to reveal who dominates the bottom line:
| Metric | Boston Scientific Corporation (BSX) | Medtronic plc (MDT) |
|---|---|---|
| Revenue | 20B | 33.5B |
| Cost of Revenue | 6.22B | 11.63B |
| Operating Expenses | 9.88B | 15.95B |
| Gross Profit | 13.85B | 21.91B |
| EBITDA | 3.73B | 9.22B |
| EBIT | 3.73B | 6.36B |
| Interest Expense | 349M | 729M |
| Net Income | 2.89B | 4.66B |
| EPS | 1.96 | 3.63 |
| Fiscal Year | 2025 | 2025 |
Income Statement Analysis: The Bottom-Line Duel
This income statement comparison reveals which company runs a more efficient and profitable corporate engine through recent financial performance.
Boston Scientific Corporation Analysis
Boston Scientific’s revenue surged 20B in 2025, up nearly 20% year-on-year, with net income climbing 56% to 2.9B. The company maintains robust gross margins at 69%, signaling strong cost control. Net margin improved to 14.4%, reflecting enhanced bottom-line efficiency and sustained earnings momentum.
Medtronic plc Analysis
Medtronic posted 33.5B revenue in its 2025 fiscal year, growing modestly by 3.6%. Net income increased 27% to 4.7B, supported by a stable EBIT margin near 19%. Despite slower revenue growth, Medtronic’s consistent margins and improved net margin of 13.9% demonstrate steady profitability and operational discipline.
Verdict: High Growth Momentum vs. Consistent Scale
Boston Scientific outpaces Medtronic in revenue and net income growth rates, boasting superior margin expansion and earnings leverage. Medtronic offers scale and stable profitability but lacks Boston Scientific’s rapid momentum. Investors seeking growth and margin improvement may find Boston Scientific’s profile more compelling in today’s market.
Financial Ratios Comparison
These vital ratios act as a diagnostic tool to expose the underlying fiscal health, valuation premiums, and capital efficiency of Boston Scientific Corporation (BSX) and Medtronic plc (MDT) as of their most recent fiscal years:
| Ratios | Boston Scientific (BSX) | Medtronic (MDT) |
|---|---|---|
| ROE | N/A | 9.7% |
| ROIC | N/A | 6.1% |
| P/E | 48.9 | 23.4 |
| P/B | 0 | 2.27 |
| Current Ratio | 0 | 1.85 |
| Quick Ratio | 0 | 1.42 |
| D/E | 0 | 0.59 |
| Debt-to-Assets | 0 | 31.1% |
| Interest Coverage | 11.4 | 8.2 |
| Asset Turnover | 0 | 0.37 |
| Fixed Asset Turnover | 0 | 4.91 |
| Payout ratio | 0 | 77% |
| Dividend yield | 0% | 3.29% |
| Fiscal Year | 2025 | 2025 |
Efficiency & Valuation Duel: The Vital Signs
Financial ratios serve as a company’s DNA, exposing operational strengths and hidden risks that shape investment decisions.
Boston Scientific Corporation
Boston Scientific shows a favorable net margin of 14.38% but struggles with zero reported ROE and ROIC, signaling weak profitability efficiency. Its P/E ratio at 48.91 marks the stock as expensive. The company offers no dividend yield, instead channeling resources into a robust R&D program, dedicating about 9.6% of revenue to innovation.
Medtronic plc
Medtronic maintains a solid net margin near 13.9% and posts a modest ROE of 9.71%, reflecting reasonable profitability. Its P/E ratio around 23.37 suggests fair valuation compared to Boston Scientific’s stretched multiple. The firm rewards shareholders with a 3.29% dividend yield while also investing roughly 8.1% of revenue into R&D, balancing growth and income.
Premium Valuation vs. Operational Safety
Medtronic offers a better balance of valuation and profitability, with a reasonable P/E and a tangible dividend payout. Boston Scientific’s higher valuation and lack of shareholder returns increase risk despite strong margins. Investors seeking income and moderate risk may prefer Medtronic’s profile.
Which one offers the Superior Shareholder Reward?
I observe that Boston Scientific (BSX) does not pay dividends, focusing on reinvestment, while Medtronic (MDT) delivers a robust 3.3% dividend yield with a high payout ratio around 77–96%. MDT pairs this with aggressive buybacks, supporting a well-rounded shareholder return. BSX’s absence of dividends signals a growth strategy via R&D, but its high P/E ratios (up to 70x) raise valuation risks. MDT’s lower P/E near 23x and sustainable dividend coverage (over 1.2x dividend plus capex) reflect disciplined capital allocation. I conclude MDT offers the superior total return profile in 2026 due to its balanced income and buyback approach, underpinned by sustainable free cash flow and prudent leverage.
Comparative Score Analysis: The Strategic Profile
The radar chart reveals the core DNA and trade-offs of Boston Scientific Corporation and Medtronic plc, highlighting their financial strengths and vulnerabilities:
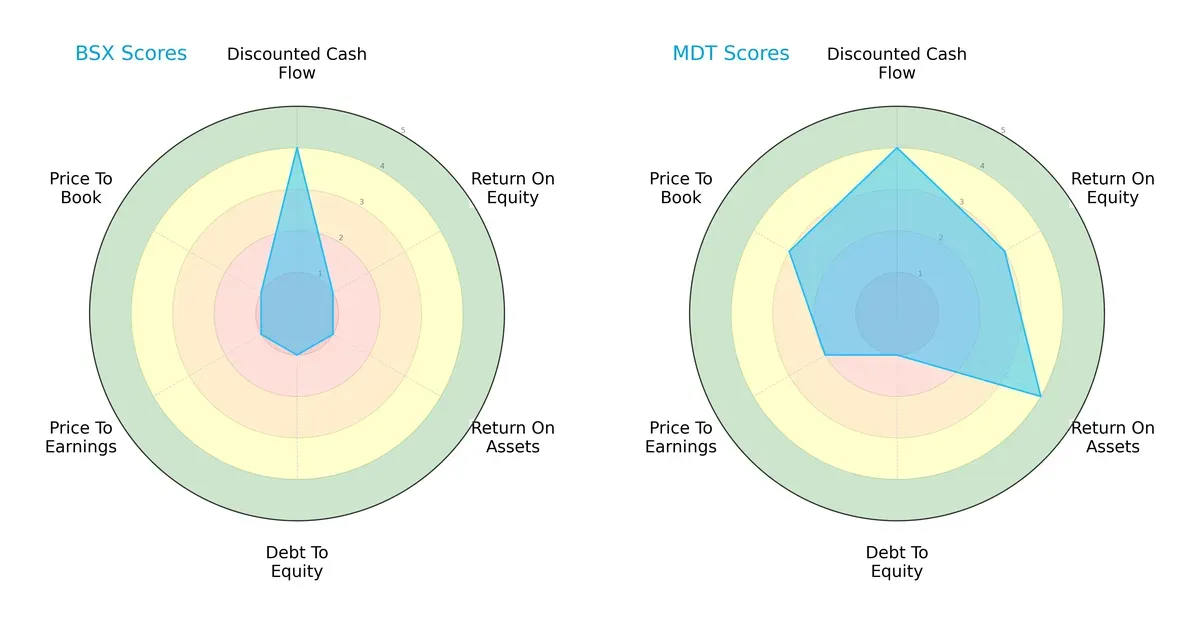
Boston Scientific relies heavily on discounted cash flow strength but scores very low on profitability (ROE 1, ROA 1) and valuation metrics (PE/PB scores at 1), signaling clear weaknesses. Medtronic presents a more balanced profile with moderate to favorable scores in ROE (3), ROA (4), and valuation (PE 2, PB 3), despite both firms sharing a weak debt-to-equity score (1). Medtronic’s diversified strengths reduce risk, while Boston Scientific depends on a single financial edge.
Bankruptcy Risk: Solvency Showdown
Medtronic’s Altman Z-Score of 3.16 versus Boston Scientific’s 4.63 signals both firms occupy the safe zone, but Boston Scientific exhibits stronger solvency resilience amid economic cycles:
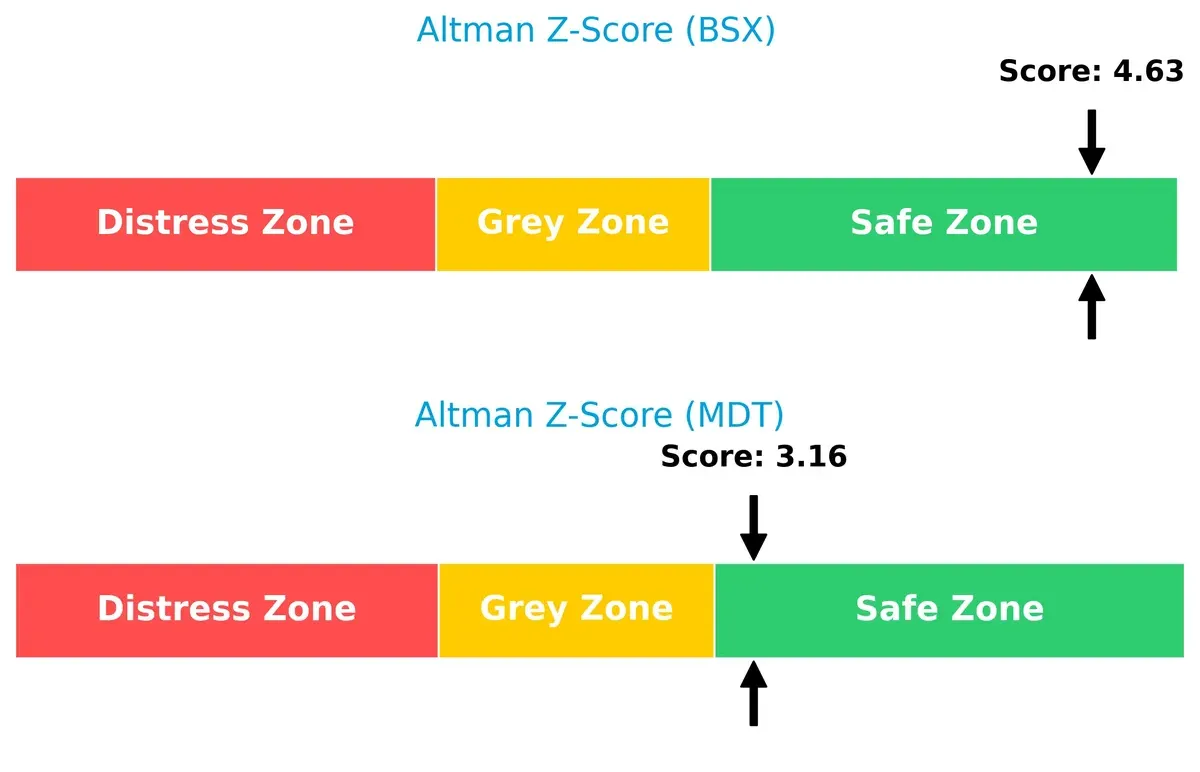
Boston Scientific’s higher score indicates lower bankruptcy risk, enhancing investor confidence for long-term stability. Medtronic remains solid but closer to the grey zone threshold, warranting cautious monitoring in volatile markets.
Financial Health: Quality of Operations
Medtronic outperforms Boston Scientific with a Piotroski F-Score of 7 against 5, reflecting stronger internal financial health and operational quality:
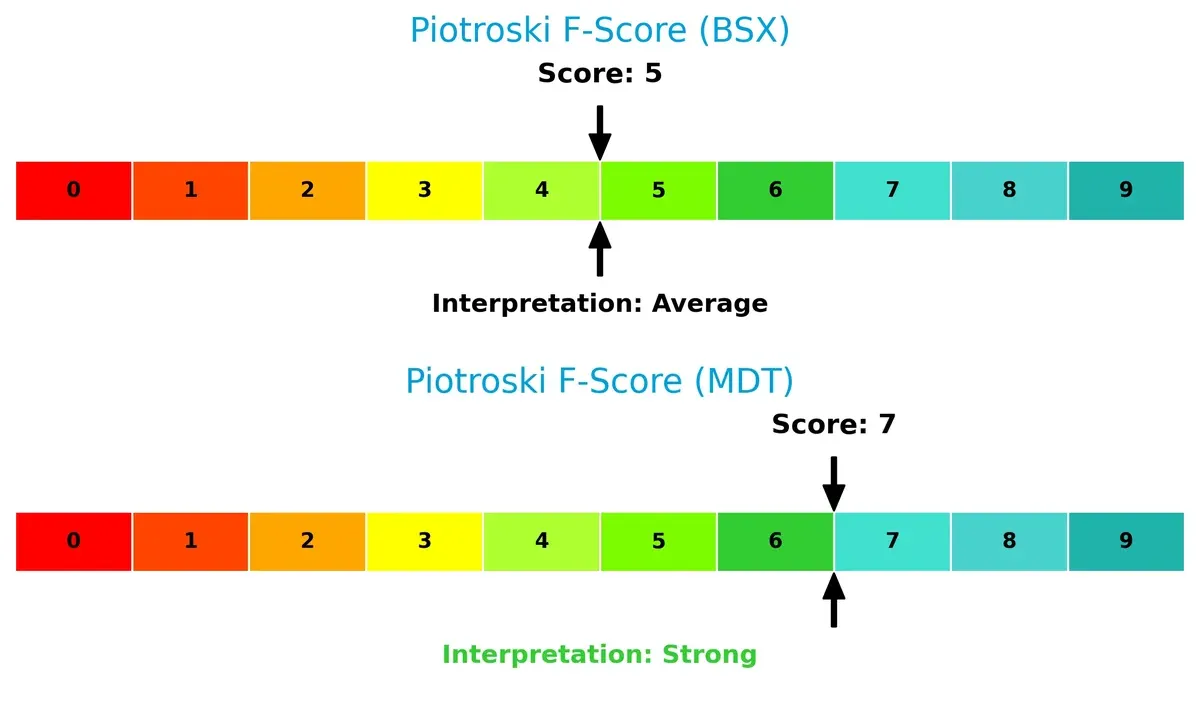
Medtronic’s score signals robust profitability, liquidity, and efficiency metrics, while Boston Scientific’s average score raises red flags about internal weaknesses. Investors should weigh these operational concerns before committing capital.
How are the two companies positioned?
This section dissects the operational DNA of BSX and MDT by comparing their revenue distribution and internal strengths and weaknesses. The goal is to confront their economic moats and identify which model offers the most resilient, sustainable advantage today.
Revenue Segmentation: The Strategic Mix
The following comparison dissects how Boston Scientific and Medtronic diversify their income streams and reveals their primary sector bets for 2024:
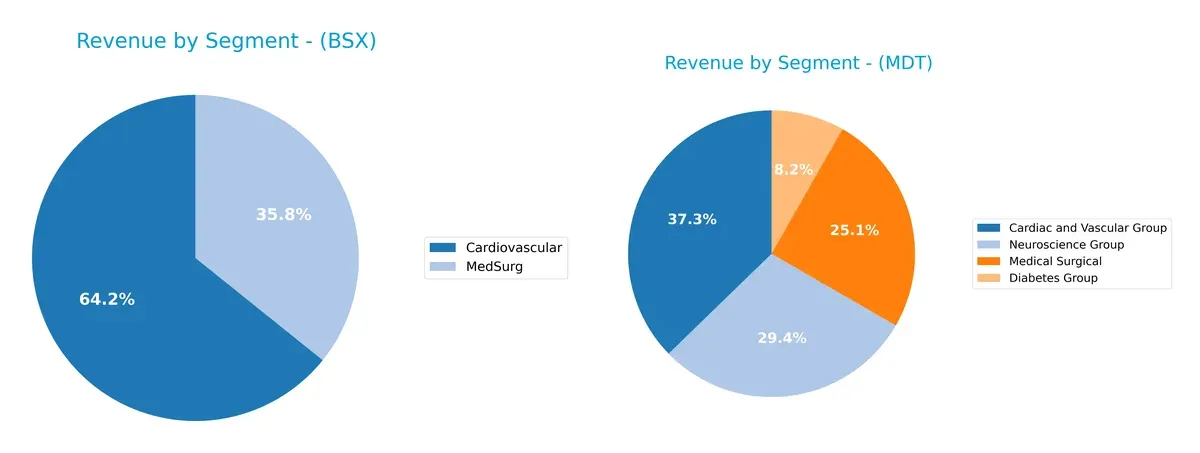
Boston Scientific anchors its revenue in Cardiovascular at $10.8B, with MedSurg at $6B, showing moderate diversification. Medtronic dwarfs with a broader spread: Cardiac and Vascular Group leads at $11.8B, Neuroscience follows at $9.4B, and Medical Surgical at $8.4B. Medtronic’s multi-segment strength reduces concentration risk, while Boston Scientific pivots heavily on Cardiovascular dominance, increasing reliance on a single sector’s performance.
Strengths and Weaknesses Comparison
This table compares the strengths and weaknesses of Boston Scientific Corporation (BSX) and Medtronic plc (MDT):
BSX Strengths
- Strong cardiovascular product revenue growth
- Favorable net margin at 14.38%
- Low debt-to-assets ratio and good interest coverage
- Significant US market presence with $10.2B revenue
MDT Strengths
- Diversified product segments with four major groups
- Favorable weighted average cost of capital at 6.43%
- Solid current and quick ratios indicating liquidity
- Attractive dividend yield at 3.29%
- Global footprint with substantial US and international sales
BSX Weaknesses
- Unfavorable ROE and ROIC at 0%
- Unavailable WACC data
- Poor liquidity ratios including current and quick ratio at 0
- High P/E ratio at 48.91 signaling valuation concerns
- Lack of dividend yield
MDT Weaknesses
- ROE is low at 9.71% and neutral ROIC at 6.08%
- Moderate debt-to-equity and debt-to-assets ratios
- Asset turnover below benchmark at 0.37
- Slightly unfavorable profitability ratios compared to sector leaders
Boston Scientific shows strengths in margin and debt management but has liquidity and profitability metric gaps. Medtronic displays balanced diversification, liquidity, and dividend appeal but faces challenges with efficiency and returns on equity. Both companies exhibit distinct financial profiles affecting strategic financial management and investor considerations.
The Moat Duel: Analyzing Competitive Defensibility
A structural moat is the only reliable shield protecting long-term profits from relentless competitive erosion in medical devices:
Boston Scientific Corporation: Intangible Assets Powerhouse
Boston Scientific’s moat stems from its deep portfolio of patented medical technologies. I see this in its stable 18.6% EBIT margin and rapid revenue growth near 20%. Expansion into neuro and cardiovascular devices could widen its moat, yet declining ROIC signals caution.
Medtronic plc: Scale and Innovation Synergy
Medtronic’s moat combines vast scale and continuous innovation, contrasting Boston Scientific’s focus on patents. Its slightly unfavorable ROIC versus WACC shows value erosion, but growing ROIC and broad product diversification support margin resilience and global expansion opportunities in 2026.
Patents vs. Scale: Who Defends Better?
Boston Scientific’s intangible asset moat drives superior margin growth but risks from declining capital efficiency. Medtronic’s scale and R&D deliver steadier ROIC improvement despite current value erosion. I conclude Medtronic holds the deeper moat, better positioned to defend market share long term.
Which stock offers better returns?
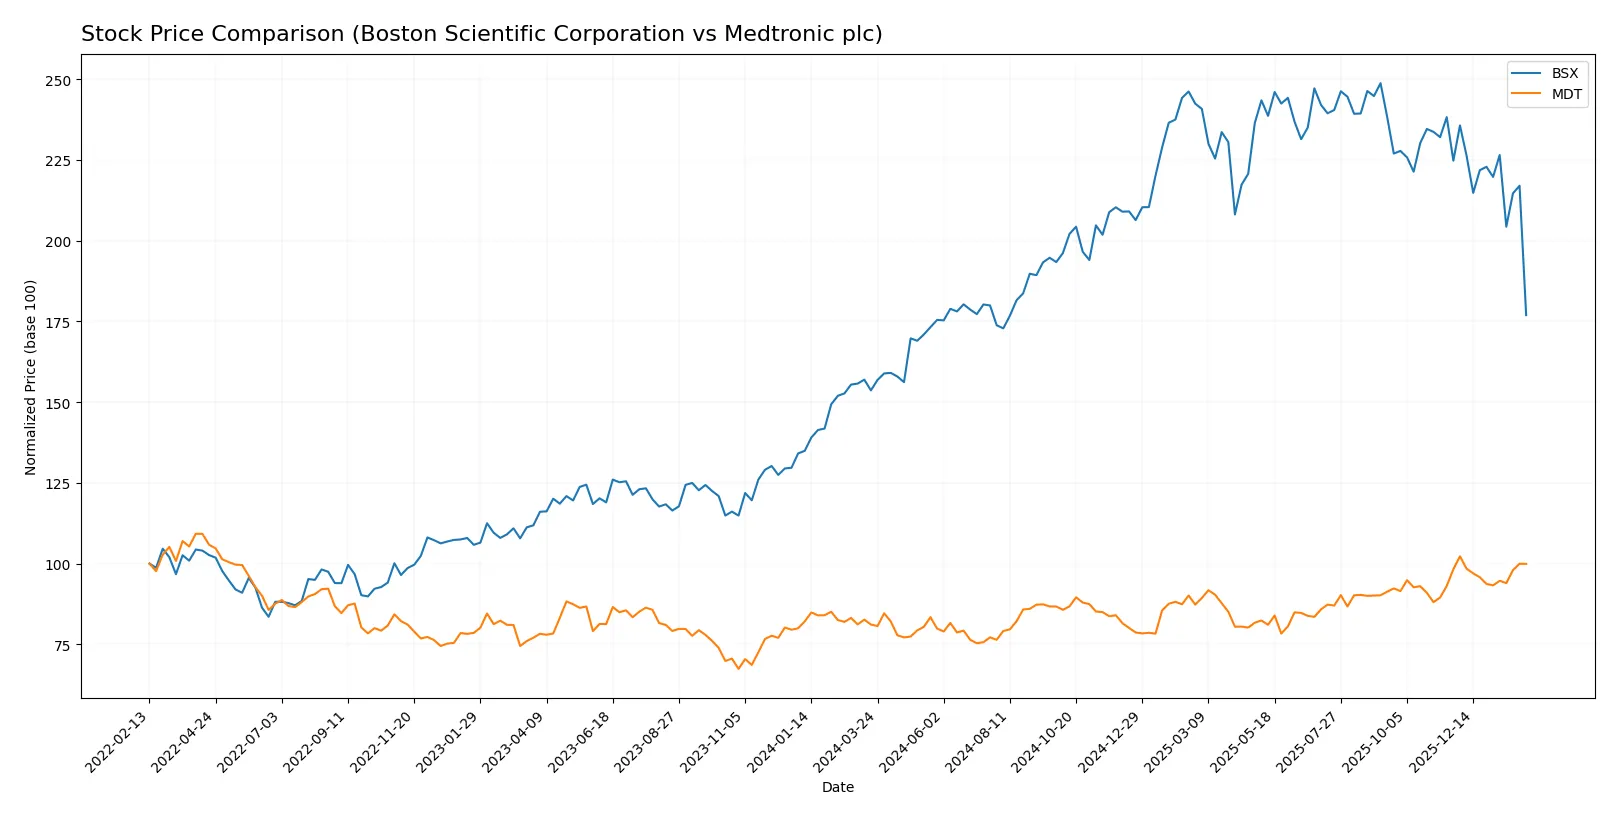
The past year reveals distinct price dynamics for Boston Scientific and Medtronic, marked by strong gains but recent divergence in momentum and buyer activity.
Trend Comparison
Boston Scientific’s stock rose 15.16% over 12 months, sustaining a bullish trend despite decelerating momentum. It peaked at 107.22 and bottomed at 66.23, showing moderate volatility (std dev 11.87).
Medtronic gained 23.13% over the same period, also bullish with decelerating acceleration. Its price ranged between 77.61 and 105.33, exhibiting lower volatility (std dev 6.4) than Boston Scientific.
Comparing trends, Medtronic outperformed Boston Scientific, delivering higher total returns and steadier price appreciation over the past year.
Target Prices
Analysts project steady upside for Boston Scientific and Medtronic, reflecting confidence in their medical device franchises.
| Company | Target Low | Target High | Consensus |
|---|---|---|---|
| Boston Scientific Corporation | 94 | 130 | 108.53 |
| Medtronic plc | 103 | 120 | 111.18 |
Boston Scientific’s consensus target at 108.53 suggests a 42% premium over its current 76.27 price. Medtronic’s 111.18 target implies about 8% upside from 102.9. Both reflect solid analyst optimism.

Don’t Let Luck Decide Your Entry Point
Optimize your entry points with our advanced ProRealTime indicators. You’ll get efficient buy signals with precise price targets for maximum performance. Start outperforming now!
How do institutions grade them?
Institutional grades for Boston Scientific Corporation and Medtronic plc reflect recent analyst assessments:
Boston Scientific Corporation Grades
The table below summarizes recent grades from notable institutions for Boston Scientific Corporation.
| Grading Company | Action | New Grade | Date |
|---|---|---|---|
| Canaccord Genuity | Maintain | Buy | 2026-02-05 |
| RBC Capital | Maintain | Outperform | 2026-02-05 |
| JP Morgan | Maintain | Overweight | 2026-02-05 |
| Citigroup | Maintain | Buy | 2026-02-05 |
| TD Cowen | Maintain | Buy | 2026-02-05 |
| UBS | Maintain | Buy | 2026-02-05 |
| Evercore ISI Group | Maintain | Outperform | 2026-02-05 |
| Morgan Stanley | Maintain | Overweight | 2026-02-05 |
| Truist Securities | Maintain | Buy | 2026-02-05 |
| Needham | Maintain | Buy | 2026-02-05 |
Medtronic plc Grades
Below are recent institutional grades for Medtronic plc from well-known analysts.
| Grading Company | Action | New Grade | Date |
|---|---|---|---|
| Bernstein | Maintain | Outperform | 2026-01-09 |
| Barclays | Maintain | Overweight | 2026-01-08 |
| William Blair | Upgrade | Outperform | 2026-01-06 |
| Truist Securities | Maintain | Hold | 2025-12-18 |
| Truist Securities | Maintain | Hold | 2025-11-20 |
| Barclays | Maintain | Overweight | 2025-11-20 |
| Goldman Sachs | Upgrade | Neutral | 2025-11-19 |
| UBS | Maintain | Neutral | 2025-11-19 |
| Wells Fargo | Maintain | Overweight | 2025-11-19 |
| Morgan Stanley | Maintain | Overweight | 2025-11-19 |
Which company has the best grades?
Boston Scientific receives consistently stronger grades, mostly Buy and Outperform, compared to Medtronic’s mixed ratings including Hold and Neutral. This suggests Boston Scientific is viewed more favorably by analysts, potentially influencing investor sentiment positively.
Risks specific to each company
The following categories identify the critical pressure points and systemic threats facing both firms in the 2026 market environment:
1. Market & Competition
Boston Scientific Corporation
- Faces intense competition in interventional medical devices with pressure on margins and innovation cycles.
Medtronic plc
- Competes globally with a broader product portfolio but must sustain innovation against well-funded rivals.
2. Capital Structure & Debt
Boston Scientific Corporation
- Shows favorable debt metrics with low leverage and strong interest coverage, indicating financial stability.
Medtronic plc
- Exhibits moderate leverage (D/E 0.59) and solid interest coverage, but debt levels require monitoring.
3. Stock Volatility
Boston Scientific Corporation
- Lower beta (0.657) suggests less sensitivity to market swings, appealing for risk-averse investors.
Medtronic plc
- Slightly higher beta (0.718) indicates moderate exposure to market volatility.
4. Regulatory & Legal
Boston Scientific Corporation
- Operates under strict FDA and international regulations, risks include costly compliance and recalls.
Medtronic plc
- Faces complex regulatory environment globally with potential litigation in innovative surgical technologies.
5. Supply Chain & Operations
Boston Scientific Corporation
- Relies on complex global supply chains vulnerable to geopolitical disruptions and component shortages.
Medtronic plc
- Larger scale provides some supply chain resilience but still exposed to global logistics risks.
6. ESG & Climate Transition
Boston Scientific Corporation
- Increasing pressure to improve sustainability practices amid rising investor and regulatory expectations.
Medtronic plc
- Advanced ESG initiatives but must continue adapting to climate risks affecting operations and reputation.
7. Geopolitical Exposure
Boston Scientific Corporation
- Primarily US-based, with moderate international exposure that entails currency and trade risks.
Medtronic plc
- Global footprint in multiple geographies increases exposure to geopolitical tensions and regulatory shifts.
Which company shows a better risk-adjusted profile?
Boston Scientific’s principal risk is its unfavorable financial ratios, including poor liquidity and valuation metrics, which dampen its risk profile despite low leverage. Medtronic’s main concern lies in moderate debt levels and exposure to complex global regulations but benefits from stronger profitability, liquidity, and a more favorable Altman Z-score. Medtronic demonstrates a better risk-adjusted profile, supported by a safer financial position and stronger operational resilience.
Final Verdict: Which stock to choose?
Boston Scientific’s superpower lies in its dynamic revenue and earnings growth, showcasing an ability to scale rapidly in a competitive medical devices landscape. Its main point of vigilance is the declining ROIC trend, which signals challenges in capital efficiency that investors should monitor closely. This stock suits aggressive growth portfolios seeking high momentum in innovation-driven sectors.
Medtronic offers a strategic moat through steady operational cash flow and a resilient balance sheet, supported by a slightly favorable moat rating despite value erosion. Compared to Boston Scientific, it presents a more stable cash generation profile and a moderate valuation, fitting well in GARP portfolios prioritizing balance between growth and risk.
If you prioritize rapid growth and can tolerate capital efficiency risks, Boston Scientific appears compelling due to its strong earnings momentum. However, if you seek better stability and a more balanced financial profile, Medtronic offers superior resilience and a reliable income stream, commanding a more prudent valuation premium within the medtech sector.
Disclaimer: Investment carries a risk of loss of initial capital. The past performance is not a reliable indicator of future results. Be sure to understand risks before making an investment decision.
Go Further
I encourage you to read the complete analyses of Boston Scientific Corporation and Medtronic plc to enhance your investment decisions: