Home > Comparison > Healthcare > BSX vs EW
The strategic rivalry between Boston Scientific Corporation and Edwards Lifesciences Corporation shapes the healthcare medical devices sector’s evolution. Boston Scientific operates as a diversified medical device leader with broad interventional specialties. Edwards Lifesciences focuses on advanced structural heart and critical care solutions, emphasizing minimally invasive therapies. This analysis pits Boston Scientific’s scale against Edwards’ innovation, aiming to identify which company offers a superior risk-adjusted return for a diversified healthcare portfolio.

Table of contents
Companies Overview
Boston Scientific and Edwards Lifesciences stand as pivotal players in the medical devices sector with distinct market footprints.
Boston Scientific Corporation: Diversified Medical Innovator
Boston Scientific excels as a global medical device leader, generating revenue through a broad portfolio spanning MedSurg, Rhythm and Neuro, and Cardiovascular segments. Its core strength lies in devices treating cardiac, vascular, and neurological conditions. In 2026, the company emphasizes expanding minimally invasive therapies and advanced diagnostics to solidify its competitive edge.
Edwards Lifesciences Corporation: Structural Heart Specialist
Edwards Lifesciences leads in structural heart disease solutions, focusing on transcatheter valve replacement and repair technologies. Revenue primarily derives from innovative heart valve therapies and critical care monitoring products. Edwards prioritizes enhancing minimally invasive heart treatments and critical care monitoring to capture growing demand in complex cardiac care.
Strategic Collision: Similarities & Divergences
Both companies drive innovation in medical devices, yet Boston Scientific adopts a diversified portfolio approach, while Edwards concentrates on a specialized structural heart niche. They clash chiefly in cardiovascular treatment markets, where innovation pace and clinical efficacy dominate. Their investment profiles diverge: Boston Scientific offers broad exposure to medical devices, Edwards targets high-margin, specialized cardiac interventions.
Income Statement Comparison
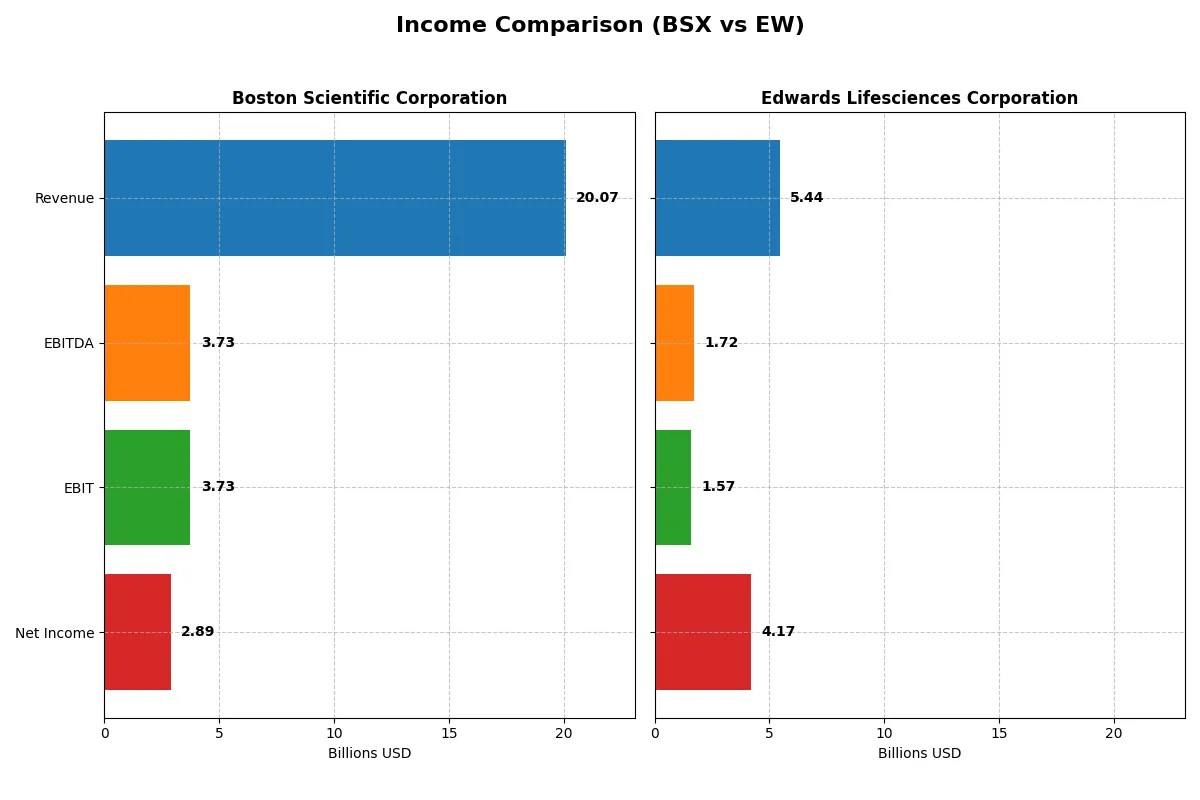
This data dissects the core profitability and scalability of both corporate engines to reveal who dominates the bottom line:
| Metric | Boston Scientific Corporation (BSX) | Edwards Lifesciences Corporation (EW) |
|---|---|---|
| Revenue | 20B | 5.44B |
| Cost of Revenue | 6.22B | 1.12B |
| Operating Expenses | 9.88B | 2.94B |
| Gross Profit | 13.85B | 4.32B |
| EBITDA | 3.73B | 1.72B |
| EBIT | 3.73B | 1.57B |
| Interest Expense | 349M | 20M |
| Net Income | 2.89B | 4.17B |
| EPS | 1.96 | 6.98 |
| Fiscal Year | 2025 | 2024 |
Income Statement Analysis: The Bottom-Line Duel
The following income statement comparison reveals which company runs a more efficient and profitable business engine in the competitive medical devices sector.
Boston Scientific Corporation Analysis
Boston Scientific shows a robust revenue climb from 12.9B in 2022 to 20.1B in 2025, reflecting a 69% growth over four years. Net income surged 177%, reaching 2.9B in 2025. Its gross margin holds steady at 69%, while net margin improves to 14.4%, signaling efficient cost control despite rising operating expenses. Momentum is clear with a 20% revenue jump and nearly 30% net margin expansion in the latest year.
Edwards Lifesciences Corporation Analysis
Edwards Lifesciences posts a smaller revenue base but strong profitability, growing revenue 24% from 4.4B in 2020 to 5.4B in 2024. Net income exploded by 407% to 4.2B in 2024, driven largely by a one-time boost from discontinued operations. The company boasts a superior gross margin near 79% and an exceptional net margin of 76.7%, far above industry norms. Earnings per share more than tripled in the last year, demonstrating powerful operational leverage.
Margin Efficiency vs. Scale Growth
Boston Scientific delivers impressive scale and steady margin improvement, growing revenues and net income at a healthy clip. Edwards Lifesciences, meanwhile, dominates margin efficiency and profitability, albeit on a smaller revenue base and with non-recurring income lifting net profits. Investors seeking robust growth with solid margins might lean toward Boston Scientific’s broad expansion, while those favoring exceptional profitability and strong earnings momentum may find Edwards more attractive.
Financial Ratios Comparison
These vital ratios act as a diagnostic tool to expose the underlying fiscal health, valuation premiums, and capital efficiency of the companies compared below:
| Ratios | Boston Scientific Corporation (BSX) | Edwards Lifesciences Corporation (EW) |
|---|---|---|
| ROE | 8.52% (2024) | 41.75% (2024) |
| ROIC | 6.13% (2024) | 10.74% (2024) |
| P/E | 70.9 (2024) | 10.6 (2024) |
| P/B | 6.04 (2024) | 4.43 (2024) |
| Current Ratio | 1.08 (2024) | 4.18 (2024) |
| Quick Ratio | 0.64 (2024) | 3.45 (2024) |
| D/E (Debt-to-Equity) | 0.51 (2024) | 0.07 (2024) |
| Debt-to-Assets | 28.3% (2024) | 5.4% (2024) |
| Interest Coverage | 6.81 (2024) | 69.6 (2024) |
| Asset Turnover | 0.43 (2024) | 0.42 (2024) |
| Fixed Asset Turnover | 4.47 (2024) | 3.05 (2024) |
| Payout Ratio | 0% (2024) | 0% (2024) |
| Dividend Yield | 0% (2024) | 0% (2024) |
| Fiscal Year | 2024 | 2024 |
Efficiency & Valuation Duel: The Vital Signs
Financial ratios serve as a company’s DNA, revealing hidden risks and operational excellence beyond surface metrics.
Boston Scientific Corporation
Boston Scientific shows modest profitability with a net margin of 14.38% but lacks return on equity and invested capital data, signaling operational challenges. Its P/E ratio at 48.91 indicates an expensive valuation. The company does not pay dividends, focusing instead on reinvesting roughly 10% of revenue into R&D for growth.
Edwards Lifesciences Corporation
Edwards Lifesciences exhibits strong profitability, boasting a 76.75% net margin and 41.75% ROE, reflecting efficient capital use. The P/E of 10.6 suggests an attractively valued stock relative to its earnings. It does not pay dividends but invests heavily in R&D at nearly 19.4% of revenue, supporting sustained innovation and expansion.
Premium Valuation vs. Operational Safety
Edwards Lifesciences offers superior profitability and a more balanced valuation compared to Boston Scientific’s stretched P/E and weaker returns. Edwards suits investors prioritizing operational efficiency and growth, while Boston Scientific’s profile fits those focused on R&D-driven reinvestment despite valuation risks.
Which one offers the Superior Shareholder Reward?
Boston Scientific (BSX) pays no meaningful dividends, with a 0% yield and payout ratio, focusing instead on moderate buybacks supported by solid free cash flow. Edwards Lifesciences (EW) also pays no dividends but invests heavily in growth, with a high gross margin and exceptional profitability. BSX’s buybacks are modest, while EW’s capital allocation emphasizes reinvestment over buybacks. Historically, EW’s superior margins and conservative leverage suggest stronger long-term value creation. I conclude Edwards Lifesciences offers a more attractive total return profile in 2026, driven by sustainable growth and reinvestment rather than immediate distributions.
Comparative Score Analysis: The Strategic Profile
The radar chart reveals the fundamental DNA and trade-offs of Boston Scientific Corporation and Edwards Lifesciences Corporation:
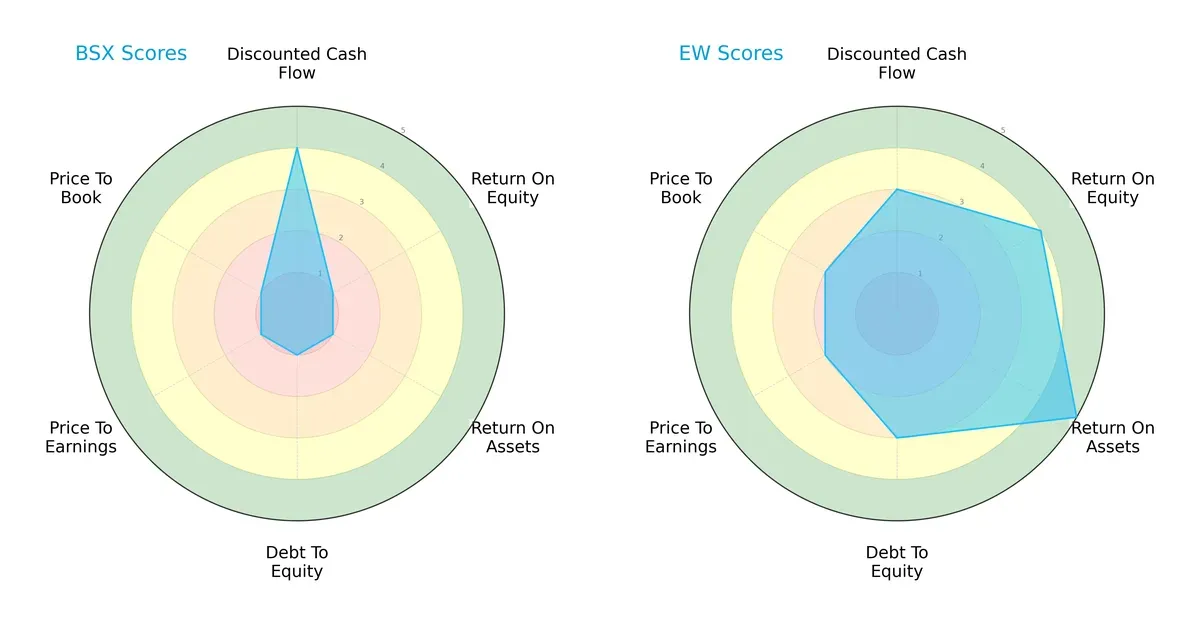
Edwards Lifesciences (EW) shows a more balanced profile with moderate to favorable scores in DCF (3), ROE (4), ROA (5), and debt/equity (3). Boston Scientific (BSX) relies heavily on its discounted cash flow strength (4) but scores very low (1) in profitability, leverage, and valuation metrics. EW’s diversified strengths suggest better operational efficiency and financial stability, while BSX’s uneven profile signals specific strategic challenges.
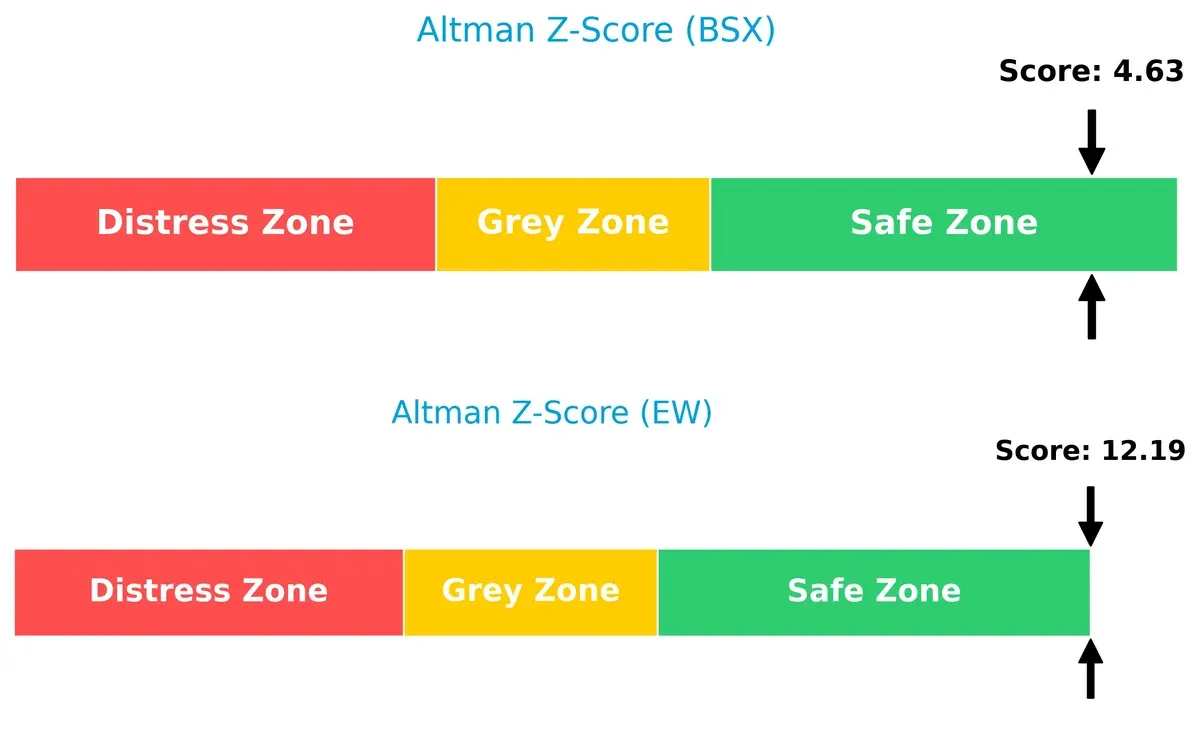
Bankruptcy Risk: Solvency Showdown
Edwards Lifesciences (12.19) significantly outperforms Boston Scientific (4.63) in Altman Z-Score, placing both in the safe zone but highlighting EW’s superior long-term solvency and lower bankruptcy risk in this cycle:
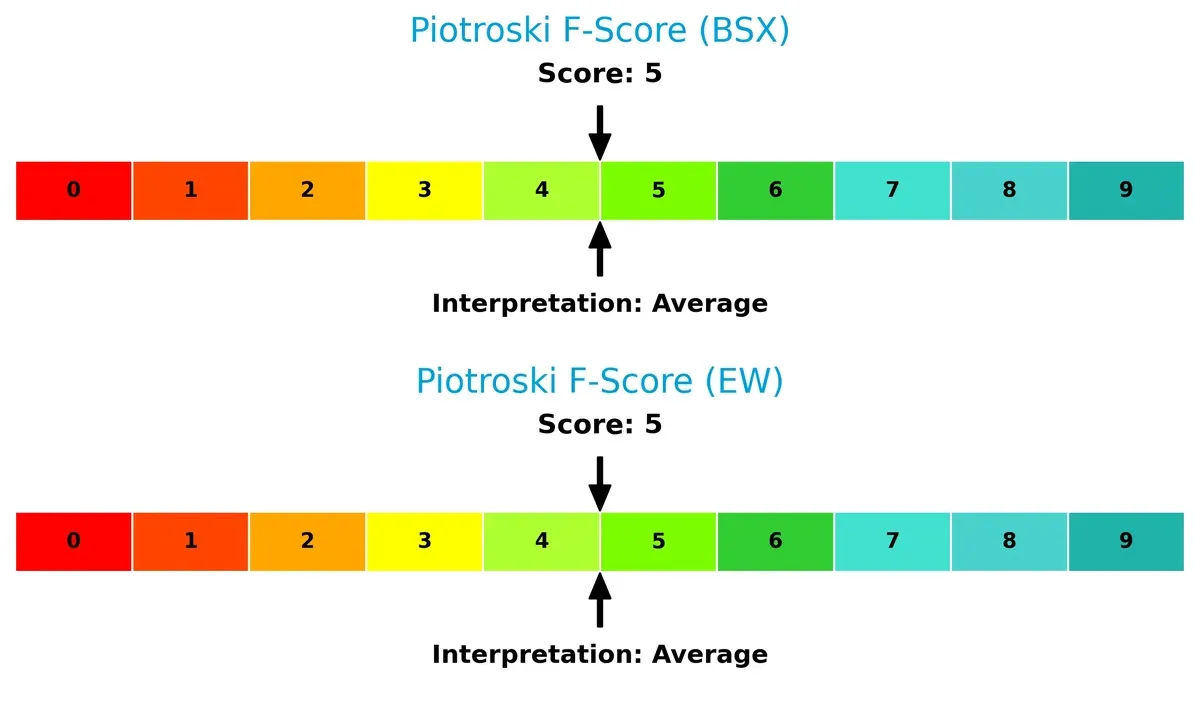
Financial Health: Quality of Operations
Both firms score equally at 5 on the Piotroski F-Score, indicating average financial health. Neither shows red flags, but this middling score suggests room for operational improvements to reach peak financial strength:
How are the two companies positioned?
This section dissects the operational DNA of BSX and EW by comparing their revenue distribution and internal dynamics. The goal is to confront their economic moats to identify the more resilient, sustainable competitive advantage today.
Revenue Segmentation: The Strategic Mix
The following visual comparison dissects how Boston Scientific and Edwards Lifesciences diversify their income streams and where their primary sector bets lie:
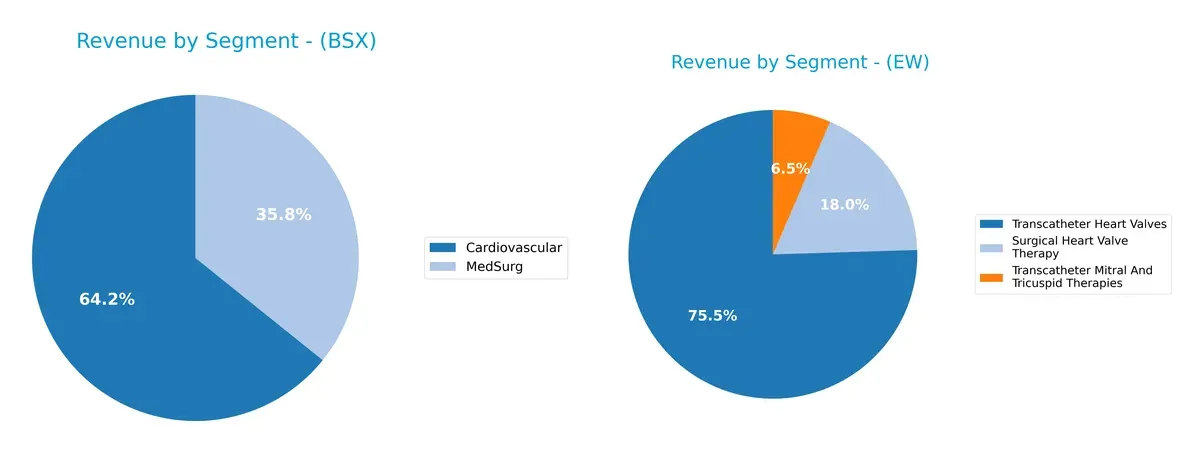
Boston Scientific anchors its revenue with a broad mix: $10.8B from Cardiovascular and $6B from MedSurg in 2024. In contrast, Edwards Lifesciences pivots heavily on Transcatheter Heart Valves, which dwarfs its other segments at $4.1B. Boston Scientific’s diversified portfolio reduces concentration risk, while Edwards leverages infrastructure dominance in a niche heart valve market, exposing itself to sector-specific volatility but benefiting from strong ecosystem lock-in.
Strengths and Weaknesses Comparison
This table compares the Strengths and Weaknesses of Boston Scientific (BSX) and Edwards Lifesciences (EW):
BSX Strengths
- Diverse revenue streams from Cardiovascular and MedSurg segments
- Significant US and Non-US geographic presence
- Favorable interest coverage ratio of 10.7
EW Strengths
- High profitability with 76.75% net margin
- Strong ROE at 41.75% and ROIC at 10.74%
- Solid quick ratio of 3.45 and low debt-to-assets at 5.36%
- Leading Transcatheter Heart Valves segment with growing revenues
BSX Weaknesses
- Unfavorable ROE and ROIC at 0%, indicating poor capital efficiency
- Poor liquidity with low current and quick ratios
- High PE ratio at 48.91 suggests possible overvaluation
- Asset turnover ratios unavailable, limiting efficiency analysis
EW Weaknesses
- Unfavorable current ratio at 4.18, indicating potential short-term liquidity risk
- Elevated PB ratio at 4.43 may imply overvaluation
- Asset turnover low at 0.42, though fixed asset turnover is strong at 3.05
Both companies show contrasting financial profiles. BSX exhibits diversification and strong interest coverage but suffers from weak profitability and liquidity metrics. EW demonstrates superior profitability and capital efficiency but faces valuation and some liquidity concerns. Each company’s strategy must address these respective financial strengths and vulnerabilities.
The Moat Duel: Analyzing Competitive Defensibility
A structural moat is the only real shield protecting long-term profits from relentless competitive erosion:
Boston Scientific Corporation: Diversified Medical Innovation Moat
Boston Scientific leverages intangible assets and product breadth to sustain margins near 18.6% EBIT. Growth in emerging markets could deepen this moat but margin pressure looms from rising costs in 2026.
Edwards Lifesciences Corporation: Precision Heart Valve Moat
Edwards dominates with specialized structural heart products, showing a stronger ROIC surplus to WACC than Boston Scientific. Despite a declining ROIC trend, it commands higher margins and aims to expand in minimally invasive therapies.
Innovation Breadth vs. Specialized Precision: The Moat Showdown
Edwards holds a slightly deeper moat with its focused premium products and value-creating capital deployment. Boston Scientific’s broader portfolio offers scale but faces tougher margin sustainability challenges. Edwards is better poised to defend its niche market share.
Which stock offers better returns?
The past year shows Boston Scientific surging 15.16%, albeit with decelerating momentum, while Edwards Lifesciences declined 14.73%, also slowing its downward trend.
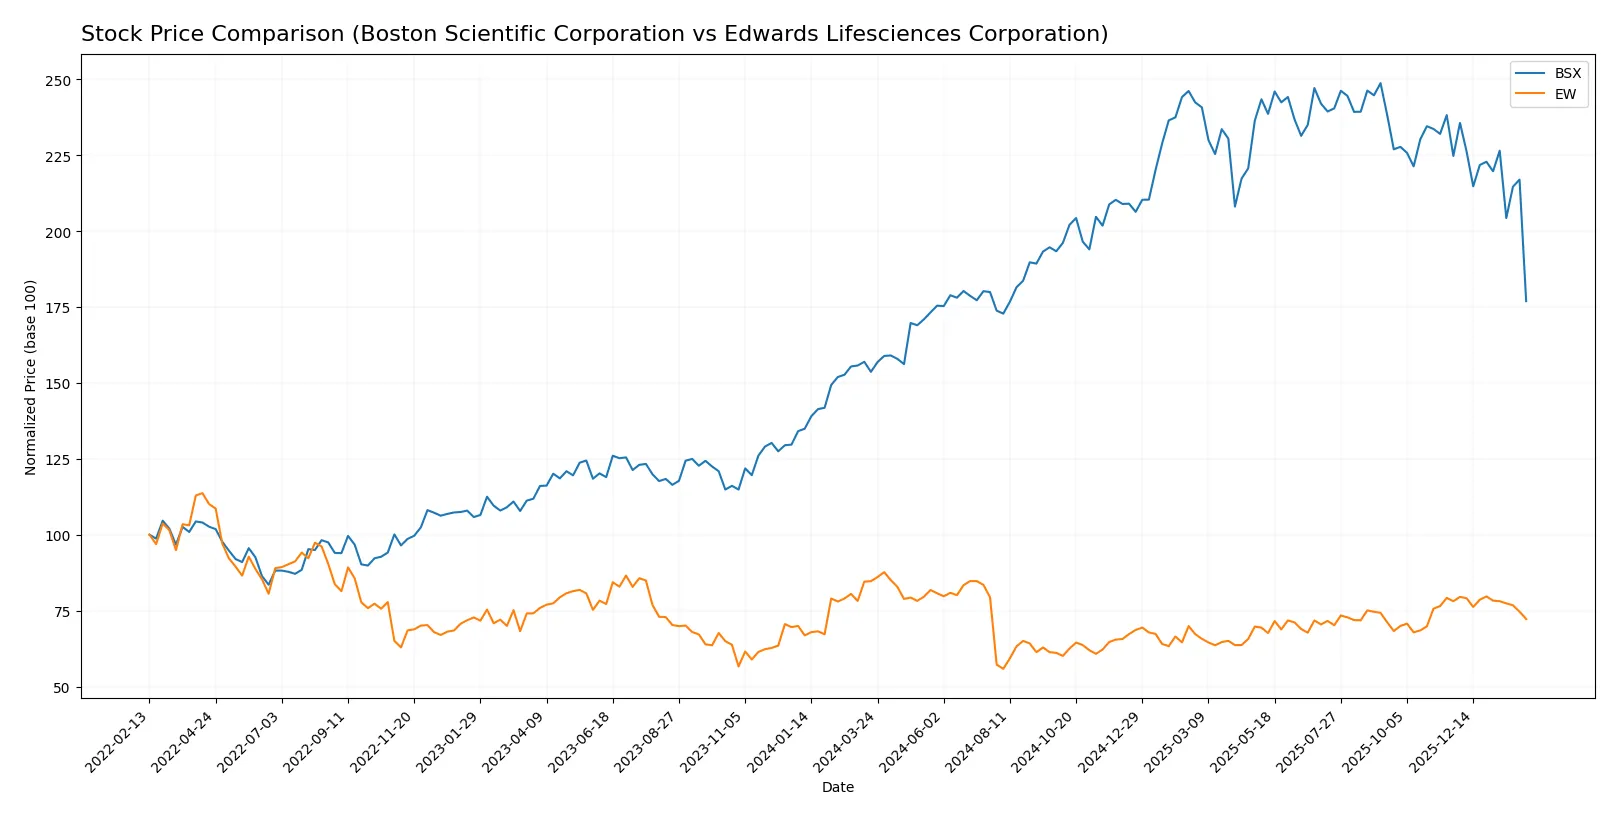
Trend Comparison
Boston Scientific’s stock rose 15.16% over the last 12 months, marking a bullish trend with decelerating gains. It hit a high of 107.22 and a low of 66.23, showing notable volatility with an 11.87 standard deviation.
Edwards Lifesciences declined 14.73% over the same period, indicating a bearish trend with decelerating losses. The stock ranged between 95.56 and 60.83, with lower volatility measured by an 8.12 standard deviation.
Comparing the two, Boston Scientific outperformed Edwards Lifesciences, delivering the highest market returns with a clear bullish trajectory relative to Edwards’ bearish trend.
Target Prices
Analysts present a cautiously optimistic target consensus for Boston Scientific and Edwards Lifesciences.
| Company | Target Low | Target High | Consensus |
|---|---|---|---|
| Boston Scientific Corporation | 94 | 130 | 108.53 |
| Edwards Lifesciences Corporation | 87 | 110 | 97.25 |
Boston Scientific’s consensus target of 108.53 suggests a 42% upside from the current 76.27 price. Edwards Lifesciences shows a 24% potential rise from 78.71 to its 97.25 consensus.

Don’t Let Luck Decide Your Entry Point
Optimize your entry points with our advanced ProRealTime indicators. You’ll get efficient buy signals with precise price targets for maximum performance. Start outperforming now!
How do institutions grade them?
Boston Scientific Corporation Grades
The following table summarizes recent grades from major financial institutions for Boston Scientific Corporation:
| Grading Company | Action | New Grade | Date |
|---|---|---|---|
| Canaccord Genuity | Maintain | Buy | 2026-02-05 |
| RBC Capital | Maintain | Outperform | 2026-02-05 |
| JP Morgan | Maintain | Overweight | 2026-02-05 |
| Citigroup | Maintain | Buy | 2026-02-05 |
| TD Cowen | Maintain | Buy | 2026-02-05 |
| UBS | Maintain | Buy | 2026-02-05 |
| Evercore ISI Group | Maintain | Outperform | 2026-02-05 |
| Morgan Stanley | Maintain | Overweight | 2026-02-05 |
| Truist Securities | Maintain | Buy | 2026-02-05 |
| Needham | Maintain | Buy | 2026-02-05 |
Edwards Lifesciences Corporation Grades
Below is a summary of recent institutional grades for Edwards Lifesciences Corporation:
| Grading Company | Action | New Grade | Date |
|---|---|---|---|
| Stifel | Maintain | Buy | 2026-01-20 |
| Piper Sandler | Maintain | Overweight | 2026-01-20 |
| Barclays | Maintain | Overweight | 2026-01-12 |
| UBS | Maintain | Neutral | 2026-01-12 |
| TD Cowen | Upgrade | Buy | 2026-01-09 |
| Stifel | Maintain | Buy | 2026-01-07 |
| JP Morgan | Upgrade | Overweight | 2025-12-18 |
| Canaccord Genuity | Maintain | Hold | 2025-12-17 |
| Baird | Maintain | Neutral | 2025-12-16 |
| Citigroup | Maintain | Buy | 2025-12-11 |
Which company has the best grades?
Boston Scientific holds consistently positive grades, mostly Buy and Outperform, from multiple institutions. Edwards Lifesciences shows more variation, including Neutral and Hold ratings, despite some upgrades. Investors might interpret Boston Scientific’s uniform bullish outlook as stronger institutional confidence.
Risks specific to each company
The following categories identify critical pressure points and systemic threats facing both firms in the 2026 market environment:
1. Market & Competition
Boston Scientific Corporation (BSX)
- Faces intense competition in diversified medical device segments, pressuring margins and innovation demands.
Edwards Lifesciences Corporation (EW)
- Focuses on niche structural heart market with strong product differentiation but faces emerging rivals.
2. Capital Structure & Debt
Boston Scientific Corporation (BSX)
- Maintains low debt with strong interest coverage, indicating prudent leverage management.
Edwards Lifesciences Corporation (EW)
- Shows low debt-to-equity ratio and very high interest coverage, reflecting robust financial stability.
3. Stock Volatility
Boston Scientific Corporation (BSX)
- Beta of 0.66 indicates below-market volatility, providing relative price stability.
Edwards Lifesciences Corporation (EW)
- Beta near 0.94 shows moderately higher volatility, closer to overall market risk.
4. Regulatory & Legal
Boston Scientific Corporation (BSX)
- Exposed to regulatory risks across multiple medical specialties and global markets.
Edwards Lifesciences Corporation (EW)
- Faces regulatory scrutiny mainly on innovative heart valve products and critical care devices.
5. Supply Chain & Operations
Boston Scientific Corporation (BSX)
- Complex global supply chain with broad product range increases operational risks.
Edwards Lifesciences Corporation (EW)
- More focused product lineup reduces supply chain complexity but limits diversification.
6. ESG & Climate Transition
Boston Scientific Corporation (BSX)
- Large employee base and manufacturing footprint require aggressive ESG management.
Edwards Lifesciences Corporation (EW)
- Smaller workforce and targeted production may ease climate transition challenges.
7. Geopolitical Exposure
Boston Scientific Corporation (BSX)
- Global operations expose it to international trade tensions and currency risks.
Edwards Lifesciences Corporation (EW)
- Also global but less diversified, potentially more vulnerable to regional disruptions.
Which company shows a better risk-adjusted profile?
Edwards Lifesciences faces concentrated market risk but shows superior financial health and stability. Boston Scientific grapples with broader operational complexity and weaker financial ratios. Edwards’ strong capital structure and higher profitability yield a better risk-adjusted profile. Boston Scientific’s elevated valuation and weaker returns raise caution.
Final Verdict: Which stock to choose?
Boston Scientific’s superpower lies in its robust income growth and expanding net margins, marking it as a cash-generating machine in a competitive sector. However, its declining ROIC and mixed financial health serve as a point of vigilance. It fits an aggressive growth portfolio willing to accept near-term volatility for long-term upside.
Edwards Lifesciences commands a strategic moat through its impressive return on equity and strong capital efficiency, underpinned by a solid balance sheet and recurring revenue safety. Its financial profile offers better stability compared to Boston Scientific, suiting a GARP (Growth at a Reasonable Price) investor focused on sustainable profitability.
If you prioritize high-growth potential and can tolerate swings, Boston Scientific is compelling due to its dynamic income trajectory. However, if you seek superior financial stability and a proven moat, Edwards Lifesciences outshines as a more prudent choice, despite commanding a premium valuation. Both present distinct analytical scenarios depending on your appetite for growth versus stability.
Disclaimer: Investment carries a risk of loss of initial capital. The past performance is not a reliable indicator of future results. Be sure to understand risks before making an investment decision.
Go Further
I encourage you to read the complete analyses of Boston Scientific Corporation and Edwards Lifesciences Corporation to enhance your investment decisions: