Home > Comparison > Healthcare > BSX vs DXCM
The strategic rivalry between Boston Scientific Corporation and DexCom, Inc. shapes the evolution of the healthcare medical devices sector. Boston Scientific operates as a capital-intensive industrial giant with broad interventional specialties. DexCom focuses on high-margin, innovative continuous glucose monitoring technologies. This analysis pits Boston Scientific’s diversified scale against DexCom’s specialized growth. I aim to identify which trajectory offers superior risk-adjusted returns for a well-diversified portfolio in healthcare.

Table of contents
Companies Overview
Boston Scientific and DexCom dominate distinct niches within the medical device industry, shaping healthcare innovation.
Boston Scientific Corporation: Global Medical Device Powerhouse
Boston Scientific commands the interventional medical devices market with a diverse portfolio spanning cardiovascular, neuro, and MedSurg segments. Its core revenue stems from devices treating heart rhythm disorders, arterial diseases, and chronic pain management. In 2026, the company emphasizes expanding minimally invasive therapies, reinforcing its broad clinical reach and market leadership.
DexCom, Inc.: Leader in Continuous Glucose Monitoring
DexCom specializes in continuous glucose monitoring (CGM) systems, targeting diabetes management worldwide. Its revenue engine relies on advanced CGM devices like the G6 and G7 systems, integrating real-time data with digital health platforms. The firm focuses on product innovation and strategic partnerships to enhance diabetes care and expand its global footprint this year.
Strategic Collision: Similarities & Divergences
Both companies innovate in medical devices but differ fundamentally: Boston Scientific offers a broad-based device portfolio, while DexCom zeroes in on diabetes-specific CGM technology. They compete indirectly in healthcare technology but battle for dominance in device-driven patient management. Their distinct strategies create contrasting investment profiles—Boston Scientific’s diversification versus DexCom’s focused growth in a niche market.
Income Statement Comparison
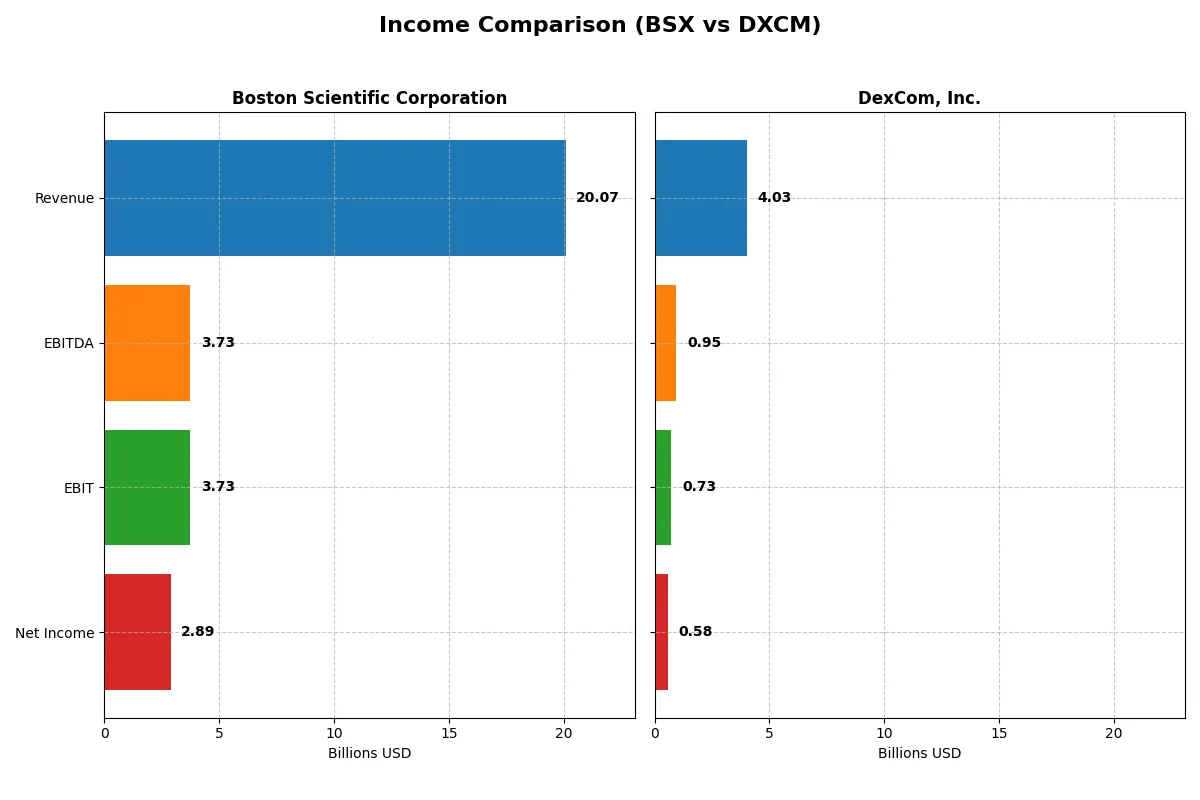
The following data dissects the core profitability and scalability of both corporate engines to reveal who dominates the bottom line:
| Metric | Boston Scientific Corporation (BSX) | DexCom, Inc. (DXCM) |
|---|---|---|
| Revenue | 20B | 4B |
| Cost of Revenue | 6.2B | 1.6B |
| Operating Expenses | 9.9B | 1.8B |
| Gross Profit | 13.9B | 2.4B |
| EBITDA | 3.7B | 946M |
| EBIT | 3.7B | 728M |
| Interest Expense | 349M | 19M |
| Net Income | 2.9B | 577M |
| EPS | 1.96 | 1.46 |
| Fiscal Year | 2025 | 2024 |
Income Statement Analysis: The Bottom-Line Duel
This income statement comparison reveals how efficiently each company converts revenue into profit amid dynamic market conditions.
Boston Scientific Corporation Analysis
Boston Scientific grew revenue from 11.9B in 2021 to 20.1B in 2025, with net income surging from 985M to 2.9B. Gross margin expanded to a strong 69%, while net margin rose to 14.4%, reflecting improved cost control. The 2025 jump in earnings per share (+55%) signals robust operational momentum and capital discipline.
DexCom, Inc. Analysis
DexCom doubled revenue from 1.9B in 2020 to 4.0B in 2024, but net income only advanced modestly from 493M to 576M. Gross margin sits at a healthy 60%, with net margin near 14.3%. However, EBIT and net margin declined slightly in 2024, indicating margin pressure despite top-line growth and stable R&D investment.
Growth Dominance vs. Margin Resilience
Boston Scientific clearly outpaces DexCom in net income growth and margin expansion, reflecting superior operational leverage. DexCom shows impressive revenue scaling but faces margin headwinds. Investors favor Boston Scientific’s profile for sustained profitability and accelerating earnings, while DexCom offers growth tempered by profit margin challenges.
Financial Ratios Comparison
These vital ratios act as a diagnostic tool to expose the underlying fiscal health, valuation premiums, and capital efficiency of the companies compared below:
| Ratios | Boston Scientific (BSX) | DexCom (DXCM) |
|---|---|---|
| ROE | 8.5% (2024) | 27.4% (2024) |
| ROIC | 6.1% (2024) | 10.2% (2024) |
| P/E | 70.9x (2024) | 54.6x (2024) |
| P/B | 6.0x (2024) | 15.0x (2024) |
| Current Ratio | 1.08 (2024) | 1.47 (2024) |
| Quick Ratio | 0.64 (2024) | 1.28 (2024) |
| D/E | 0.51 (2024) | 1.23 (2024) |
| Debt-to-Assets | 28.3% (2024) | 39.9% (2024) |
| Interest Coverage | 6.8x (2024) | 31.6x (2024) |
| Asset Turnover | 0.43 (2024) | 0.62 (2024) |
| Fixed Asset Turnover | 4.47 (2024) | 2.88 (2024) |
| Payout ratio | 0% (2024) | 0% (2024) |
| Dividend yield | 0% (2024) | 0% (2024) |
| Fiscal Year | 2024 | 2024 |
Efficiency & Valuation Duel: The Vital Signs
Ratios act as a company’s financial DNA, uncovering hidden risks and operational excellence beneath surface numbers. They reveal how well firms generate returns and how markets value their growth and stability.
Boston Scientific Corporation
Boston Scientific posts a solid net margin of 14.38%, but its ROE and ROIC are unfavorable and effectively zero, signaling weak core profitability. The stock trades at a stretched P/E of 48.91, reflecting high valuation risks. It offers no dividends, instead reinvesting heavily in R&D, dedicating about 10% of revenue to innovation.
DexCom, Inc.
DexCom delivers strong profitability with a 27.4% ROE and a 10.2% ROIC, supported by a comparable net margin near 14.3%. Yet, its valuation remains expensive, with a P/E of 54.61 and a high P/B of 14.97. DexCom does not pay dividends, focusing on aggressive growth fueled by substantial R&D spending of nearly 14% of revenue.
Valuation Stretch vs. Profitability Strength
DexCom offers superior profitability and operational efficiency but at a higher valuation premium compared to Boston Scientific. Boston Scientific’s reinvestment focus contrasts with DexCom’s robust returns, presenting a trade-off between growth potential and valuation risk. Investors seeking growth at a premium may prefer DexCom, while those wary of stretched multiples might lean toward Boston Scientific’s profile.
Which one offers the Superior Shareholder Reward?
Boston Scientific (BSX) pays no meaningful dividend but focuses on share repurchases fueled by solid free cash flow, sustaining a payout ratio near zero. DexCom (DXCM) also forgoes dividends, reinvesting heavily in growth with modest buybacks. BSX’s distribution model, supported by steady free cash flow and conservative leverage, offers a more sustainable total return profile. I believe BSX provides the superior shareholder reward in 2026 due to its balanced capital allocation and disciplined buyback intensity, unlike DXCM’s growth-heavy reinvestment with higher valuation multiples.
Comparative Score Analysis: The Strategic Profile
The radar chart reveals the fundamental DNA and trade-offs of Boston Scientific Corporation and DexCom, Inc., highlighting their distinct financial strengths and weaknesses:
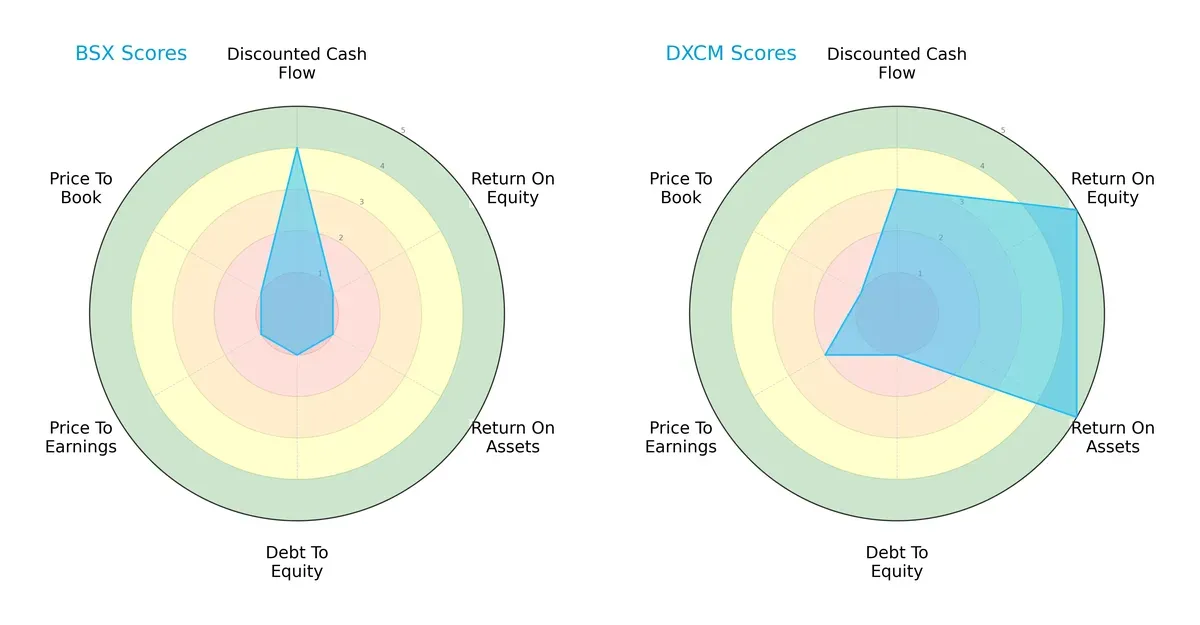
DexCom excels with very favorable ROE and ROA scores (5 each), indicating efficient profit generation and asset use. Boston Scientific lags with very unfavorable scores (1) in these areas. Both firms share very unfavorable debt-to-equity and valuation scores, signaling leverage and pricing challenges. Boston Scientific’s strength lies mainly in its favorable DCF score (4), while DexCom maintains a more balanced profile overall.
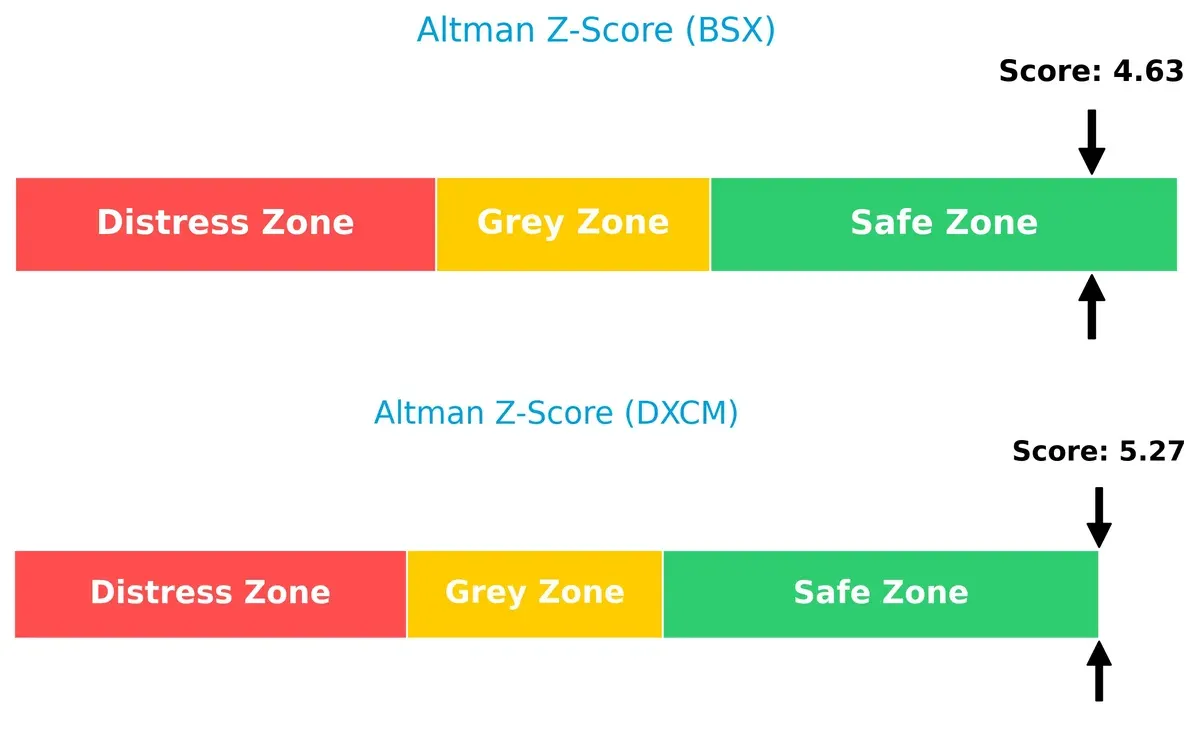
Bankruptcy Risk: Solvency Showdown
DexCom’s Altman Z-Score of 5.27 versus Boston Scientific’s 4.63 places both firms securely in the safe zone, implying strong solvency and low bankruptcy risk this cycle:
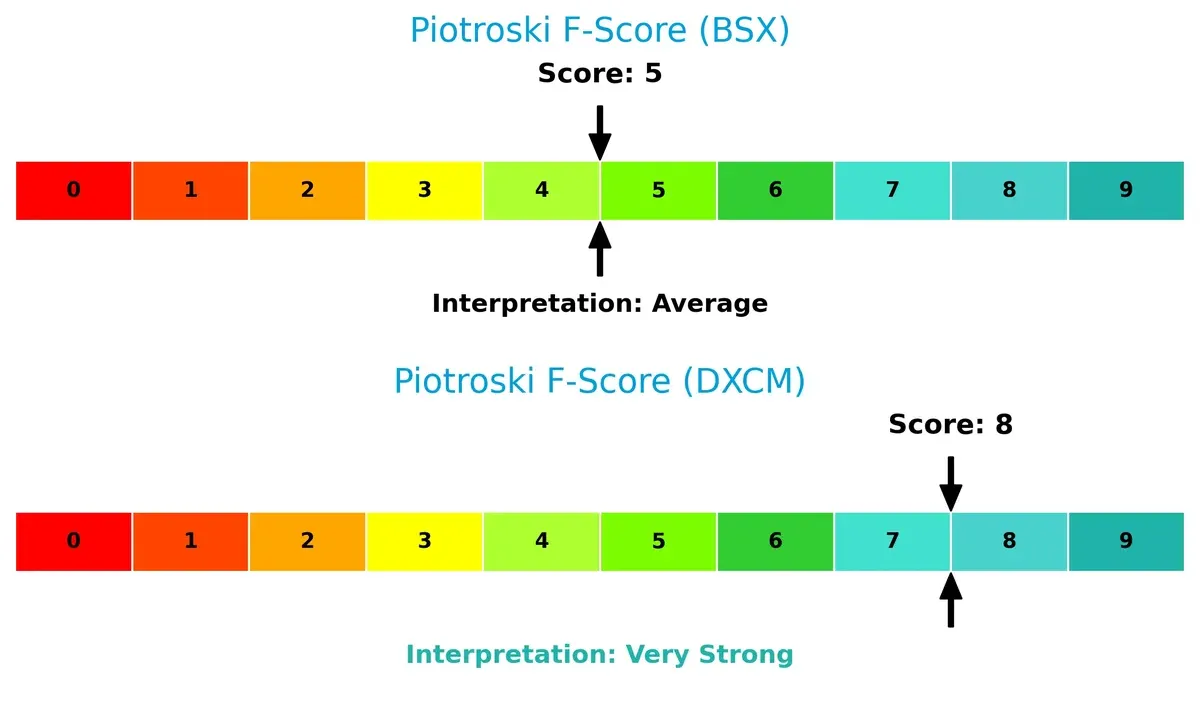
Financial Health: Quality of Operations
DexCom’s Piotroski F-Score of 8 reflects very strong financial health, outperforming Boston Scientific’s average score of 5. DexCom demonstrates superior internal metrics, while Boston Scientific shows moderate concerns in operational quality:
How are the two companies positioned?
This section dissects BSX and DXCM’s operational DNA by comparing their revenue distribution and internal dynamics, including strengths and weaknesses. The final goal is to confront their economic moats to identify which model offers the most resilient and sustainable competitive advantage today.
Revenue Segmentation: The Strategic Mix
The following visual comparison dissects how Boston Scientific Corporation and DexCom, Inc. diversify their income streams and highlights their primary sector bets:
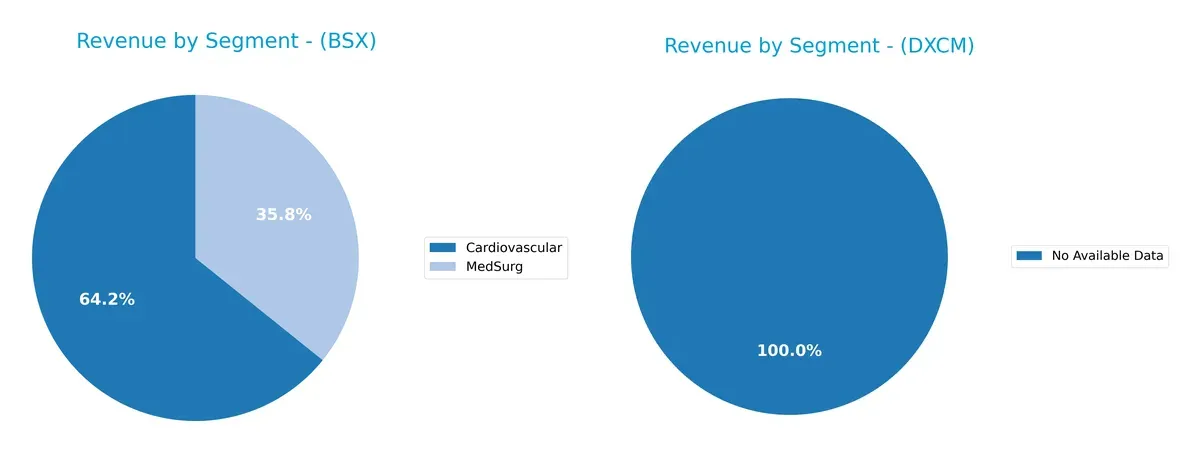
Boston Scientific anchors its revenue in Cardiovascular at $10.8B (2024), supported by $6B from MedSurg, showcasing a moderately diversified mix. DexCom lacks segment data, preventing direct comparison. Boston Scientific’s reliance on Cardiovascular signals ecosystem lock-in and infrastructure dominance, but concentration risk remains elevated without broader diversification. This contrasts with firms spreading revenue across multiple high-growth segments to mitigate volatility.
Strengths and Weaknesses Comparison
This table compares the Strengths and Weaknesses of Boston Scientific Corporation (BSX) and DexCom, Inc. (DXCM):
BSX Strengths
- Diverse product segments including Cardiovascular and MedSurg
- Strong US and Non-US revenue streams
- Favorable net margin and interest coverage
- Low debt-to-assets ratio indicates financial stability
DXCM Strengths
- Favorable net margin, ROE, and ROIC demonstrate efficient profitability
- Strong interest coverage supports debt servicing
- Balanced current and quick ratios indicate liquidity strength
BSX Weaknesses
- Unfavorable ROE and ROIC suggest low capital efficiency
- Unavailable WACC limits cost of capital assessment
- Unfavorable P/E ratio and liquidity ratios raise valuation and solvency concerns
- Absence of dividend yield
DXCM Weaknesses
- Unfavorable WACC and high P/E, P/B ratios indicate valuation risks
- Elevated debt-to-equity weakens financial leverage
- No dividend yield limits income appeal
BSX benefits from a broad product and geographic base but struggles with capital efficiency and liquidity. DXCM shows strong profitability metrics but faces valuation and leverage challenges. Both companies exhibit areas requiring strategic focus to enhance financial health.
The Moat Duel: Analyzing Competitive Defensibility
A structural moat is the only shield protecting long-term profits from relentless competitive erosion. Let’s dissect the moats of Boston Scientific and DexCom:
Boston Scientific Corporation: Intangible Assets and Scale Moat
Boston Scientific leverages vast product diversification and global scale. Its stable 18.6% EBIT margin reflects robust pricing power and operational efficiency. Expansion into neuro and cardiovascular markets in 2026 could deepen this intangible asset moat.
DexCom, Inc.: Innovation-Driven Network Effects
DexCom’s moat centers on continuous glucose monitoring technology and ecosystem integration with digital health platforms. Despite narrower margins than Boston Scientific, its growing ROIC signals improving capital efficiency. The rollout of next-gen CGM systems in 2026 may accelerate market disruption.
Verdict: Diversified Scale vs. Innovation Network
Boston Scientific’s broader product portfolio and international reach form a wider moat. DexCom’s growing ROIC and innovation create a deeper, but narrower, competitive edge. Boston Scientific is better positioned to defend market share through scale; DexCom bets on technological leadership to expand.
Which stock offers better returns?
The past year reveals divergent stock trajectories: Boston Scientific posts solid gains with slowing momentum, while DexCom suffers steep losses despite recent recovery signs.
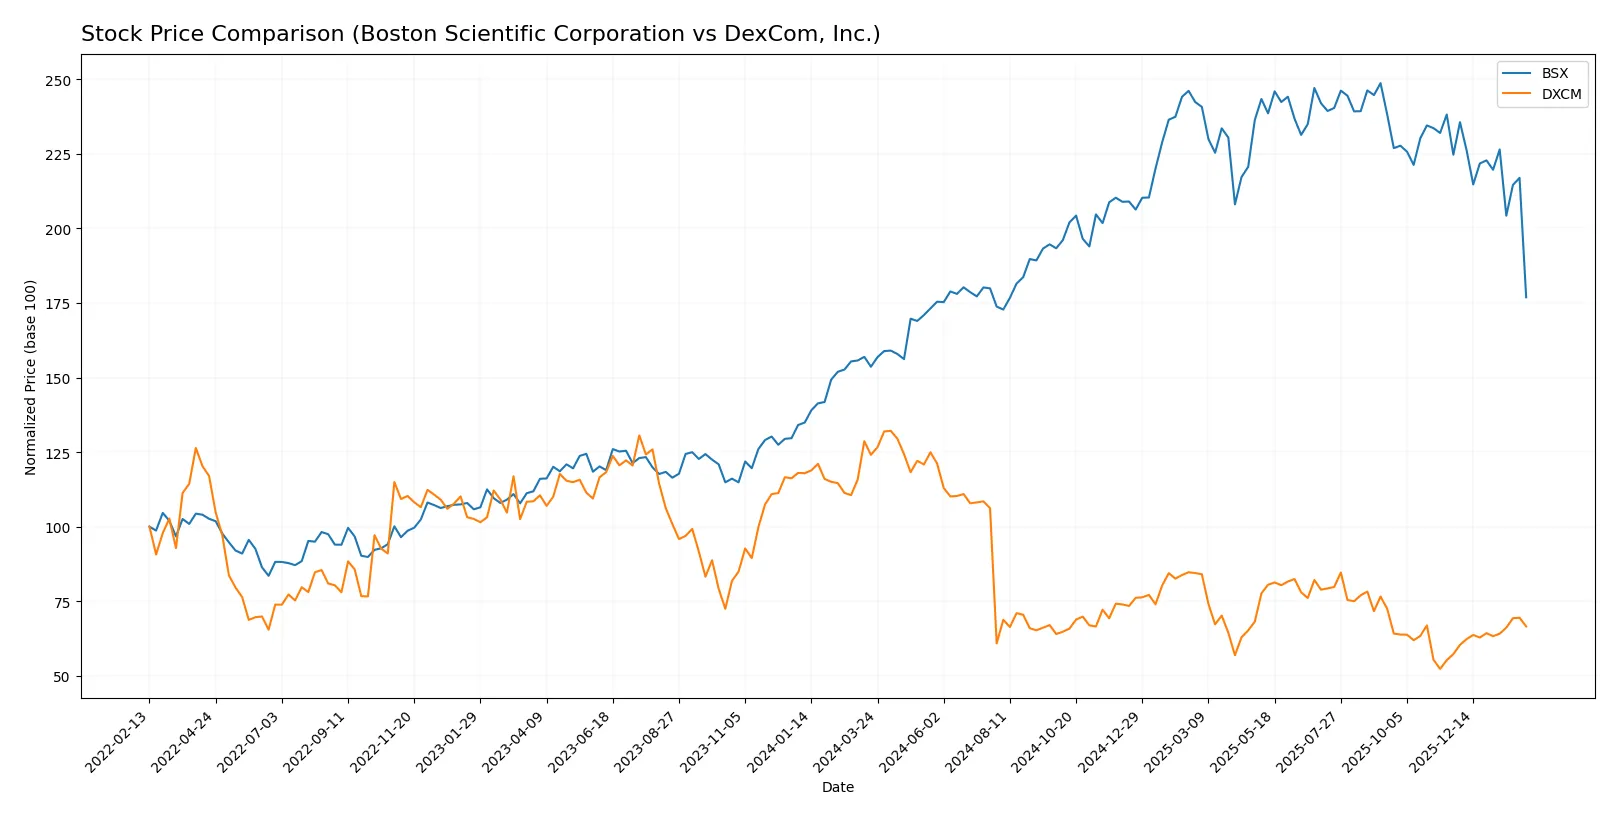
Trend Comparison
Boston Scientific’s stock rose 15.16% over the past 12 months, marking a bullish trend with decelerating momentum. It peaked at 107.22 and troughed at 66.23, showing moderate volatility (11.87 std dev).
DexCom’s stock fell 46.37% over the same period, confirming a bearish trend amid accelerating losses. Its price ranged from 138.93 down to 55.00, with high volatility (21.43 std dev).
Boston Scientific outperformed DexCom overall, delivering positive returns versus a substantial decline, despite DexCom’s recent partial recovery.
Target Prices
Analysts present a cautiously optimistic consensus on Boston Scientific Corporation and DexCom, Inc.
| Company | Target Low | Target High | Consensus |
|---|---|---|---|
| Boston Scientific Corporation | 94 | 130 | 108.53 |
| DexCom, Inc. | 71 | 99 | 84.55 |
The target consensus for Boston Scientific suggests a potential upside of approximately 42% from its current 76.27 price. DexCom’s targets imply a roughly 21% appreciation from its 69.97 price. Both companies reflect positive analyst expectations versus current market prices.

Don’t Let Luck Decide Your Entry Point
Optimize your entry points with our advanced ProRealTime indicators. You’ll get efficient buy signals with precise price targets for maximum performance. Start outperforming now!
How do institutions grade them?
Boston Scientific Corporation Grades
The latest institutional grades for Boston Scientific Corporation are summarized below:
| Grading Company | Action | New Grade | Date |
|---|---|---|---|
| Canaccord Genuity | Maintain | Buy | 2026-02-05 |
| RBC Capital | Maintain | Outperform | 2026-02-05 |
| JP Morgan | Maintain | Overweight | 2026-02-05 |
| Citigroup | Maintain | Buy | 2026-02-05 |
| TD Cowen | Maintain | Buy | 2026-02-05 |
| UBS | Maintain | Buy | 2026-02-05 |
| Evercore ISI Group | Maintain | Outperform | 2026-02-05 |
| Morgan Stanley | Maintain | Overweight | 2026-02-05 |
| Truist Securities | Maintain | Buy | 2026-02-05 |
| Needham | Maintain | Buy | 2026-02-05 |
DexCom, Inc. Grades
The institutional grades for DexCom, Inc. are presented in the following table:
| Grading Company | Action | New Grade | Date |
|---|---|---|---|
| Barclays | Downgrade | Underweight | 2026-01-12 |
| Bernstein | Maintain | Outperform | 2026-01-09 |
| Mizuho | Maintain | Outperform | 2025-12-17 |
| Citigroup | Maintain | Buy | 2025-12-11 |
| Morgan Stanley | Upgrade | Overweight | 2025-12-02 |
| Morgan Stanley | Maintain | Equal Weight | 2025-11-10 |
| Argus Research | Maintain | Buy | 2025-11-07 |
| UBS | Maintain | Buy | 2025-11-03 |
| Barclays | Maintain | Equal Weight | 2025-11-03 |
| Truist Securities | Maintain | Buy | 2025-11-03 |
Which company has the best grades?
Boston Scientific consistently receives strong buy and outperform ratings, signaling robust institutional confidence. DexCom’s grades are more mixed, including a recent downgrade to underweight. Investors may view Boston Scientific’s stronger consensus grades as a positive indicator of market sentiment and stability.
Risks specific to each company
The following categories identify the critical pressure points and systemic threats facing both firms in the 2026 market environment:
1. Market & Competition
Boston Scientific Corporation
- Faces intense competition in diversified medical device segments, requiring constant innovation and market share defense.
DexCom, Inc.
- Operates in niche CGM market but confronts rising competition from established and emerging diabetes tech players.
2. Capital Structure & Debt
Boston Scientific Corporation
- Demonstrates a conservative debt profile with favorable debt-to-equity and interest coverage ratios, reducing financial risk.
DexCom, Inc.
- Exhibits higher leverage with debt-to-equity at 1.23, posing moderate financial risk despite strong interest coverage.
3. Stock Volatility
Boston Scientific Corporation
- Beta of 0.657 signals lower volatility, appealing for risk-averse investors in a turbulent market.
DexCom, Inc.
- Beta of 1.488 indicates higher volatility, reflecting sensitivity to broader market swings and sector-specific news.
4. Regulatory & Legal
Boston Scientific Corporation
- Subject to stringent FDA approvals across multiple device lines, heightening regulatory compliance costs and litigation risks.
DexCom, Inc.
- Faces regulatory scrutiny on CGM accuracy and data privacy, critical for sustained market trust and growth.
5. Supply Chain & Operations
Boston Scientific Corporation
- Complex global supply chain risks exacerbated by geopolitical tensions and component shortages.
DexCom, Inc.
- Relies on specialized components; supply chain disruptions could delay product launches and impair revenue.
6. ESG & Climate Transition
Boston Scientific Corporation
- Increasing pressure to align with ESG standards, especially in waste management and energy use in manufacturing.
DexCom, Inc.
- Emerging focus on sustainable practices but lags behind peers in formal ESG disclosures and climate strategy.
7. Geopolitical Exposure
Boston Scientific Corporation
- Broad international footprint exposes it to global trade uncertainties and currency fluctuations.
DexCom, Inc.
- More concentrated US market exposure reduces geopolitical risk but limits growth opportunities abroad.
Which company shows a better risk-adjusted profile?
DexCom’s main risk is high leverage, raising financial vulnerability despite strong profitability and operational efficiency. Boston Scientific struggles with regulatory complexity and weaker financial returns, despite lower debt risk. I view DexCom as having a superior risk-adjusted profile, bolstered by a safer Altman Z-Score (5.27 vs. 4.63) and a markedly higher Piotroski Score (8 vs. 5), signaling stronger financial health and operational resilience. Boston Scientific’s zero ROE and ROIC alongside unfavorable valuation metrics underscore caution.
Final Verdict: Which stock to choose?
Boston Scientific Corporation (BSX) impresses with its ability to generate strong income growth and maintain a solid net margin. Its superpower lies in expanding revenue and earnings while investing heavily in R&D. However, its declining ROIC trend signals a point of vigilance. BSX suits investors seeking aggressive growth with an appetite for balance sheet risk.
DexCom, Inc. (DXCM) leverages a strategic moat through innovative diabetes management technology and a steadily improving ROIC, reflecting growing profitability. It offers better financial stability compared to BSX, supported by strong return metrics and healthier liquidity. DXCM fits well in GARP portfolios favoring growth balanced with reasonable financial discipline.
If you prioritize rapid earnings expansion and innovation-driven growth, BSX is the compelling choice due to its robust income growth and aggressive R&D investment. However, if you seek a blend of growth with improving capital efficiency and greater financial stability, DXCM offers better stability and a rising ROIC trend, though it commands a premium valuation. Both present distinct analytical scenarios depending on your risk tolerance and strategy.
Disclaimer: Investment carries a risk of loss of initial capital. The past performance is not a reliable indicator of future results. Be sure to understand risks before making an investment decision.
Go Further
I encourage you to read the complete analyses of Boston Scientific Corporation and DexCom, Inc. to enhance your investment decisions: