Home > Comparison > Consumer Cyclical > BKNG vs RCL
The strategic rivalry between Booking Holdings Inc. and Royal Caribbean Cruises Ltd. shapes the future of the travel services sector. Booking operates a capital-light, high-tech platform model focused on online reservations and price comparison. Royal Caribbean runs a capital-intensive cruise line business with extensive physical assets and global itineraries. This analysis evaluates which approach offers superior risk-adjusted returns amid evolving consumer travel trends and economic cycles.

Table of contents
Companies Overview
Booking Holdings Inc. and Royal Caribbean Cruises Ltd. stand as giants in the global travel services industry. Their distinct approaches shape consumer experiences worldwide.
Booking Holdings Inc.: Digital Travel Reservation Leader
Booking Holdings dominates online travel services by offering accommodation, car rentals, and flight bookings through platforms like Booking.com and Priceline. Its core revenue stems from commissions and fees on reservations. In 2026, the company focuses on expanding its digital ecosystem and integrating travel-related insurance and restaurant booking services to enhance customer convenience.
Royal Caribbean Cruises Ltd.: Premier Cruise Operator
Royal Caribbean Cruises commands the cruise vacation market with a fleet of 61 ships across multiple brands, serving about 1,000 destinations. Revenue primarily comes from cruise fares, onboard spending, and premium experiences. Its 2026 strategy emphasizes fleet modernization and diversified itineraries to capture growing demand for luxury and experiential travel.
Strategic Collision: Similarities & Divergences
Both companies thrive in consumer cyclical travel services but diverge sharply in delivery—Booking Holdings operates a digital platform ecosystem, while Royal Caribbean relies on physical assets and experiential offerings. Their battleground lies in capturing discretionary travel spending amid shifting consumer preferences. Booking Holdings appeals to tech-savvy planners, whereas Royal Caribbean targets experience-driven travelers, reflecting distinct risk profiles and capital intensity.
Income Statement Comparison
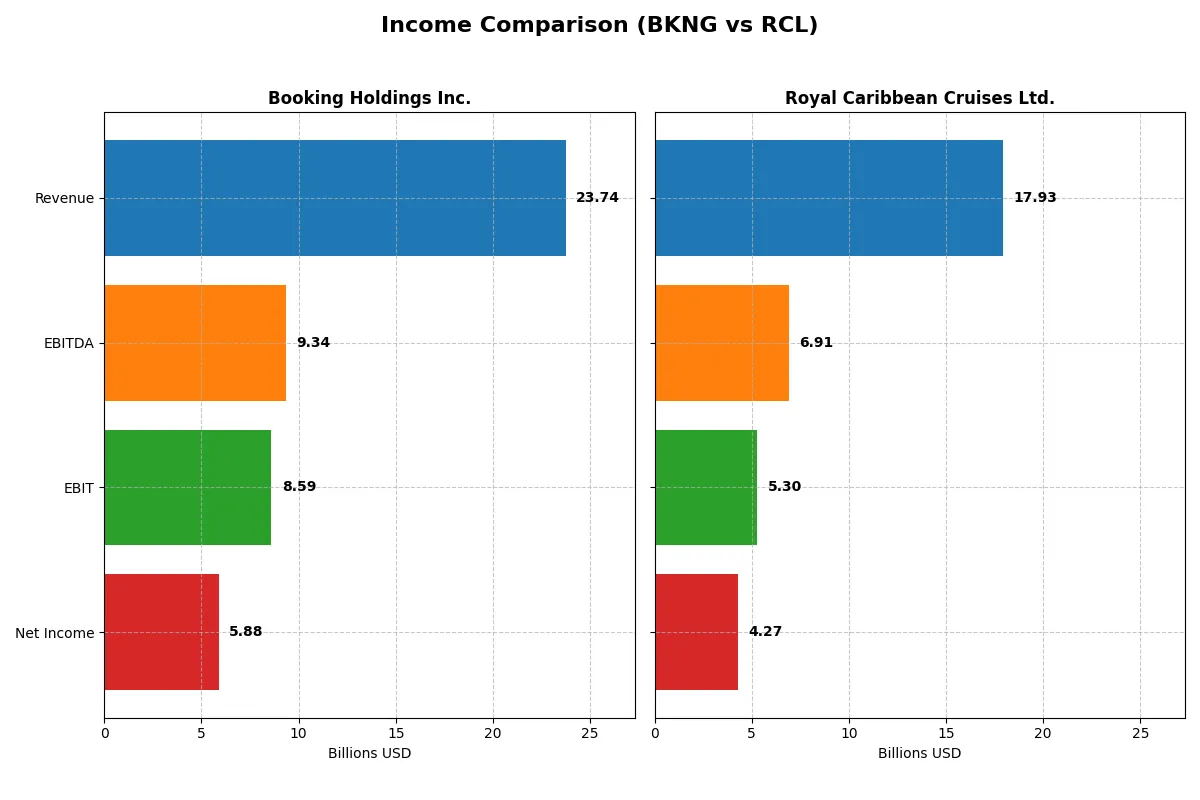
This data dissects the core profitability and scalability of both corporate engines to reveal who dominates the bottom line:
| Metric | Booking Holdings Inc. (BKNG) | Royal Caribbean Cruises Ltd. (RCL) |
|---|---|---|
| Revenue | 23.7B | 16.5B |
| Cost of Revenue | 0 | 8.7B |
| Operating Expenses | 16.2B | 3.7B |
| Gross Profit | 23.7B | 7.8B |
| EBITDA | 9.3B | 6.1B |
| EBIT | 8.6B | 4.5B |
| Interest Expense | 1.3B | 1.6B |
| Net Income | 5.9B | 3.1B |
| EPS | 174.96 | 11.00 |
| Fiscal Year | 2024 | 2024 |
Income Statement Analysis: The Bottom-Line Duel
This income statement comparison reveals which company drives superior efficiency and profit generation through its core business model.
Booking Holdings Inc. Analysis
Booking Holdings posts a robust revenue climb from $6.8B in 2020 to $23.7B in 2024, with net income soaring from $59M to $5.9B. Gross margin stays perfect at 100%, reflecting negligible cost of revenue. Net margin improves to 24.8% in 2024, driven by disciplined operating expenses and a 35% EBIT growth, signaling strong momentum and operational efficiency.
Royal Caribbean Cruises Ltd. Analysis
Royal Caribbean’s revenue grows from $1.5B in 2021 to $17.9B in 2025, with net income recovering from a $5.3B loss to $4.3B profit. Its gross margin averages 46.8%, typical for capital-intensive travel. The 2025 net margin stands at 23.8%, supported by improving EBIT margins near 30%. This recovery shows solid operational leverage and expanding profitability after pandemic setbacks.
Margin Excellence vs. Recovery Strength
Booking Holdings dominates in margin quality and scale, boasting flawless gross margins and superior net income growth. Royal Caribbean impresses with a dramatic turnaround from deep losses to robust profits. Booking’s consistent margin leadership suits investors prioritizing efficiency. Royal Caribbean appeals to those favoring strong recovery and growth potential amid cyclical volatility.
Financial Ratios Comparison
These vital ratios serve as a diagnostic tool to expose the underlying fiscal health, valuation premiums, and capital efficiency of the companies analyzed:
| Ratios | Booking Holdings Inc. (BKNG) | Royal Caribbean Cruises Ltd. (RCL) |
|---|---|---|
| ROE | -1.46% | 0.38% (2024) |
| ROIC | 44.14% | 14.19% (2024) |
| P/E | 28.40 | 20.93 (2024) |
| P/B | -41.55 | 7.96 (2024) |
| Current Ratio | 1.31 | 0.17 (2024) |
| Quick Ratio | 1.31 | 0.15 (2024) |
| D/E | -4.25 | 2.75 (2024) |
| Debt-to-Assets | 61.65% | 56.16% (2024) |
| Interest Coverage | 5.83 | 2.58 (2024) |
| Asset Turnover | 0.86 | 0.44 (2024) |
| Fixed Asset Turnover | 17.07 | 0.51 (2024) |
| Payout Ratio | 19.96% | 3.72% (2024) |
| Dividend Yield | 0.70% | 0.18% (2024) |
| Fiscal Year | 2024 | 2024 |
Efficiency & Valuation Duel: The Vital Signs
Financial ratios serve as a company’s DNA, exposing hidden risks and operational strengths crucial for investment decisions.
Booking Holdings Inc.
Booking Holdings shows strong operational efficiency with a high net margin of 24.78% and a robust ROIC of 44.14%, signaling value creation above its 9.19% WACC. However, its negative ROE at -146.32% flags significant shareholder equity issues. The stock trades expensive with a P/E of 28.4, while modest dividends of 0.7% suggest a cautious return policy amid capital reinvestment.
Royal Caribbean Cruises Ltd.
Royal Caribbean reports a favorable net margin of 23.82% but lacks data on ROE and ROIC, indicating uncertain profitability metrics. Its P/E ratio of 17.69 appears more reasonable, reflecting moderate valuation levels. The company maintains a lower dividend yield at 0.35%, with reinvestment likely focused on capital expenditures given its high capex ratios, though liquidity ratios raise caution.
Premium Valuation vs. Operational Safety
Booking Holdings commands a premium valuation but delivers superior capital efficiency and operational margins. Royal Caribbean’s lower valuation contrasts with weaker profitability measures and liquidity concerns. Investors prioritizing growth and efficiency may lean toward Booking, while those seeking lower entry multiples might consider Royal Caribbean’s profile despite higher risks.
Which one offers the Superior Shareholder Reward?
I observe Booking Holdings Inc. (BKNG) prioritizes robust buybacks and a modest 0.7% dividend yield with a conservative 20% payout ratio, fully covered by free cash flow. Royal Caribbean Cruises Ltd. (RCL) offers a smaller 0.35% yield and a low 6% payout but minimal free cash flow coverage, relying more on reinvestment amid recent volatility. BKNG’s intense buyback program consistently returns capital, supporting its premium valuation and sustainable shareholder rewards. RCL’s modest buybacks and dividend face pressure from high debt and weaker cash flow, raising sustainability concerns. I conclude BKNG delivers a superior total return profile through balanced dividends and aggressive buybacks in 2026.
Comparative Score Analysis: The Strategic Profile
The radar chart reveals the fundamental DNA and trade-offs of Booking Holdings Inc. and Royal Caribbean Cruises Ltd.:
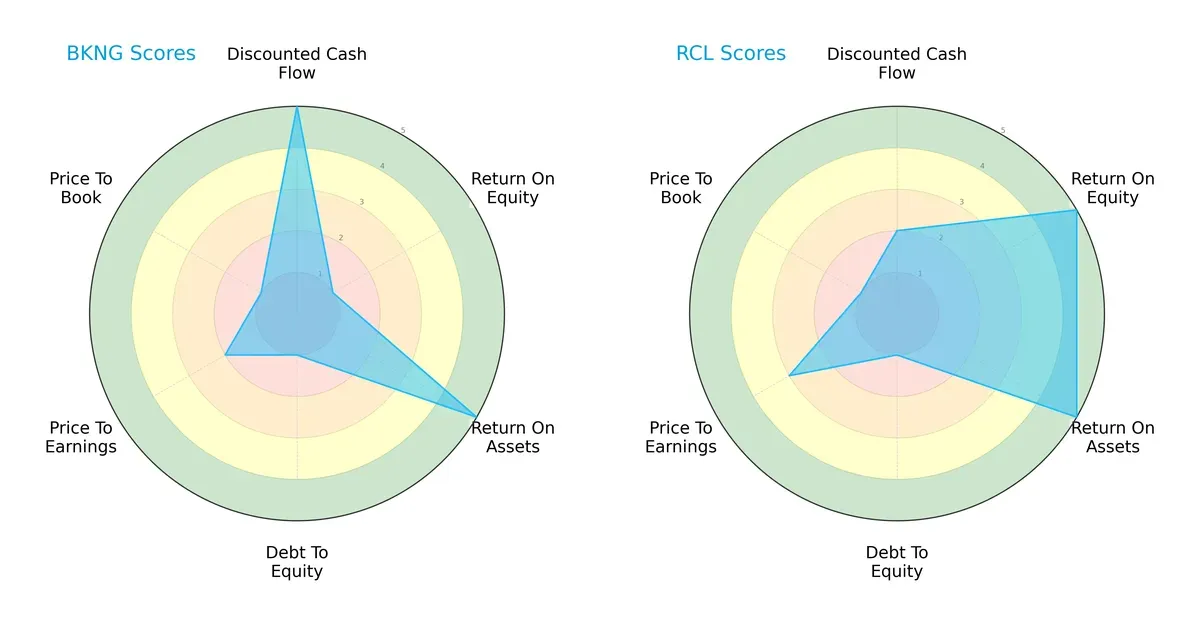
Booking excels in discounted cash flow and return on assets, signaling strong cash generation and asset efficiency. Royal Caribbean shines with superior return on equity and moderate valuation scores, reflecting effective equity use and fair market pricing. Booking’s profile is less balanced due to weak debt management and valuation metrics. Royal Caribbean leans on equity returns but shares a high leverage risk with Booking.
Bankruptcy Risk: Solvency Showdown
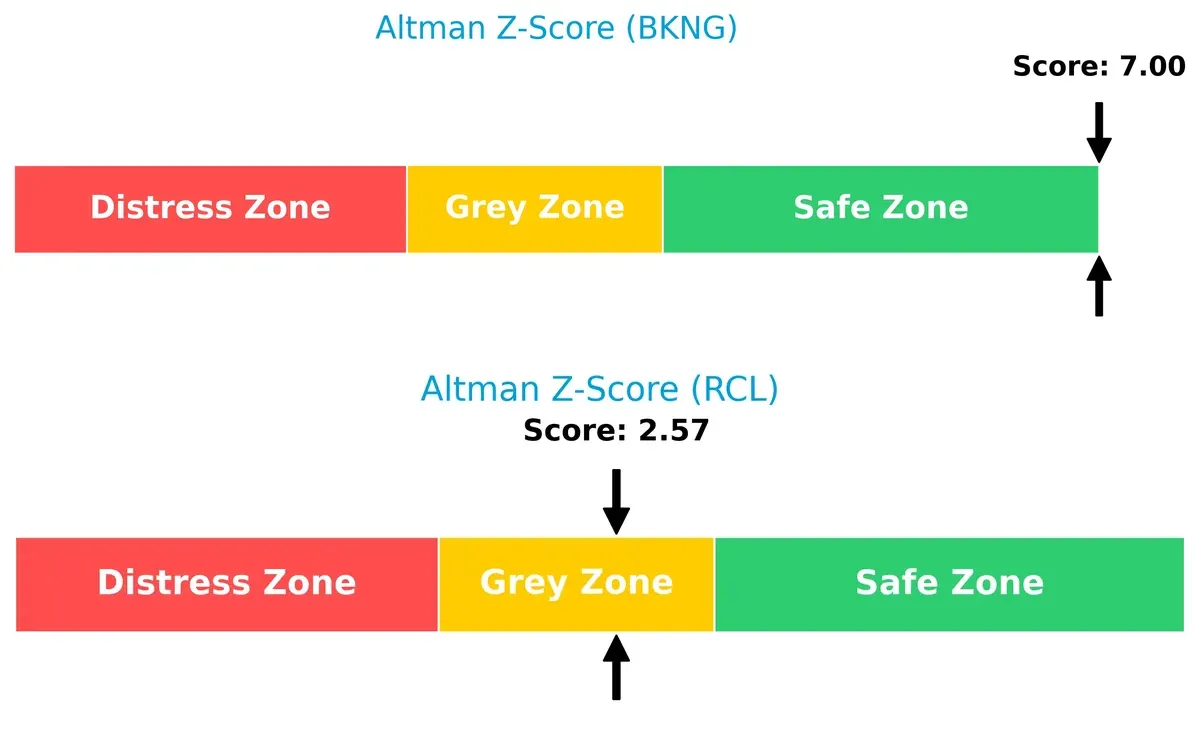
Booking’s Altman Z-Score of 7 places it firmly in the safe zone, indicating robust financial stability. Royal Caribbean’s 2.57 score falls in the grey zone, signaling elevated bankruptcy risk amid economic volatility:
Financial Health: Quality of Operations
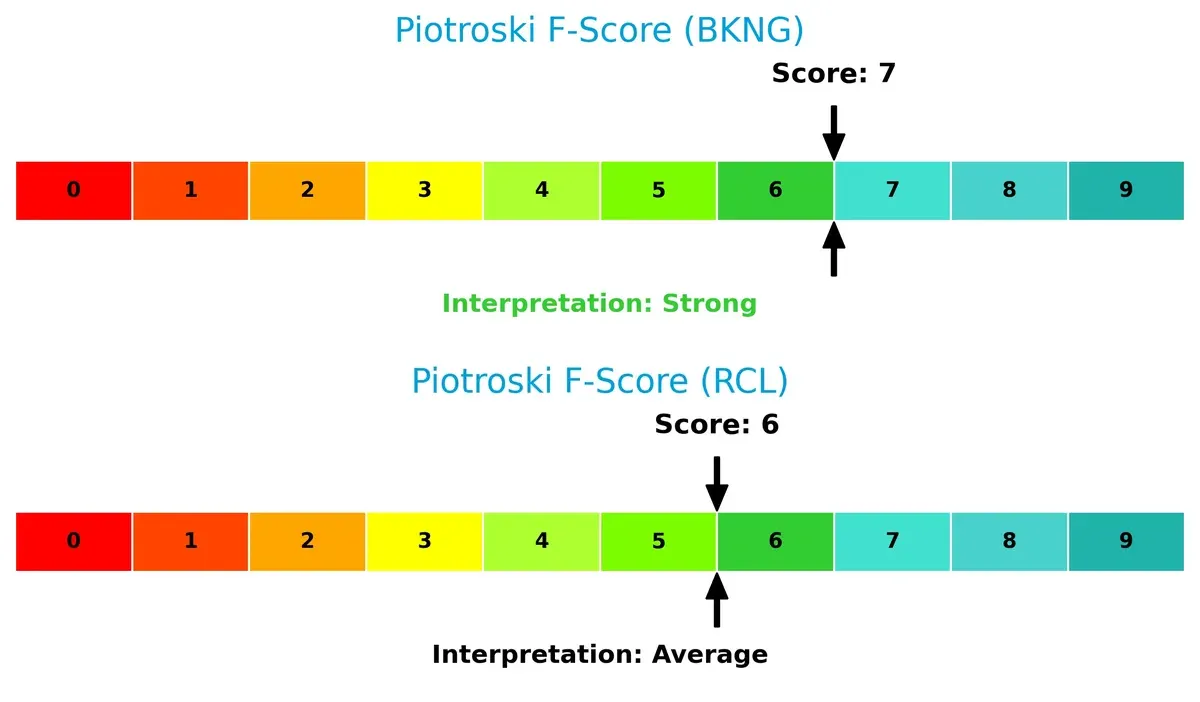
Booking’s Piotroski F-Score of 7 indicates strong internal health and operational quality. Royal Caribbean’s score of 6 is decent but flags potential weaknesses compared to Booking’s stronger fundamentals:
How are the two companies positioned?
This section dissects the operational DNA of BKNG and RCL by comparing their revenue distribution and internal dynamics. The goal is to confront their economic moats and identify which model offers the most resilient competitive advantage today.
Revenue Segmentation: The Strategic Mix
This visual comparison dissects how Booking Holdings Inc. and Royal Caribbean Cruises Ltd. diversify their income streams and where their primary sector bets lie:
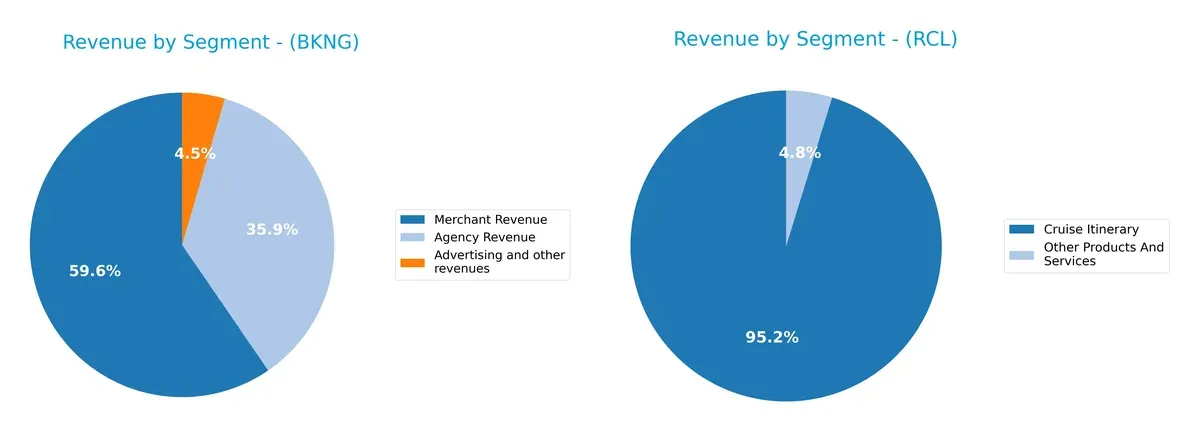
Booking Holdings Inc. presents a diversified revenue mix, with Merchant Revenue at $14.1B, Agency Revenue at $8.5B, and Advertising at $1.07B in 2024. Royal Caribbean Cruises Ltd. relies heavily on Cruise Itinerary, which dwarfs its $15.7B revenue, while Other Products and Services contribute a modest $788M. Booking’s varied streams reduce concentration risk, while Royal Caribbean’s dominance in cruises signals infrastructure reliance and ecosystem lock-in.
Strengths and Weaknesses Comparison
This table compares the Strengths and Weaknesses of Booking Holdings Inc. and Royal Caribbean Cruises Ltd.:
Booking Holdings Inc. Strengths
- Diverse revenue streams from advertising, agency, and merchant services
- Strong net margin at 24.78%
- High ROIC at 44.14% signals efficient capital allocation
- Favorable quick ratio and interest coverage
- Solid global presence with strong Netherlands revenue
Royal Caribbean Cruises Ltd. Strengths
- Large cruise itinerary revenue base of $15.7B
- Favorable net margin at 23.82%
- Favorable debt to assets and interest coverage ratios
- Geographic diversification with significant North America and Europe sales
- Lower PE ratio at 17.69 indicating valuation appeal
Booking Holdings Inc. Weaknesses
- Negative ROE at -146.32% signals shareholder returns issues
- High debt to assets at 61.65% raises financial risk
- Unfavorable PE of 28.4 suggests premium valuation
- Dividend yield low at 0.7%
- Market concentration in Netherlands region
Royal Caribbean Cruises Ltd. Weaknesses
- Zero ROE and ROIC indicate operating inefficiencies
- Unavailable WACC metric restricts cost of capital assessment
- Unfavorable current and quick ratios suggest liquidity concerns
- Poor asset turnover metrics
- Low dividend yield at 0.35%
Booking Holdings shows operational efficiency with strong profitability metrics but faces risks from high leverage and negative ROE. Royal Caribbean struggles with capital returns and liquidity but benefits from stable margins and geographic sales diversity. Both face valuation and dividend yield challenges that investors should monitor closely.
The Moat Duel: Analyzing Competitive Defensibility
A structural moat is the only true barrier protecting long-term profits from relentless competitive erosion. Let’s dissect the moats of two travel giants:
Booking Holdings Inc.: Network Effects Powerhouse
Booking’s core moat is its vast network effect from multiple online platforms. This results in high ROIC near 35%, reflecting strong margin stability. Expansion into travel insurance and restaurant bookings promises to deepen its moat in 2026.
Royal Caribbean Cruises Ltd.: Brand and Experience Moat
Royal Caribbean’s moat centers on its premium cruise brands and immersive experiences, contrasting Booking’s digital network. Despite unavailable ROIC vs. WACC data, it shows improving profitability and growth in North American revenue, signaling robust competitive positioning. Future fleet expansions could amplify market reach.
Network Effects vs. Experiential Brand Strength
Booking Holdings commands a wider, more quantifiable moat with a soaring ROIC well above its cost of capital. Royal Caribbean’s moat is experiential but less measurable and more capital intensive. Booking is better positioned to defend and grow its market share amid digital disruption.
Which stock offers better returns?
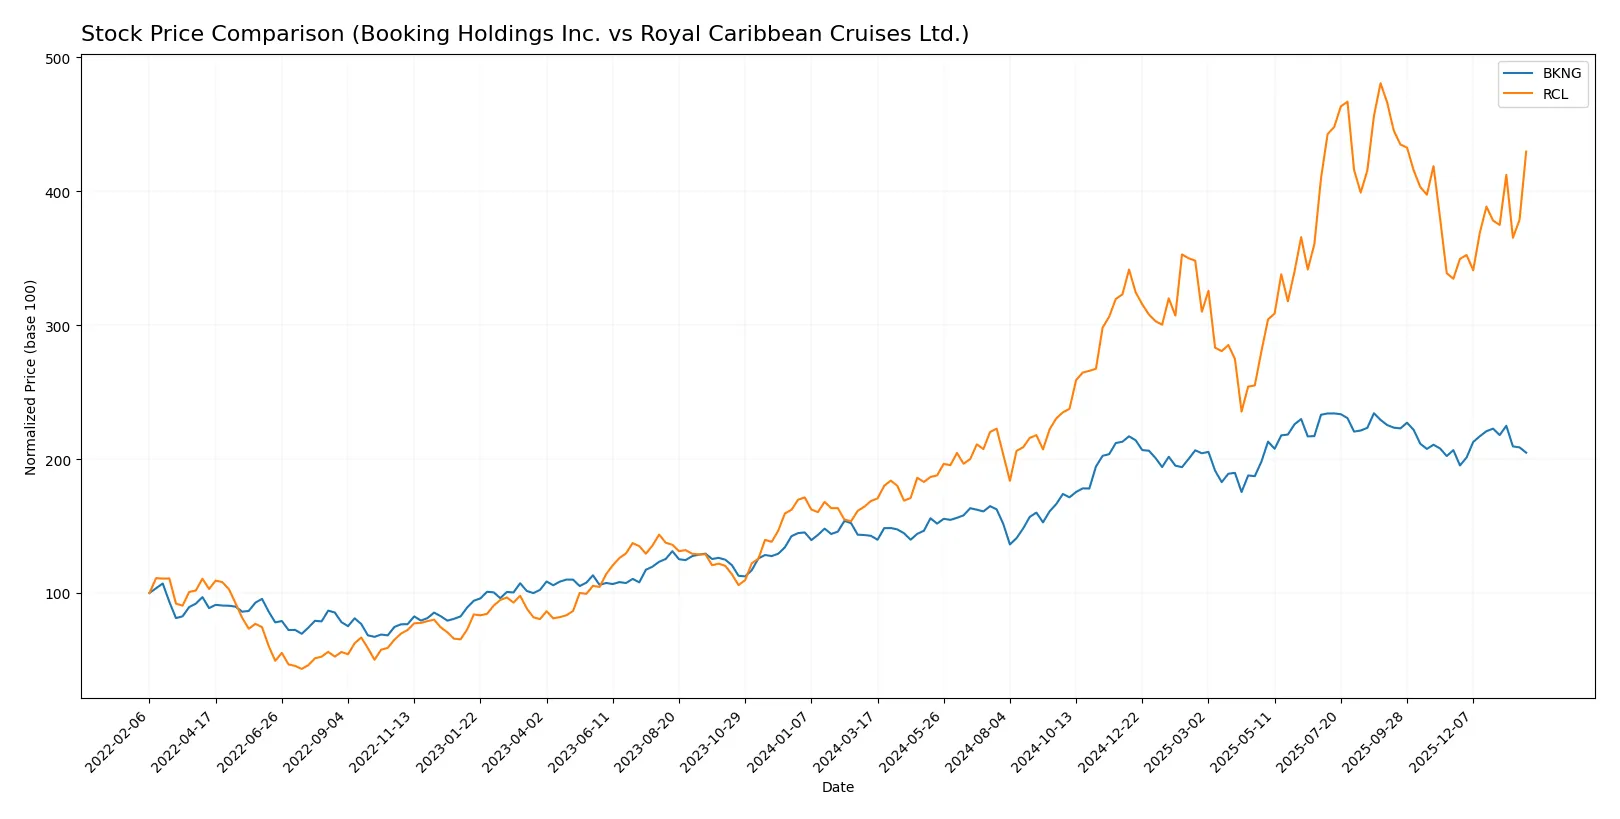
The past year reveals stark contrasts in price movements and trading dynamics between Booking Holdings Inc. and Royal Caribbean Cruises Ltd., highlighting divergent investor sentiment and momentum.
Trend Comparison
Booking Holdings Inc. shows a strong bullish trend over the past 12 months with a 43.5% price increase, though the pace slowed recently, indicating deceleration despite a wide price range.
Royal Caribbean Cruises Ltd. outperformed with a 154.7% gain over 12 months, accelerating its bullish momentum and maintaining a tighter price range, reflecting robust upward price movement.
Royal Caribbean Cruises Ltd. delivered the highest market performance, significantly outpacing Booking Holdings Inc. in price appreciation and acceleration over the year.
Target Prices
Analysts present a constructive consensus on Booking Holdings Inc. and Royal Caribbean Cruises Ltd.
| Company | Target Low | Target High | Consensus |
|---|---|---|---|
| Booking Holdings Inc. | 5,407 | 6,806 | 6,136 |
| Royal Caribbean Cruises Ltd. | 318 | 420 | 363 |
Booking Holdings’ target consensus stands about 23% above its current price, signaling strong growth potential. Royal Caribbean’s consensus target is roughly 12% higher, reflecting moderate optimism amid market volatility.

Don’t Let Luck Decide Your Entry Point
Optimize your entry points with our advanced ProRealTime indicators. You’ll get efficient buy signals with precise price targets for maximum performance. Start outperforming now!
How do institutions grade them?
Here is the recent grading data from major financial institutions for both companies:
Booking Holdings Inc. Grades
The following table summarizes institutional grades for Booking Holdings Inc. over recent months.
| Grading Company | Action | New Grade | Date |
|---|---|---|---|
| Wells Fargo | maintain | Equal Weight | 2026-01-09 |
| Cantor Fitzgerald | maintain | Neutral | 2026-01-08 |
| Bernstein | maintain | Market Perform | 2026-01-06 |
| Argus Research | maintain | Buy | 2026-01-06 |
| BTIG | maintain | Buy | 2025-12-23 |
| BTIG | maintain | Buy | 2025-11-24 |
| B of A Securities | upgrade | Buy | 2025-11-24 |
| Wedbush | upgrade | Outperform | 2025-11-13 |
| UBS | maintain | Buy | 2025-10-29 |
| Truist Securities | maintain | Buy | 2025-10-29 |
Royal Caribbean Cruises Ltd. Grades
Below is a summary of recent institutional grades for Royal Caribbean Cruises Ltd.
| Grading Company | Action | New Grade | Date |
|---|---|---|---|
| Stifel | maintain | Buy | 2026-01-30 |
| Barclays | maintain | Overweight | 2026-01-30 |
| Jefferies | maintain | Hold | 2026-01-30 |
| Goldman Sachs | maintain | Buy | 2026-01-23 |
| Mizuho | maintain | Outperform | 2026-01-22 |
| Truist Securities | maintain | Hold | 2026-01-22 |
| Stifel | maintain | Buy | 2026-01-20 |
| Wells Fargo | maintain | Overweight | 2026-01-13 |
| B of A Securities | maintain | Neutral | 2026-01-12 |
| Barclays | maintain | Overweight | 2025-12-17 |
Which company has the best grades?
Booking Holdings Inc. has more consistent Buy and Outperform grades, indicating stronger analyst conviction. Royal Caribbean Cruises shows mixed ratings, including Hold and Neutral, suggesting cautious sentiment. Investors may perceive Booking Holdings as having more favorable institutional support.
Risks specific to each company
The following categories identify the critical pressure points and systemic threats facing both firms in the 2026 market environment:
1. Market & Competition
Booking Holdings Inc.
- Dominates online travel reservations with broad platform integration and global reach.
Royal Caribbean Cruises Ltd.
- Faces intense competition in cruise industry with 61 ships but limited to cruise market niche.
2. Capital Structure & Debt
Booking Holdings Inc.
- Debt to assets ratio high at 61.65%, a red flag indicating leverage risk.
Royal Caribbean Cruises Ltd.
- Debt metrics unavailable but favorable debt-to-equity score suggests manageable leverage.
3. Stock Volatility
Booking Holdings Inc.
- Beta of 1.234 suggests moderate volatility relative to market.
Royal Caribbean Cruises Ltd.
- Beta of 1.941 indicates higher stock volatility and risk exposure.
4. Regulatory & Legal
Booking Holdings Inc.
- Subject to online travel regulations and data privacy laws globally.
Royal Caribbean Cruises Ltd.
- Faces maritime, safety, and environmental regulations impacting operations and costs.
5. Supply Chain & Operations
Booking Holdings Inc.
- Relies on digital infrastructure and third-party providers; operational risks moderate.
Royal Caribbean Cruises Ltd.
- Dependent on fuel prices and port access; supply chain disruptions could be severe.
6. ESG & Climate Transition
Booking Holdings Inc.
- Moderate ESG risks; primarily digital footprint with some social responsibility concerns.
Royal Caribbean Cruises Ltd.
- High climate transition risk due to cruise emissions and environmental scrutiny.
7. Geopolitical Exposure
Booking Holdings Inc.
- Exposure to global travel demand fluctuations from geopolitical tensions.
Royal Caribbean Cruises Ltd.
- Vulnerable to regional instability affecting cruise routes and passenger flows.
Which company shows a better risk-adjusted profile?
Booking Holdings faces significant leverage risk but benefits from diversified, scalable digital operations and moderate stock volatility. Royal Caribbean suffers higher stock volatility and climate-related risks but shows better debt management. Booking’s Altman Z-score of 7 places it safely away from financial distress, while Royal Caribbean’s 2.57 signals moderate risk. Overall, Booking Holdings offers a superior risk-adjusted profile, supported by its strong operational moat and safer financial footing in 2026’s volatile travel market.
Final Verdict: Which stock to choose?
Booking Holdings Inc. (BKNG) excels as a cash-generating powerhouse with a durable competitive advantage. Its standout strength lies in efficient capital use and robust profitability. A point of vigilance remains its elevated debt-to-assets ratio. BKNG suits aggressive growth portfolios seeking scalable tech-driven travel exposure.
Royal Caribbean Cruises Ltd. (RCL) offers a strategic moat rooted in its unique experiential brand and recurring customer demand. Relative to BKNG, RCL carries more financial leverage risk but delivers superior earnings yield and accelerating price momentum. It fits well in GARP portfolios balancing growth with value considerations.
If you prioritize sustainable value creation and capital efficiency, BKNG outshines with its proven moat and high free cash flow. However, if you seek growth fueled by market recovery and brand loyalty, RCL offers better stability in earnings growth and price acceleration despite higher leverage. Each presents distinct profiles aligned with different risk appetites and investment horizons.
Disclaimer: Investment carries a risk of loss of initial capital. The past performance is not a reliable indicator of future results. Be sure to understand risks before making an investment decision.
Go Further
I encourage you to read the complete analyses of Booking Holdings Inc. and Royal Caribbean Cruises Ltd. to enhance your investment decisions: