In the dynamic travel services sector, Booking Holdings Inc. (BKNG) and Norwegian Cruise Line Holdings Ltd. (NCLH) stand out as leaders with distinct yet overlapping market footprints. BKNG excels in online travel reservations, while NCLH dominates the cruise experience segment. Both companies leverage innovation to capture evolving consumer preferences. This article will analyze their strengths and risks to identify the most compelling investment opportunity for your portfolio.

Table of contents
Companies Overview
I will begin the comparison between Booking Holdings Inc. and Norwegian Cruise Line Holdings Ltd. by providing an overview of these two companies and their main differences.
Booking Holdings Inc. Overview
Booking Holdings Inc. operates globally in the travel services sector, offering online reservation and related services. Its platforms include Booking.com, Rentalcars.com, Priceline, Agoda, KAYAK, and OpenTable, covering accommodations, rental cars, flights, and restaurant bookings. Founded in 1997 and headquartered in Norwalk, Connecticut, it serves consumers and travel providers with a diverse portfolio focused on travel and restaurant reservations.
Norwegian Cruise Line Holdings Ltd. Overview
Norwegian Cruise Line Holdings Ltd. is a cruise company operating internationally across North America, Europe, and Asia-Pacific. It manages three cruise brands—Norwegian Cruise Line, Oceania Cruises, and Regent Seven Seas Cruises—with itineraries ranging from three to 180 days across various global destinations. Founded in 1966 and based in Miami, Florida, it sells cruises through travel advisors, onboard sales, and charter services.
Key similarities and differences
Both companies operate within the consumer cyclical sector focused on travel services but differ in business models. Booking Holdings provides online travel and restaurant booking platforms, enabling consumers to arrange travel components digitally. In contrast, Norwegian Cruise Line Holdings operates physical cruise ships offering travel experiences directly. While Booking Holdings emphasizes reservation technology, Norwegian Cruise Line centers on hospitality and cruise operations.
Income Statement Comparison
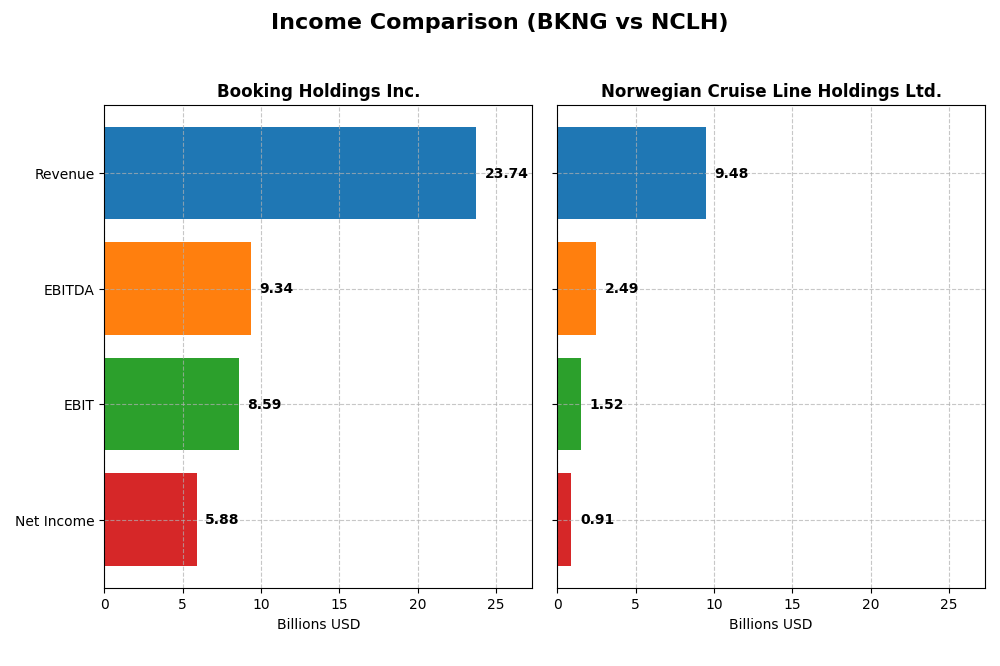
This table presents a side-by-side comparison of key income statement metrics for Booking Holdings Inc. and Norwegian Cruise Line Holdings Ltd. for the fiscal year 2024.
| Metric | Booking Holdings Inc. (BKNG) | Norwegian Cruise Line Holdings Ltd. (NCLH) |
|---|---|---|
| Market Cap | 177B | 11.2B |
| Revenue | 23.7B | 9.5B |
| EBITDA | 9.3B | 2.5B |
| EBIT | 8.6B | 1.5B |
| Net Income | 5.9B | 910M |
| EPS | 174.96 | 2.09 |
| Fiscal Year | 2024 | 2024 |
Income Statement Interpretations
Booking Holdings Inc.
Booking Holdings Inc. displayed strong revenue growth from 2020 to 2024, rising from $6.8B to $23.7B, with net income surging from $59M to $5.9B. Margins improved markedly, with a gross margin steady at 100% and net margin reaching 24.78% in 2024. The latest year showed accelerated EBIT and net income growth, signaling improved profitability and operational efficiency.
Norwegian Cruise Line Holdings Ltd.
Norwegian Cruise Line Holdings Ltd. saw revenue increase significantly from $1.3B in 2020 to $9.5B in 2024, while net income turned positive, improving from a loss of $4B to a profit of $910M. Margins remained favorable, with a 40% gross margin and 9.6% net margin in 2024. The company’s most recent year reflected strong growth in EBIT and net margins, indicating a solid recovery phase.
Which one has the stronger fundamentals?
Booking Holdings Inc. demonstrates stronger fundamentals with higher revenue and net income growth rates, superior margins, and a more substantial absolute profit base. Norwegian Cruise Line Holdings Ltd. also shows improvement but from a lower base with narrower margins. Both have favorable income statement trends, though Booking Holdings exhibits greater scale and profitability.
Financial Ratios Comparison
The table below presents the key financial ratios for Booking Holdings Inc. (BKNG) and Norwegian Cruise Line Holdings Ltd. (NCLH) as of fiscal year 2024, allowing a clear comparison of profitability, liquidity, leverage, efficiency, and shareholder returns.
| Ratios | Booking Holdings Inc. (BKNG) | Norwegian Cruise Line Holdings Ltd. (NCLH) |
|---|---|---|
| ROE | -1.46% | 63.86% |
| ROIC | 44.14% | 11.11% |
| P/E | 28.40 | 12.30 |
| P/B | -41.55 | 7.86 |
| Current Ratio | 1.31 | 0.17 |
| Quick Ratio | 1.31 | 0.15 |
| D/E (Debt-to-Equity) | -4.25 | 9.76 |
| Debt-to-Assets | 61.65% | 69.69% |
| Interest Coverage | 5.83 | 1.96 |
| Asset Turnover | 0.86 | 0.47 |
| Fixed Asset Turnover | 17.07 | 0.56 |
| Payout Ratio | 19.96% | 0% |
| Dividend Yield | 0.70% | 0% |
Interpretation of the Ratios
Booking Holdings Inc.
Booking Holdings shows a mixed ratio profile with strong net margin (24.78%) and return on invested capital (44.14%), but a notably negative return on equity (-146.32%) and high debt-to-assets ratio (61.65%). The current and quick ratios are adequate, while interest coverage is favorable. It pays dividends with a low yield (0.7%) and moderate payout risk, supported by free cash flow, though investors should watch its high leverage and valuation concerns.
Norwegian Cruise Line Holdings Ltd.
Norwegian Cruise Line presents mostly unfavorable ratios, including a low current ratio (0.17) and high debt-to-assets (69.69%), reflecting liquidity and leverage challenges. While it has a favorable ROE (63.86%) and ROIC (11.11%), asset turnover is weak. The company does not pay dividends, likely due to ongoing reinvestment needs and significant debt, highlighting operational risks and limited immediate shareholder returns.
Which one has the best ratios?
Booking Holdings exhibits a more balanced and slightly favorable ratio set, with stronger profitability and liquidity markers despite some leverage concerns. Norwegian Cruise Line’s ratios reflect greater financial stress and lower liquidity, accompanied by an unfavorable overall evaluation. Thus, Booking Holdings has the relatively better financial ratio profile based on the 2024 fiscal year data.
Strategic Positioning
This section compares the strategic positioning of Booking Holdings Inc. and Norwegian Cruise Line Holdings Ltd., including Market position, Key segments, and Exposure to technological disruption:
Booking Holdings Inc.
- Leading global travel services provider with strong NASDAQ presence and high market cap.
- Diversified revenue streams from accommodation, car rentals, flights, cruises, and restaurant reservations.
- Online platform model exposed to evolving travel tech but benefits from broad digital service integration.
Norwegian Cruise Line Holdings Ltd.
- Cruise line operator with significant presence across multiple international regions.
- Revenue mainly from passenger tickets and onboard services across 28 ships.
- Traditional cruise operations with potential tech impact but less reliant on online innovation.
Booking Holdings Inc. vs Norwegian Cruise Line Holdings Ltd. Positioning
Booking Holdings operates a diversified, digital-first travel services business with multiple revenue sources, while Norwegian Cruise Line focuses on cruise experiences with concentrated product offerings. Booking’s broad market reach contrasts with Norwegian’s niche in leisure cruising.
Which has the best competitive advantage?
Booking Holdings demonstrates a very favorable moat with strong value creation and growing ROIC, indicating a durable competitive advantage. Norwegian Cruise Line shows slightly favorable moat status with improving profitability but currently lacks a strong competitive moat.
Stock Comparison
The stock price chart over the past year highlights strong bullish trends for both Booking Holdings Inc. and Norwegian Cruise Line Holdings Ltd., with notable price accelerations and distinct trading volume dynamics.

Trend Analysis
Booking Holdings Inc. (BKNG) exhibited a 47.76% price increase over the past 12 months, confirming a bullish trend with accelerating momentum and a wide price range from 3328.13 to 5720.87. Recent months show continued upward slope and buyer dominance.
Norwegian Cruise Line Holdings Ltd. (NCLH) achieved a 50.86% gain over the last year, indicating a bullish trend with acceleration. Price volatility is moderate, ranging between 15.69 and 28.35, while recent trading volumes suggest neutral buyer behavior.
Comparing both, NCLH delivered a slightly higher market performance with a 50.86% increase versus BKNG’s 47.76%, despite BKNG’s stronger buyer dominance in recent trading periods.
Target Prices
The current analyst consensus provides a clear outlook on target prices for Booking Holdings Inc. and Norwegian Cruise Line Holdings Ltd.
| Company | Target High | Target Low | Consensus |
|---|---|---|---|
| Booking Holdings Inc. | 6806 | 5407 | 6141.38 |
| Norwegian Cruise Line Holdings Ltd. | 38 | 20 | 26 |
Analysts expect Booking Holdings Inc. to trade significantly above its current price of 5492.11 USD, indicating potential upside. Norwegian Cruise Line Holdings Ltd.’s consensus target of 26 USD is slightly above its current price of 24.53 USD, suggesting modest growth potential.
Analyst Opinions Comparison
This section compares analysts’ ratings and grades for Booking Holdings Inc. and Norwegian Cruise Line Holdings Ltd.:
Rating Comparison
BKNG Rating
- Rating: B-, classified as Very Favorable overall.
- Discounted Cash Flow Score: 5, indicating a Very Favorable valuation based on future cash flow.
- ROE Score: 1, considered Very Unfavorable for profitability from equity.
- ROA Score: 5, very favorable use of assets to generate earnings.
- Debt To Equity Score: 1, very unfavorable financial risk due to high debt relative to equity.
- Overall Score: 3, indicating a Moderate overall financial standing.
NCLH Rating
- Rating: B, classified as Very Favorable overall.
- Discounted Cash Flow Score: 3, reflecting a Moderate valuation based on future cash flow.
- ROE Score: 5, indicating Very Favorable profitability from equity.
- ROA Score: 3, moderate effectiveness in asset utilization.
- Debt To Equity Score: 1, also very unfavorable financial risk due to high leverage.
- Overall Score: 3, indicating a Moderate overall financial standing.
Which one is the best rated?
Norwegian Cruise Line Holdings Ltd. holds a higher overall rating (B vs. B-) and excels in return on equity, while Booking Holdings Inc. scores better on discounted cash flow and return on assets. Both share a moderate overall score and unfavorable debt-to-equity ratings.
Scores Comparison
Here is a comparison of the Altman Z-Score and Piotroski Score for the two companies:
BKNG Scores
- Altman Z-Score: 7.16, indicating a safe zone with low bankruptcy risk.
- Piotroski Score: 7, categorized as strong financial health.
NCLH Scores
- Altman Z-Score: 0.32, indicating a distress zone with high bankruptcy risk.
- Piotroski Score: 5, categorized as average financial health.
Which company has the best scores?
Based on the provided data, BKNG has significantly better scores than NCLH. BKNG’s Altman Z-Score places it firmly in the safe zone, and its Piotroski Score indicates strong financial health, compared to NCLH’s distress zone and average Piotroski Score.
Grades Comparison
Here is a comparison of the recent grades assigned to Booking Holdings Inc. and Norwegian Cruise Line Holdings Ltd.:
Booking Holdings Inc. Grades
This table presents recent grades and rating actions from recognized grading companies for Booking Holdings Inc.:
| Grading Company | Action | New Grade | Date |
|---|---|---|---|
| Wells Fargo | Maintain | Equal Weight | 2026-01-09 |
| Cantor Fitzgerald | Maintain | Neutral | 2026-01-08 |
| Bernstein | Maintain | Market Perform | 2026-01-06 |
| Argus Research | Maintain | Buy | 2026-01-06 |
| BTIG | Maintain | Buy | 2025-12-23 |
| B of A Securities | Upgrade | Buy | 2025-11-24 |
| BTIG | Maintain | Buy | 2025-11-24 |
| Wedbush | Upgrade | Outperform | 2025-11-13 |
| DA Davidson | Maintain | Buy | 2025-10-29 |
| UBS | Maintain | Buy | 2025-10-29 |
Booking Holdings Inc. shows a generally positive trend with several upgrades to Buy and Outperform ratings, reflecting confidence from multiple reputable firms.
Norwegian Cruise Line Holdings Ltd. Grades
Below are recent grades and rating actions from reputable grading companies for Norwegian Cruise Line Holdings Ltd.:
| Grading Company | Action | New Grade | Date |
|---|---|---|---|
| Barclays | Maintain | Overweight | 2025-12-17 |
| Jefferies | Downgrade | Hold | 2025-12-15 |
| Mizuho | Maintain | Outperform | 2025-12-12 |
| Goldman Sachs | Downgrade | Neutral | 2025-12-09 |
| Truist Securities | Maintain | Buy | 2025-12-02 |
| Wells Fargo | Maintain | Overweight | 2025-12-01 |
| Susquehanna | Maintain | Neutral | 2025-11-12 |
| Goldman Sachs | Maintain | Buy | 2025-11-11 |
| Morgan Stanley | Maintain | Equal Weight | 2025-11-10 |
| JP Morgan | Maintain | Overweight | 2025-11-05 |
Norwegian Cruise Line Holdings Ltd. displays mixed ratings with some downgrades and a range of Hold to Overweight grades, indicating varied analyst perspectives.
Which company has the best grades?
Booking Holdings Inc. has received consistently stronger grades, including multiple Buy and Outperform ratings, compared with Norwegian Cruise Line’s mixed Buy, Hold, and Neutral grades. This suggests relatively higher analyst confidence in Booking’s outlook, which may influence investor sentiment and portfolio weighting decisions.
Strengths and Weaknesses
Below is a comparative overview of key strengths and weaknesses for Booking Holdings Inc. (BKNG) and Norwegian Cruise Line Holdings Ltd. (NCLH) based on the most recent data.
| Criterion | Booking Holdings Inc. (BKNG) | Norwegian Cruise Line Holdings Ltd. (NCLH) |
|---|---|---|
| Diversification | High: Revenue from Agency, Merchant, Advertising segments totaling over $23B in 2024 | Moderate: Revenue mainly from Passenger tickets and Onboard services, total about $9.5B in 2024 |
| Profitability | Strong net margin (24.78%), high ROIC (44.14%), but negative ROE (-146.32%) | Moderate net margin (9.6%), favorable ROE (63.86%), solid ROIC (11.11%) |
| Innovation | Demonstrates growing ROIC with durable competitive advantage | Improving ROIC trend but still shedding value overall; innovation gains slower |
| Global presence | Extensive global reach through diverse travel booking platforms | Global cruise operations but more limited in scale and diversification |
| Market Share | Leading player in online travel market with significant market share across segments | Smaller market share in cruise industry, recovering post-pandemic |
Key takeaways: Booking Holdings shows a robust and diversified business model with strong profitability and a durable competitive moat. Norwegian Cruise Line, while improving profitability, faces challenges with high leverage and less diversification, making it a higher-risk investment option.
Risk Analysis
Below is a comparative table summarizing key risks for Booking Holdings Inc. (BKNG) and Norwegian Cruise Line Holdings Ltd. (NCLH) based on their latest 2024 data:
| Metric | Booking Holdings Inc. (BKNG) | Norwegian Cruise Line Holdings Ltd. (NCLH) |
|---|---|---|
| Market Risk | Moderate (Beta 1.23) | High (Beta 2.08) |
| Debt level | Moderate (Debt-to-Assets 61.65%) | High (Debt-to-Assets 69.69%, high D/E ratio) |
| Regulatory Risk | Moderate | Moderate |
| Operational Risk | Low to Moderate | Moderate to High (Complex cruise ops) |
| Environmental Risk | Moderate (Industry-wide) | High (Cruise industry environmental scrutiny) |
| Geopolitical Risk | Moderate (Global travel exposure) | High (International itineraries sensitive to geopolitical events) |
Booking Holdings shows moderate market and debt risks but benefits from strong financial scores and operational diversification. Norwegian Cruise Line faces higher market volatility, elevated leverage, and significant environmental and geopolitical risks due to its cruise operations and global itineraries. Investors should weigh the higher financial distress signals and operational complexities in NCLH against BKNG’s relatively solid financial health.
Which Stock to Choose?
Booking Holdings Inc. (BKNG) shows strong income growth with a favorable net margin of 24.78% and significant revenue and EPS increases over 2020-2024. Its financial ratios are slightly favorable overall, with low net debt and strong cash flow, despite an unfavorable ROE and some debt-related metrics. The company has a very favorable moat, indicating durable competitive advantage and value creation.
Norwegian Cruise Line Holdings Ltd. (NCLH) exhibits favorable income metrics, including a 9.6% net margin and solid revenue growth, though overall profitability is lower than BKNG. Its financial ratios are mostly unfavorable, reflecting high debt levels and weak liquidity ratios, despite a favorable ROE. The moat status is slightly favorable, showing improving but still limited competitive advantage.
For investors, BKNG might appear more attractive for those prioritizing durable value creation and strong income growth, while NCLH could be of interest to those willing to tolerate higher risk for potential turnaround benefits amid improving profitability. The ratings and financial health suggest BKNG holds a stronger overall position, but preferences depend on risk tolerance and investment strategy.
Disclaimer: Investment carries a risk of loss of initial capital. The past performance is not a reliable indicator of future results. Be sure to understand risks before making an investment decision.
Go Further
I encourage you to read the complete analyses of Booking Holdings Inc. and Norwegian Cruise Line Holdings Ltd. to enhance your investment decisions: