Booking Holdings Inc. (BKNG) and Marriott International, Inc. (MAR) are two giants in the travel sector, each shaping how people explore the world. BKNG leads in online travel services, while MAR dominates physical hospitality with its vast hotel network. Their overlapping influence in travel innovation and consumer reach makes them compelling rivals. In this article, I will analyze both to identify which company offers the most promising investment opportunity for you.

Table of contents
Companies Overview
I will begin the comparison between Booking Holdings Inc. and Marriott International, Inc. by providing an overview of these two companies and their main differences.
Booking Holdings Inc. Overview
Booking Holdings Inc. is a global leader in travel and restaurant online reservation services. Its platforms include Booking.com, Priceline, Agoda, Rentalcars.com, KAYAK, and OpenTable, offering accommodation, car rentals, flights, and restaurant bookings. Founded in 1997 and headquartered in Norwalk, Connecticut, BKNG operates in the Consumer Cyclical sector with a market capitalization of $171.6B, emphasizing technology-driven travel solutions.
Marriott International, Inc. Overview
Marriott International, Inc. operates, franchises, and licenses hotel and residential properties worldwide, managing nearly 8,000 properties under 30 brands across 139 countries. Founded in 1927 and based in Bethesda, Maryland, MAR is a major player in the Travel Lodging industry. It employs 418,000 people and has a market cap of $84.1B, focusing on hospitality and property management services.
Key similarities and differences
Both BKNG and MAR operate in the travel sector but differ in business models: BKNG is primarily an online travel services provider, leveraging multiple digital platforms for reservations and comparisons, while MAR focuses on owning, franchising, and managing physical lodging properties globally. BKNG’s model is technology and service-driven, whereas MAR’s is asset-heavy with extensive brand portfolios and property management.
Income Statement Comparison
The table below compares the key income statement metrics for Booking Holdings Inc. and Marriott International, Inc. for the fiscal year 2024.
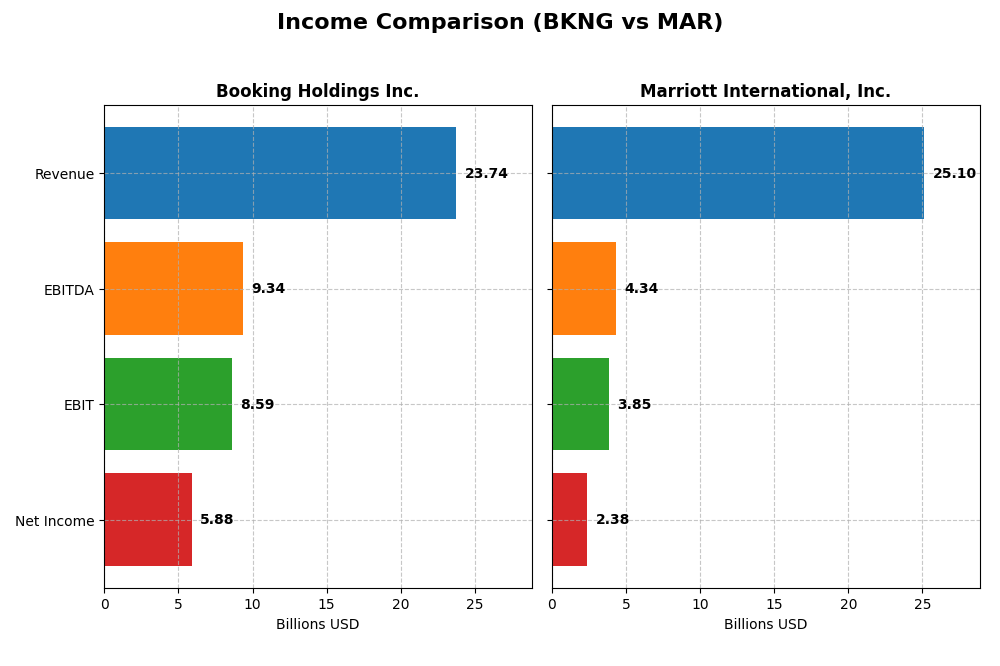
| Metric | Booking Holdings Inc. | Marriott International, Inc. |
|---|---|---|
| Market Cap | 171.6B | 84.1B |
| Revenue | 23.7B | 25.1B |
| EBITDA | 9.34B | 4.34B |
| EBIT | 8.59B | 3.85B |
| Net Income | 5.88B | 2.38B |
| EPS | 174.96 | 8.36 |
| Fiscal Year | 2024 | 2024 |
Income Statement Interpretations
Booking Holdings Inc.
Booking Holdings experienced strong revenue growth from 2020 to 2024, with a 249% increase and net income surging nearly 10,000%. Margins remained robust, with a gross margin at 100% and net margin rising to 24.78%. In 2024, revenue grew 11.11%, EBIT increased 34.63%, and net margin expanded 23.43%, reflecting improved profitability and operational efficiency.
Marriott International, Inc.
Marriott’s revenue grew 137% over the 2020-2024 period, with net income rising by nearly 990%. Margins have been favorable but lower than Booking Holdings, with a 20.32% gross margin and 9.46% net margin in 2024. However, recent performance showed mixed signals: 2024 revenue grew 5.85% but net margin and EPS declined, indicating margin pressure and slower profit growth.
Which one has the stronger fundamentals?
Booking Holdings displays stronger fundamentals with higher margin levels and superior growth across revenue, EBIT, and net income. Marriott shows solid long-term growth but faces recent margin contraction and profitability challenges. Booking’s consistent margin expansion and faster earnings growth contribute to a more favorable income statement profile overall.
Financial Ratios Comparison
Below is a side-by-side comparison of key financial ratios for Booking Holdings Inc. (BKNG) and Marriott International, Inc. (MAR) for the fiscal year 2024.
| Ratios | Booking Holdings Inc. (BKNG) | Marriott International, Inc. (MAR) |
|---|---|---|
| ROE | -146.3% | -79.4% |
| ROIC | 44.1% | 15.1% |
| P/E | 28.4 | 33.4 |
| P/B | -41.6 | -26.5 |
| Current Ratio | 1.31 | 0.40 |
| Quick Ratio | 1.31 | 0.40 |
| D/E (Debt-to-Equity) | -4.25 | -5.09 |
| Debt-to-Assets | 61.6% | 58.2% |
| Interest Coverage | 5.83 | 5.42 |
| Asset Turnover | 0.86 | 0.96 |
| Fixed Asset Turnover | 17.1 | 9.37 |
| Payout ratio | 20.0% | 28.7% |
| Dividend yield | 0.70% | 0.86% |
Interpretation of the Ratios
Booking Holdings Inc.
Booking Holdings shows a mix of strong and weak ratios. Notably, it has a favorable net margin of 24.78% and a high return on invested capital at 44.14%, indicating efficient capital use. However, the negative return on equity (-146.32%) and a high debt-to-assets ratio (61.65%) raise concerns. The company pays a dividend with a low yield of 0.7%, suggesting limited shareholder returns and potential risks in payout sustainability.
Marriott International, Inc.
Marriott’s ratios are more challenged, with a neutral net margin of 9.46% and a favorable return on invested capital at 15.07%. Weaknesses include negative return on equity (-79.38%) and a poor current ratio of 0.4, indicating liquidity issues. Its dividend yield is 0.86%, but the company faces higher unfavorable ratios overall, reflecting cautious shareholder return prospects given financial constraints.
Which one has the best ratios?
Booking Holdings presents a slightly more favorable overall ratio profile, with 50% favorable ratios versus 35.71% for Marriott. Despite some concerning metrics like return on equity, Booking’s stronger profitability and capital efficiency outweigh Marriott’s liquidity and leverage weaknesses, which contribute to a slightly unfavorable view for Marriott’s financial health.
Strategic Positioning
This section compares the strategic positioning of Booking Holdings Inc. and Marriott International, Inc. across Market position, Key segments, and Exposure to technological disruption:
Booking Holdings Inc.
- Leading online travel services provider with strong market cap and NASDAQ listing; faces competitive pressure in digital travel.
- Diverse online travel segments: accommodation, car rentals, flights, restaurant bookings, and advertising revenues drive business.
- High exposure to digital innovation with multiple online platforms and price comparison services enhancing customer experience.
Marriott International, Inc.
- Large global hotel operator with significant market cap, competing in travel lodging sector worldwide.
- Focused on hotel operations, franchising, timeshare, and management services across multiple hotel brands globally.
- Moderate exposure to technological disruption; primarily reliant on physical hotel assets and franchise models.
Booking Holdings Inc. vs Marriott International, Inc. Positioning
Booking Holdings has a diversified digital travel services portfolio spanning various online platforms, while Marriott concentrates on hotel and lodging operations with multiple brand franchises. Booking’s broader service range offers varied revenue streams; Marriott’s scale in physical properties supports market presence but limits digital reach.
Which has the best competitive advantage?
Both companies demonstrate very favorable MOATs with growing ROIC and value creation, but Booking Holdings shows a significantly higher ROIC advantage, indicating a stronger and more durable competitive advantage in the travel industry.
Stock Comparison
The stock price dynamics over the past year reveal strong bullish trends for both Booking Holdings Inc. and Marriott International, Inc., with Booking showing higher volatility and acceleration in price gains compared to Marriott’s steadier growth.
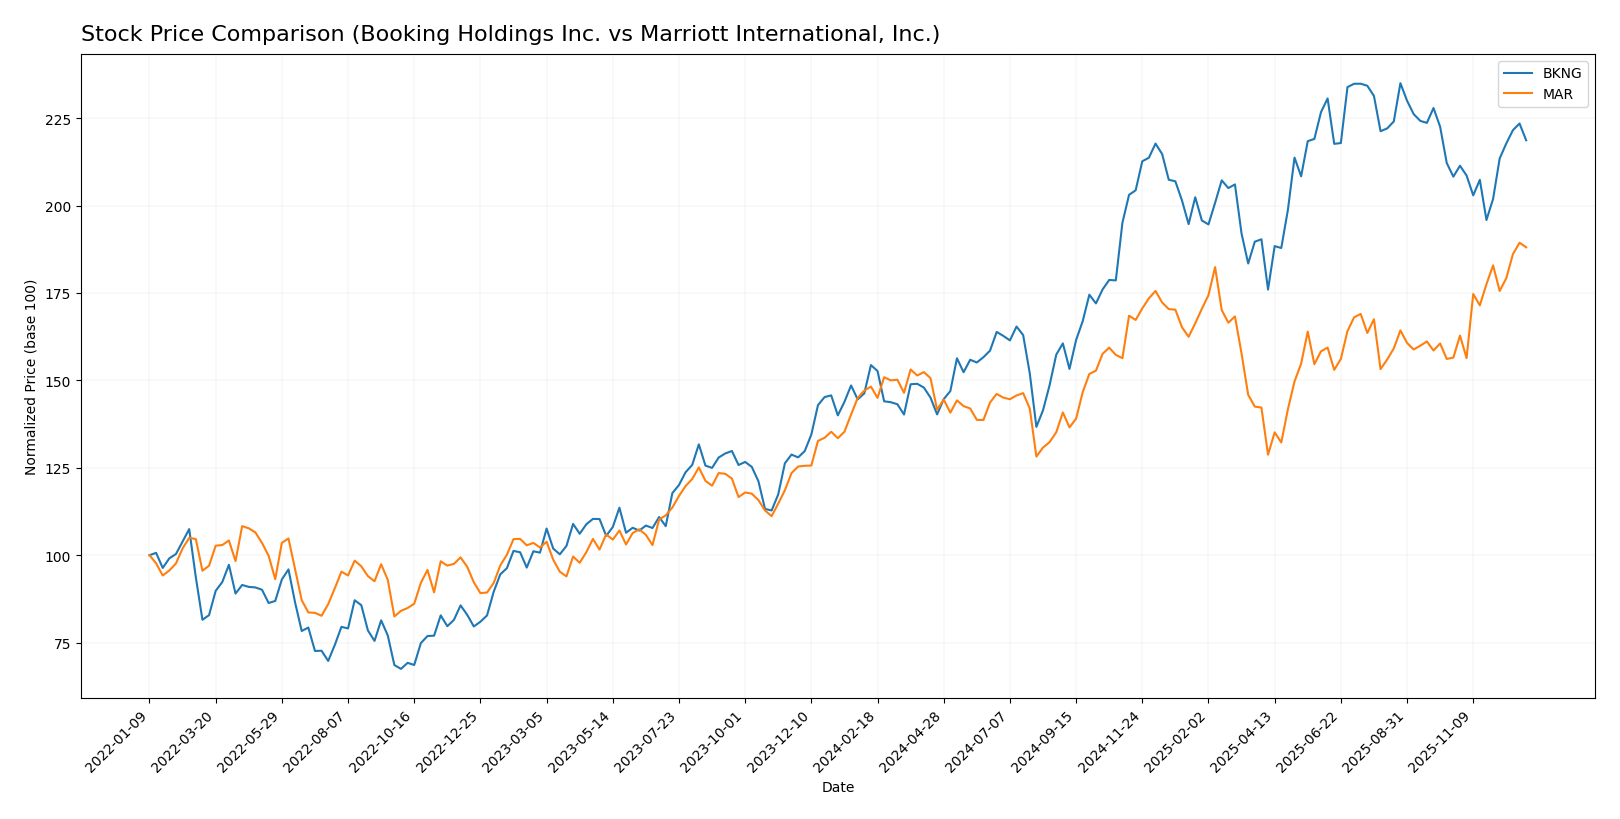
Trend Analysis
Booking Holdings Inc. (BKNG) experienced a 41.64% price increase over the past 12 months, indicating a bullish trend with accelerating momentum and significant volatility, reaching a high of 5720.87 and a low of 3328.13.
Marriott International, Inc. (MAR) posted a 26.88% price increase over the same period, also bullish with acceleration but much lower volatility, peaking at 315.58 and bottoming at 213.67.
Comparing the two, Booking Holdings delivered the highest market performance with a stronger price increase and acceleration, albeit with greater price fluctuation than Marriott.
Target Prices
The current analyst consensus indicates a positive outlook for both Booking Holdings Inc. and Marriott International, Inc.
| Company | Target High | Target Low | Consensus |
|---|---|---|---|
| Booking Holdings Inc. | 6806 | 5433 | 6078.47 |
| Marriott International, Inc. | 345 | 276 | 306.17 |
Analysts expect Booking Holdings’ price to rise above its current 5323.2 USD, while Marriott’s consensus target slightly exceeds its current 313.41 USD share price, suggesting moderate upside potential.
Analyst Opinions Comparison
This section compares analysts’ ratings and grades for Booking Holdings Inc. and Marriott International, Inc.:
Rating Comparison
Booking Holdings Inc. Rating
- Rating: B-, assessed as Very Favorable by analysts.
- Discounted Cash Flow Score: 5, indicating a Very Favorable valuation based on future cash flows.
- ROE Score: 1, considered Very Unfavorable for profitability efficiency.
- ROA Score: 5, rated Very Favorable for effective asset utilization.
- Debt To Equity Score: 1, Very Unfavorable, indicating higher financial risk.
- Overall Score: 3, a Moderate overall financial standing.
Marriott International, Inc. Rating
- Rating: C+, also assessed as Very Favorable by analysts.
- Discounted Cash Flow Score: 3, indicating a Moderate valuation based on future cash flows.
- ROE Score: 1, also Very Unfavorable for profitability efficiency.
- ROA Score: 5, rated Very Favorable for effective asset utilization.
- Debt To Equity Score: 1, Very Unfavorable, indicating higher financial risk.
- Overall Score: 2, a Moderate overall financial standing but lower than Booking Holdings.
Which one is the best rated?
Booking Holdings Inc. holds a higher overall rating (B-) and a superior discounted cash flow score than Marriott International, Inc. (C+), indicating a stronger valuation outlook, despite both sharing similar low scores in profitability efficiency and financial risk.
Scores Comparison
Here is a comparison of the financial scores for Booking Holdings Inc. and Marriott International, Inc.:
BKNG Scores
- Altman Z-Score: 7.16, indicating a safe zone with low bankruptcy risk.
- Piotroski Score: 7, classified as strong financial health.
MAR Scores
- Altman Z-Score: 3.76, indicating a safe zone with low bankruptcy risk.
- Piotroski Score: 8, classified as very strong financial health.
Which company has the best scores?
Marriott shows a slightly lower Altman Z-Score than Booking but remains in the safe zone, with a higher Piotroski Score indicating stronger financial health. Booking has a higher Altman Z-Score but a slightly lower Piotroski Score.
Grades Comparison
Here is the grades comparison for Booking Holdings Inc. and Marriott International, Inc.:
Booking Holdings Inc. Grades
The table below shows recent grades from reputable grading companies for Booking Holdings Inc.:
| Grading Company | Action | New Grade | Date |
|---|---|---|---|
| BTIG | Maintain | Buy | 2025-12-23 |
| B of A Securities | Upgrade | Buy | 2025-11-24 |
| BTIG | Maintain | Buy | 2025-11-24 |
| Wedbush | Upgrade | Outperform | 2025-11-13 |
| Barclays | Maintain | Overweight | 2025-10-29 |
| Truist Securities | Maintain | Buy | 2025-10-29 |
| Keybanc | Maintain | Overweight | 2025-10-29 |
| BTIG | Maintain | Buy | 2025-10-29 |
| Benchmark | Maintain | Buy | 2025-10-29 |
| Wells Fargo | Maintain | Equal Weight | 2025-10-29 |
Booking Holdings Inc. has maintained mostly buy and overweight ratings, with several upgrades and consistent positive sentiment.
Marriott International, Inc. Grades
The table below shows recent grades from reputable grading companies for Marriott International, Inc.:
| Grading Company | Action | New Grade | Date |
|---|---|---|---|
| Barclays | Maintain | Equal Weight | 2025-12-17 |
| Goldman Sachs | Upgrade | Buy | 2025-12-15 |
| Truist Securities | Maintain | Hold | 2025-12-04 |
| Barclays | Maintain | Equal Weight | 2025-11-05 |
| BMO Capital | Maintain | Market Perform | 2025-11-05 |
| Morgan Stanley | Maintain | Overweight | 2025-10-22 |
| Baird | Maintain | Neutral | 2025-10-21 |
| Barclays | Maintain | Equal Weight | 2025-10-03 |
| Truist Securities | Maintain | Hold | 2025-09-03 |
| Baird | Maintain | Neutral | 2025-08-20 |
Marriott International, Inc. displays a mix of hold, equal weight, and neutral ratings, with fewer buy upgrades compared to Booking Holdings Inc.
Which company has the best grades?
Booking Holdings Inc. has received stronger and more consistent buy and overweight grades relative to Marriott International, Inc., which shows more neutral and hold ratings. This difference suggests potentially more positive analyst sentiment towards Booking Holdings, which may influence investor confidence and portfolio positioning.
Strengths and Weaknesses
Below is a comparative overview of key strengths and weaknesses for Booking Holdings Inc. (BKNG) and Marriott International, Inc. (MAR) based on the most recent data.
| Criterion | Booking Holdings Inc. (BKNG) | Marriott International, Inc. (MAR) |
|---|---|---|
| Diversification | High revenue diversification: Merchant $14.1B, Agency $8.5B, Advertising $1.07B (2024) | Moderate diversification: Fee service $5.17B, Franchise $3.11B, Owned/Leased $1.55B (2024) |
| Profitability | Strong net margin at 24.78%, ROIC 44.14%, creating significant value | Moderate net margin 9.46%, ROIC 15.07%, also creating value but less efficiently |
| Innovation | Very favorable moat with growing ROIC (+13165%), indicating strong competitive advantage | Very favorable moat with growing ROIC (+6200%), solid but less pronounced innovation edge |
| Global presence | Extensive global reach through online platform and agency network | Large international footprint via owned, franchised hotels and management contracts |
| Market Share | Leading online travel agency with strong market share in digital bookings | Major global hotel operator with significant share in hospitality services |
Key takeaways: Booking Holdings demonstrates stronger profitability, higher diversification in revenue streams, and a more rapidly growing economic moat, signaling robust competitive positioning. Marriott, while solid and globally established, shows comparatively moderate profitability and diversification, suggesting a more conservative growth profile. Investors should weigh Booking’s innovation and efficiency against Marriott’s steady global presence and service portfolio.
Risk Analysis
Below is a comparative table of key risks for Booking Holdings Inc. (BKNG) and Marriott International, Inc. (MAR) based on their most recent financial and operational data in 2024.
| Metric | Booking Holdings Inc. (BKNG) | Marriott International, Inc. (MAR) |
|---|---|---|
| Market Risk | Beta 1.254, moderate volatility | Beta 1.156, slightly lower volatility |
| Debt level | Debt-to-assets 61.65% (unfavorable) | Debt-to-assets 58.21% (unfavorable) |
| Regulatory Risk | Moderate, travel industry regulations globally | Moderate, hospitality regulations globally |
| Operational Risk | Medium, reliance on online platforms and tech infrastructure | Medium-high, hotel operations and global workforce management |
| Environmental Risk | Medium, sustainability efforts impacting travel services | Medium-high, energy use and emissions in hotel operations |
| Geopolitical Risk | Moderate, exposure to international travel restrictions | Moderate, global presence affected by geopolitical tensions |
Booking Holdings faces significant market and debt risks with a higher beta and debt ratio, but benefits from strong operational efficiency. Marriott’s risks are heightened by operational complexities and environmental impact concerns. Both are vulnerable to geopolitical and regulatory changes affecting global travel.
Which Stock to Choose?
Booking Holdings Inc. (BKNG) shows strong income growth with a 249% revenue increase over five years and a 24.78% net margin in 2024. Its financial ratios are slightly favorable overall, marked by high ROIC (44.14%) and solid cash flow metrics. Despite a negative ROE and high debt-to-assets ratio, BKNG maintains a healthy current ratio and interest coverage, earning a very favorable B- rating.
Marriott International, Inc. (MAR) exhibits moderate income growth with 137% revenue growth over the period and a 9.46% net margin in 2024. Its financial ratios lean slightly unfavorable, affected by low liquidity ratios and high net debt to EBITDA. MAR’s ROIC is positive but lower (15.07%), and while it holds a very favorable C+ rating, some profitability and leverage metrics raise caution.
Considering ratings and financial evaluations, BKNG might appear more appealing for growth-oriented investors due to its robust income expansion, higher profitability, and stronger cash flow generation. Conversely, MAR could be seen as suitable for those prioritizing established market presence and moderate growth, though with higher financial risk. The choice could depend on an investor’s risk tolerance and strategic focus.
Disclaimer: Investment carries a risk of loss of initial capital. The past performance is not a reliable indicator of future results. Be sure to understand risks before making an investment decision.
Go Further
I encourage you to read the complete analyses of Booking Holdings Inc. and Marriott International, Inc. to enhance your investment decisions: