In the fast-evolving software infrastructure sector, Block, Inc. and Zscaler, Inc. stand out as innovative leaders with distinct market approaches. Block focuses on payment solutions and merchant services, while Zscaler specializes in cloud security, catering to the rising demand for safe digital environments. Their overlapping technology base and growth potential make them compelling candidates for investment. This article will help you identify which company offers the most promising opportunity for your portfolio.

Table of contents
Companies Overview
I will begin the comparison between Block, Inc. and Zscaler, Inc. by providing an overview of these two companies and their main differences.
Block, Inc. Overview
Block, Inc. focuses on creating tools that enable sellers to accept card payments, providing hardware and software solutions for point-of-sale transactions, reporting, and analytics. Its offerings include payment terminals, software for retail and restaurants, and a developer platform. The company serves multiple countries, including the US, Canada, Japan, and several European markets, positioning itself as a key player in payment infrastructure.
Zscaler, Inc. Overview
Zscaler, Inc. operates as a cloud security company delivering solutions for secure access to applications and digital experience monitoring. Its products include internet access security, private access for internal applications, and workload segmentation to prevent data breaches. Serving diverse industries globally, Zscaler is recognized for its cloud-native security platform aimed at protecting enterprise applications and data.
Key similarities and differences
Both companies operate in the technology sector within the software infrastructure industry, but their business models differ significantly. Block, Inc. centers on payment processing hardware and software solutions, while Zscaler focuses on cloud security services. Although both serve enterprise clients, Block targets payment acceptance and retail environments, whereas Zscaler specializes in cloud-based cybersecurity for various industries. Their employee counts and market capitalizations also highlight differences in scale and focus.
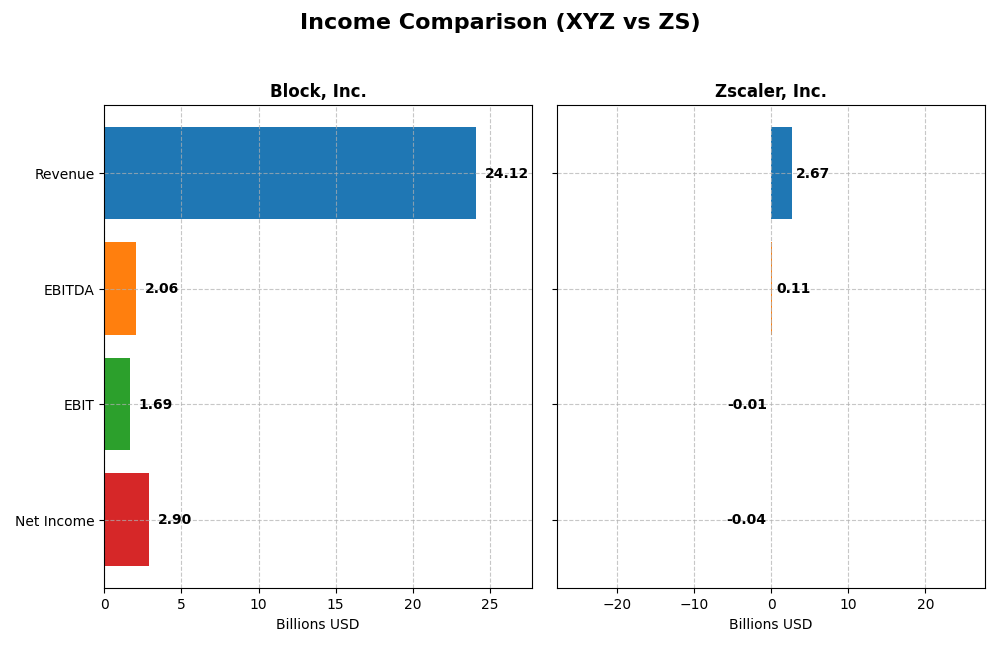
Income Statement Comparison
This table presents a side-by-side comparison of key income statement metrics for Block, Inc. and Zscaler, Inc. based on their most recent fiscal year data.
| Metric | Block, Inc. (XYZ) | Zscaler, Inc. (ZS) |
|---|---|---|
| Market Cap | 40.2B | 34.1B |
| Revenue | 24.1B | 2.7B |
| EBITDA | 2.1B | 112M |
| EBIT | 1.7B | -8.8M |
| Net Income | 2.9B | -41M |
| EPS | 4.7 | -0.27 |
| Fiscal Year | 2024 | 2025 |
Income Statement Interpretations
Block, Inc.
Block, Inc. showed strong revenue growth from 2020 to 2024, rising from $9.5B to $24.1B, with net income improving significantly from $213M to $2.9B. Gross margin remained favorable at 36.85%, while net margin also improved to 12.01%. In 2024, the company displayed robust profitability and substantial earnings growth, despite a slight unfavorable trend in operating expense growth relative to revenue.
Zscaler, Inc.
Zscaler, Inc. experienced rapid revenue growth from $673M in 2021 to $2.7B in 2025, with gross margin holding strong at 76.87%. However, the company maintained negative EBIT and net margins, at -0.33% and -1.55% respectively, reflecting ongoing losses. The 2025 fiscal year showed solid top-line expansion and improved net margin growth, but profitability remained elusive.
Which one has the stronger fundamentals?
Both companies exhibit favorable revenue and gross profit growth trends, with Block posting positive net income and expanding margins, contrasting with Zscaler’s persistent net losses despite its rapid growth. Block’s higher net margin and earnings growth indicate more established profitability, while Zscaler shows promise in scaling but faces challenges achieving positive bottom-line results.
Financial Ratios Comparison
The table below summarizes key financial ratios for Block, Inc. (XYZ) and Zscaler, Inc. (ZS) based on the most recent fiscal year data available, reflecting profitability, liquidity, leverage, and efficiency metrics.
| Ratios | Block, Inc. (XYZ) 2024 | Zscaler, Inc. (ZS) 2025 |
|---|---|---|
| ROE | 13.62% | -2.31% |
| ROIC | 3.03% | -3.18% |
| P/E | 18.1 | -1063.0 |
| P/B | 2.47 | 24.51 |
| Current Ratio | 2.33 | 2.01 |
| Quick Ratio | 2.31 | 2.01 |
| D/E (Debt-to-Equity) | 0.37 | 1.00 |
| Debt-to-Assets | 21.53% | 27.98% |
| Interest Coverage | 95.93 | -13.49 |
| Asset Turnover | 0.66 | 0.42 |
| Fixed Asset Turnover | 45.14 | 4.22 |
| Payout ratio | 0 | 0 |
| Dividend yield | 0 | 0 |
Interpretation of the Ratios
Block, Inc.
Block, Inc. shows a mixed ratio profile with 50% favorable indicators, including strong liquidity (current and quick ratios above 2.3) and excellent interest coverage (181.31). However, its return on invested capital (3.03%) and weighted average cost of capital (14.27%) are unfavorable, signaling capital efficiency challenges. The company does not pay dividends, reflecting likely reinvestment priorities or growth focus.
Zscaler, Inc.
Zscaler, Inc. presents weaker financial ratios with half rated unfavorable, notably negative profitability margins (net margin -1.55%) and poor returns (ROE -2.31%, ROIC -3.18%). Liquidity ratios remain solid around 2.0, but interest coverage is negative, indicating financial strain. It also pays no dividends, consistent with possible reinvestment in R&D or growth, amid ongoing losses.
Which one has the best ratios?
Comparing both, Block, Inc. holds a more balanced and slightly favorable ratio set, supported by solid liquidity and debt metrics. Conversely, Zscaler’s ratios reveal greater risks with multiple negative profitability and coverage ratios. Thus, Block, Inc.’s financial health appears stronger based on the explicit ratio evaluations provided.
Strategic Positioning
This section compares the strategic positioning of Block, Inc. and Zscaler, Inc. including their market position, key segments, and exposure to technological disruption:
Block, Inc.
- Large market cap of 40B with high beta, facing competitive pressure in software infrastructure.
- Diverse segments: software, cryptocurrency assets, hardware, and transactions drive revenue.
- Exposure to fintech and payment technology innovations with integrated hardware and software.
Zscaler, Inc.
- Market cap of 34B with moderate beta, competing in cloud security software.
- Focused on cloud security services including internet access and workload segmentation.
- Positioned in cloud security, addressing digital transformation and cloud-native threats.
Block, Inc. vs Zscaler, Inc. Positioning
Block’s strategy is diversified across payments, software, and cryptocurrency, offering broad revenue streams but potential complexity. Zscaler concentrates on cloud security, focusing resources on a specialized market with clear technological drivers. Each approach presents distinct operational and market challenges.
Which has the best competitive advantage?
Both companies are currently shedding value despite growing ROIC trends, indicating improving profitability but no sustained competitive advantage yet. Their slightly unfavorable moat status suggests cautious evaluation of long-term economic moats.
Stock Comparison
The stock prices of Block, Inc. and Zscaler, Inc. have both exhibited notable declines over the past year, with varying degrees of volatility and deceleration in their downward trends.
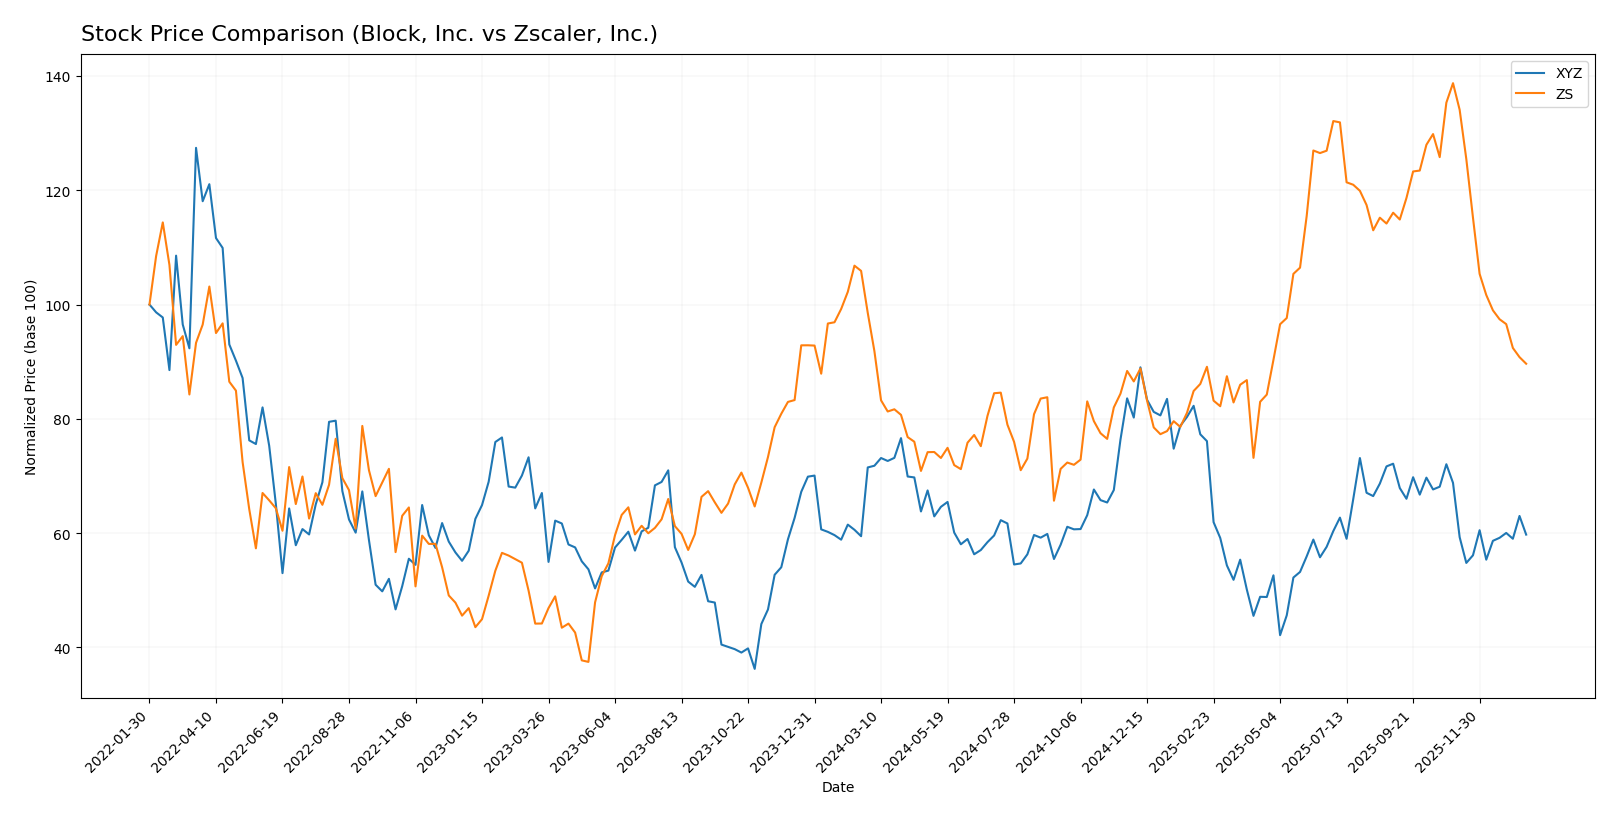
Trend Analysis
Block, Inc. (XYZ) showed a bearish trend over the past 12 months with a price decrease of -16.43%, accompanied by decelerating downward momentum and moderate volatility (std dev 10.43). The stock ranged between 46.53 and 98.25 during this period.
Zscaler, Inc. (ZS) also experienced a bearish trend in the same period, with a price decline of -9.03% and decelerated negative momentum, but with significantly higher volatility (std dev 47.11) and a wider price range from 156.78 to 331.14.
Comparing both, Block, Inc. posted a larger percentage loss than Zscaler, Inc., indicating that Zscaler delivered the relatively higher market performance despite both stocks trending downward over the past year.
Target Prices
The current analyst target price consensus for Block, Inc. and Zscaler, Inc. reflects optimism about their growth prospects.
| Company | Target High | Target Low | Consensus |
|---|---|---|---|
| Block, Inc. | 100 | 65 | 84.91 |
| Zscaler, Inc. | 360 | 260 | 311.41 |
Analysts expect Block, Inc.’s stock to appreciate moderately from its current price of 65.95 USD, while Zscaler, Inc. shows potential for significant upside from 213.98 USD based on consensus targets.
Analyst Opinions Comparison
This section compares analysts’ ratings and grades for Block, Inc. and Zscaler, Inc.:
Rating Comparison
Block, Inc. Rating
- Rating: B+ with a very favorable status.
- Discounted Cash Flow Score: Moderate at 3.
- ROE Score: Favorable at 4, indicating strong profit generation efficiency.
- ROA Score: Favorable at 4, showing effective asset utilization.
- Debt To Equity Score: Moderate at 2, indicating moderate financial risk.
- Overall Score: Moderate at 3.
Zscaler, Inc. Rating
- Rating: C- with a very favorable status.
- Discounted Cash Flow Score: Favorable at 4.
- ROE Score: Very unfavorable at 1, indicating weak profit generation.
- ROA Score: Very unfavorable at 1, showing poor asset utilization.
- Debt To Equity Score: Very unfavorable at 1, indicating high financial risk.
- Overall Score: Very unfavorable at 1.
Which one is the best rated?
Based strictly on the provided data, Block, Inc. is better rated overall, with moderate to favorable scores across key financial metrics, while Zscaler, Inc. shows mostly very unfavorable scores except for a favorable discounted cash flow score.
Scores Comparison
Below is a comparison of the financial scores for Block, Inc. and Zscaler, Inc.:
Block, Inc. Scores
- Altman Z-Score: 2.70, indicating a moderate bankruptcy risk (grey zone).
- Piotroski Score: 6, reflecting average financial strength.
Zscaler, Inc. Scores
- Altman Z-Score: 4.89, indicating low bankruptcy risk (safe zone).
- Piotroski Score: 3, reflecting very weak financial strength.
Which company has the best scores?
Zscaler, Inc. has a stronger Altman Z-Score, placing it in the safe zone, while Block, Inc. is in the grey zone. However, Block, Inc. has a higher Piotroski Score, showing better financial strength.
Grades Comparison
Here is a comparison of the latest reliable grades for Block, Inc. and Zscaler, Inc.:
Block, Inc. Grades
The following table summarizes recent grades and recommendations for Block, Inc.:
| Grading Company | Action | New Grade | Date |
|---|---|---|---|
| Piper Sandler | Maintain | Underweight | 2026-01-14 |
| Keefe, Bruyette & Woods | Maintain | Outperform | 2026-01-02 |
| Needham | Maintain | Buy | 2025-11-24 |
| B of A Securities | Maintain | Buy | 2025-11-21 |
| Morgan Stanley | Maintain | Equal Weight | 2025-11-21 |
| BTIG | Maintain | Buy | 2025-11-20 |
| RBC Capital | Maintain | Outperform | 2025-11-20 |
| Stephens & Co. | Maintain | Overweight | 2025-11-20 |
| Mizuho | Maintain | Outperform | 2025-11-20 |
| BTIG | Maintain | Buy | 2025-11-14 |
Overall, Block, Inc. has a mixed set of grades ranging from Underweight to Outperform, with a consensus of Buy, reflecting varied analyst views.
Zscaler, Inc. Grades
The following table presents recent grades and recommendations for Zscaler, Inc.:
| Grading Company | Action | New Grade | Date |
|---|---|---|---|
| Citigroup | Maintain | Buy | 2026-01-13 |
| Keybanc | Maintain | Overweight | 2026-01-12 |
| Piper Sandler | Maintain | Neutral | 2026-01-05 |
| RBC Capital | Maintain | Outperform | 2026-01-05 |
| Mizuho | Upgrade | Outperform | 2025-12-16 |
| Bernstein | Downgrade | Market Perform | 2025-12-01 |
| Citigroup | Maintain | Buy | 2025-12-01 |
| JP Morgan | Maintain | Overweight | 2025-11-26 |
| Baird | Maintain | Outperform | 2025-11-26 |
| BTIG | Maintain | Buy | 2025-11-26 |
Zscaler, Inc. shows mostly positive grades with some upgrades, a downgrade, and a consensus of Buy, indicating general analyst confidence with occasional caution.
Which company has the best grades?
Zscaler, Inc. has received more consistent positive ratings including multiple Outperform and Buy grades, whereas Block, Inc. has a wider range including some Underweight ratings. This suggests Zscaler may be viewed more favorably by analysts, which could influence investor sentiment and portfolio allocation decisions accordingly.
Strengths and Weaknesses
Below is a comparative overview of key strengths and weaknesses for Block, Inc. and Zscaler, Inc. based on the latest financial and operational data.
| Criterion | Block, Inc. (XYZ) | Zscaler, Inc. (ZS) |
|---|---|---|
| Diversification | Highly diversified: strong mix of software & data (7.16B), cryptocurrency assets (10.2B), transactions (6.61B), and hardware (143M) | Limited product segmentation: mainly one reportable segment with 2.67B revenue |
| Profitability | Moderate profitability: net margin 12.0%, ROE 13.6%, but ROIC (3.0%) below WACC (14.3%) indicating value destruction | Negative profitability: net margin -1.55%, ROE -2.31%, ROIC -3.18%, shedding value |
| Innovation | Growing ROIC trend +13.7%, reflecting improving efficiency and innovation potential | Strong ROIC growth +76.1%, signalling potential but currently unprofitable |
| Global presence | Well-established global payments and crypto ecosystem | Global cloud security provider with growing international footprint |
| Market Share | Significant presence in fintech and crypto markets | Leader in cloud security but with smaller scale compared to Block |
Key takeaways: Block, Inc. demonstrates solid diversification and improving profitability despite current value destruction, while Zscaler faces profitability challenges but shows strong innovation and growth potential. Investors should weigh Block’s broader market reach against Zscaler’s rapid ROIC growth but riskier financials.
Risk Analysis
Below is a comparative table of key risks for Block, Inc. (XYZ) and Zscaler, Inc. (ZS) based on the most recent data available in 2026:
| Metric | Block, Inc. (XYZ) | Zscaler, Inc. (ZS) |
|---|---|---|
| Market Risk | High beta (2.67) indicates elevated volatility. | Moderate beta (1.02), more stable market movement. |
| Debt level | Low debt-to-equity (0.37), favorable leverage. | Higher debt-to-equity (1.0), moderate financial risk. |
| Regulatory Risk | Moderate, due to fintech and payment processing regulations in multiple countries. | Moderate, facing evolving cloud security and privacy regulations globally. |
| Operational Risk | Diverse product suite but dependency on US and few international markets. | Cloud infrastructure reliance; risk of service disruptions or cyber threats. |
| Environmental Risk | Low direct impact, but growing scrutiny on tech hardware sustainability. | Low direct impact, with cloud operations focusing on energy efficiency. |
| Geopolitical Risk | Exposure in US, Canada, Japan, Australia, Europe; trade tensions could impact. | Global presence with emphasis on US and allied markets; moderate geopolitical exposure. |
Synthesis: Block faces higher market volatility and geopolitical exposure but benefits from strong liquidity and low debt. Zscaler, while more stable market-wise, has significant debt and operational risks linked to cloud security threats. Regulatory risks remain relevant for both, with Block’s fintech environment and Zscaler’s cybersecurity domain under close watch. Investors should weigh Block’s higher beta against Zscaler’s financial strain and operational vulnerabilities.
Which Stock to Choose?
Block, Inc. (XYZ) shows favorable income evolution with 10.06% revenue growth and a strong net margin of 12.01% in 2024. Its financial ratios are slightly favorable, highlighting good liquidity and low debt. Profitability is improving despite a slightly unfavorable ROIC vs WACC. The company holds a solid B+ rating with moderate scores on valuation and financial stability.
Zscaler, Inc. (ZS) reports robust revenue growth of 23.31% and a high gross margin of 76.87% in 2025, but suffers from negative net margin and profitability ratios. Its financial ratios are slightly unfavorable, with concerns on leverage and asset turnover. The ROIC trend is positive but below WACC, indicating value destruction. The company carries a C- rating with very unfavorable overall financial scores.
Investors prioritizing financial stability and improving profitability might find Block, Inc. a more fitting profile given its favorable income and ratio evaluations, while those focused on higher growth potential despite profitability challenges could consider Zscaler, Inc. The choice could depend on the investor’s risk tolerance and strategy emphasis.
Disclaimer: Investment carries a risk of loss of initial capital. The past performance is not a reliable indicator of future results. Be sure to understand risks before making an investment decision.
Go Further
I encourage you to read the complete analyses of Block, Inc. and Zscaler, Inc. to enhance your investment decisions: