Block, Inc. and Wix.com Ltd. stand out as prominent players in the software infrastructure industry, each innovating in distinct yet overlapping markets. Block focuses on payment solutions and business tools, while Wix empowers users with cloud-based website development platforms. This comparison explores their market strengths, innovation strategies, and growth potential. Join me as we identify which company presents the most compelling investment opportunity in 2026.

Table of contents
Companies Overview
I will begin the comparison between Block, Inc. and Wix.com Ltd. by providing an overview of these two companies and their main differences.
Block, Inc. Overview
Block, Inc. develops tools that enable sellers to accept card payments, offering hardware like Magstripe readers and software such as Square Point of Sale and Cash App. The company serves markets in the US, Canada, Japan, Australia, and Europe. Founded in 2009 and formerly known as Square, it focuses on providing integrated payment and business management solutions with a market cap of 40B USD and 12K employees.
Wix.com Ltd. Overview
Wix.com Ltd. operates a cloud-based platform allowing users to create websites and web applications globally. It offers tools like Wix Editor, Ascend by Wix for business automation, and Wix Payments. Founded in 2006, Wix serves a broad international user base with 222M registered users and 6M premium subscriptions. The company has a market cap of 4.5B USD and employs about 4,400 people.
Key similarities and differences
Both companies operate in the software infrastructure sector with complementary business models focused on enabling commerce and digital presence. Block centers on payment processing hardware and software for sellers, while Wix specializes in website creation and related online services. Block’s market cap and employee count significantly exceed Wix’s, reflecting a broader scale and product diversification.
Income Statement Comparison
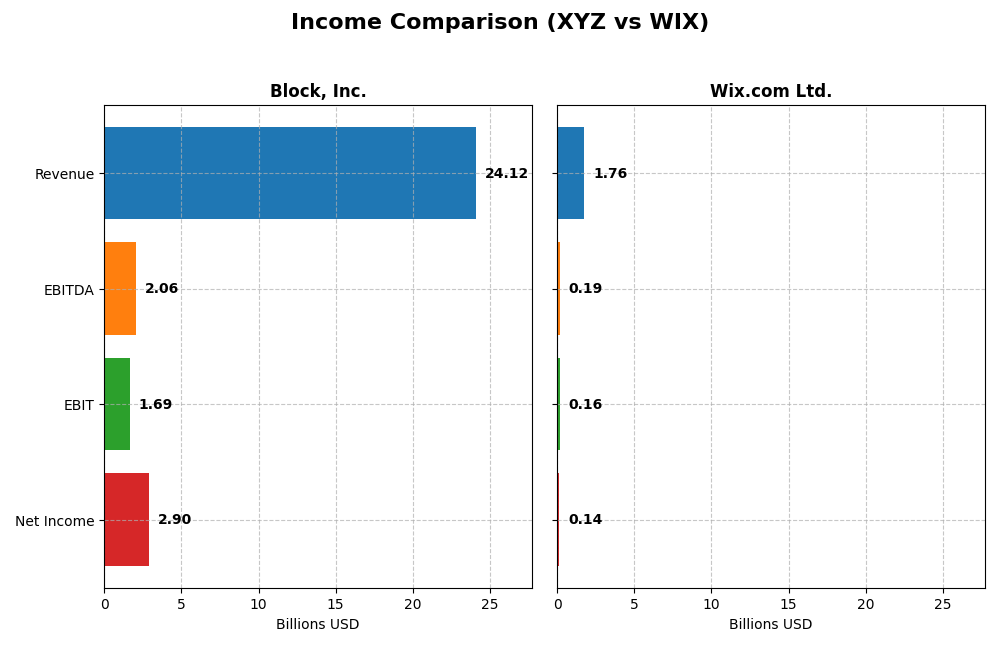
The table below compares key income statement metrics for Block, Inc. and Wix.com Ltd. for the fiscal year 2024, providing a snapshot of their financial performance.
| Metric | Block, Inc. (XYZ) | Wix.com Ltd. (WIX) |
|---|---|---|
| Market Cap | 40B | 4.5B |
| Revenue | 24.1B | 1.76B |
| EBITDA | 2.06B | 186M |
| EBIT | 1.69B | 155M |
| Net Income | 2.9B | 138M |
| EPS | 4.7 | 2.49 |
| Fiscal Year | 2024 | 2024 |
Income Statement Interpretations
Block, Inc.
Block, Inc. demonstrated strong revenue growth from $9.5B in 2020 to $24.1B in 2024, with net income rising sharply from $213M to $2.9B. Gross margin improved to 36.85%, while net margin reached 12.01%, reflecting enhanced profitability. In 2024, revenue growth slowed slightly to 10%, but net income surged substantially, showing margin expansion and operational leverage.
Wix.com Ltd.
Wix.com Ltd. increased revenue steadily from $984M in 2020 to $1.76B in 2024, alongside net income growth from a loss of $167M to a profit of $138M. Gross margin remained consistently high near 68%, with net margin improving to 7.86%. The latest fiscal year showed favorable revenue and net income growth of 12.7% and 270%, respectively, indicating improved operational efficiency and profitability.
Which one has the stronger fundamentals?
Both companies show favorable income statement trends with growing revenues and improving net margins. Block, Inc. exhibits more pronounced net income growth and higher net margins, though with slightly lower gross margins. Wix.com boasts a higher gross margin and consistent margin improvement. Ultimately, Block’s rapid earnings growth contrasts with Wix’s steadier margin expansion, reflecting different growth and profitability profiles.
Financial Ratios Comparison
This table presents the key financial ratios for Block, Inc. and Wix.com Ltd. for the fiscal year 2024, facilitating a straightforward comparison of their recent financial performance.
| Ratios | Block, Inc. (XYZ) | Wix.com Ltd. (WIX) |
|---|---|---|
| ROE | 13.62% | -175.57% |
| ROIC | 3.03% | 9.13% |
| P/E | 18.1 | 86.21 |
| P/B | 2.47 | -151.35 |
| Current Ratio | 2.33 | 0.84 |
| Quick Ratio | 2.31 | 0.84 |
| D/E | 0.37 | -12.31 |
| Debt-to-Assets | 21.53% | 50.70% |
| Interest Coverage | 95.93 | 25.92 |
| Asset Turnover | 0.66 | 0.92 |
| Fixed Asset Turnover | 45.14 | 3.33 |
| Payout ratio | 0 | 0 |
| Dividend yield | 0 | 0 |
Interpretation of the Ratios
Block, Inc.
Block, Inc. shows a mix of strong and neutral financial ratios, with favorable liquidity (current ratio 2.33) and low leverage (debt-to-equity 0.37). Its return on equity (13.62%) and net margin (12.01%) are positive but ROIC (3.03%) and WACC (14.27%) indicate some inefficiency. The company does not pay dividends, focusing on growth and reinvestment.
Wix.com Ltd.
Wix.com Ltd. presents weaker liquidity (current ratio 0.84) and an unfavorable return on equity (-175.57%), with a high price-to-earnings ratio (86.21) signaling expensive valuation. However, it benefits from favorable interest coverage (40.14) and a negative debt-to-equity ratio, reflecting net cash. Wix does not pay dividends, likely prioritizing reinvestment and growth.
Which one has the best ratios?
Block, Inc. holds a more balanced and slightly favorable ratio profile, with solid liquidity and moderate profitability metrics. Wix.com Ltd. appears more leveraged and less profitable with several unfavorable ratios, resulting in a slightly unfavorable overall evaluation. Thus, Block, Inc. demonstrates comparatively stronger financial ratios.
Strategic Positioning
This section compares the strategic positioning of Block, Inc. and Wix.com Ltd. across Market position, Key segments, and Exposure to technological disruption:
Block, Inc.
- Large market cap of 40B USD, faces competitive pressure in software infrastructure.
- Diverse segments: software, cryptocurrency assets, hardware, and transaction services.
- Exposure to blockchain and payment tech disruption through cryptocurrency services.
Wix.com Ltd.
- Smaller market cap of 4.5B USD, competing in cloud-based website and app development platforms.
- Focused on business solutions and creative subscriptions as primary revenue drivers.
- Faces disruption risk from evolving cloud tech and AI-driven website development tools.
Block, Inc. vs Wix.com Ltd. Positioning
Block, Inc. pursues a diversified strategy spanning payments, crypto assets, and hardware, offering broad market exposure. Wix.com Ltd. concentrates on cloud-based creative and business solutions, focusing on website creation and user engagement platforms. Diversification offers multiple growth drivers; concentration may allow specialization.
Which has the best competitive advantage?
Both companies show slightly unfavorable MOAT evaluations, shedding value despite growing ROIC trends. Block’s larger scale and diversified offerings contrast with Wix’s focused niche and strong user base, making their competitive advantages context-dependent within their industries.
Stock Comparison
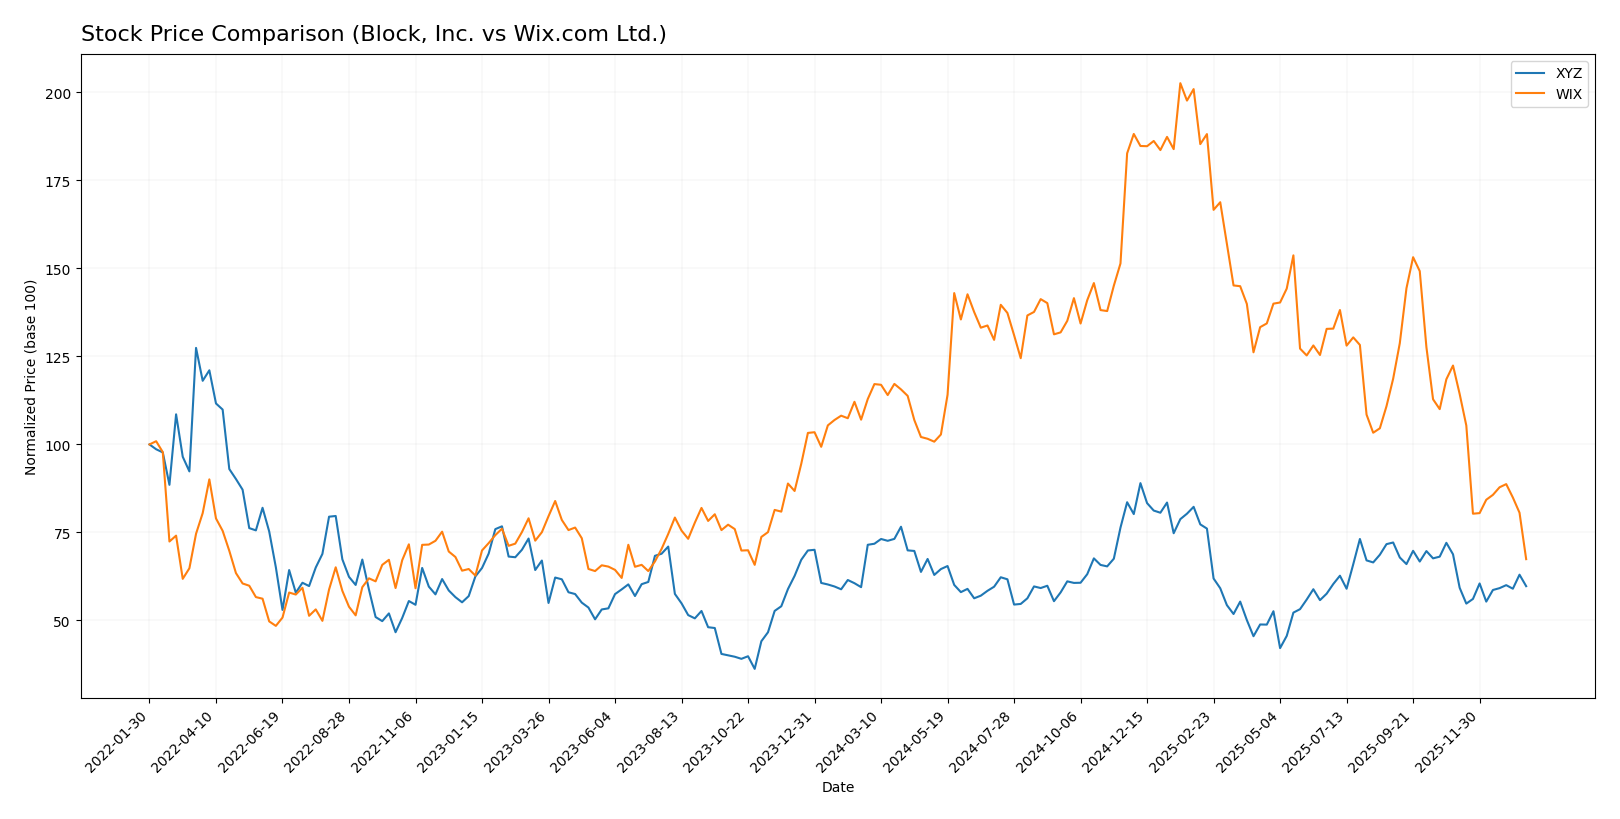
The stock price movements of Block, Inc. and Wix.com Ltd. over the past year reveal contrasting bearish trends, with significant declines and notable volatility shaping trading dynamics.
Trend Analysis
Block, Inc. experienced a bearish trend over the past 12 months with a -16.43% price change, showing deceleration in the downtrend and a standard deviation of 10.43. The stock traded between 46.53 and 98.25 during this period.
Wix.com Ltd. showed a stronger bearish trend, declining by -40.28% over the same 12-month period with deceleration evident and higher volatility, reflected in a 34.39 standard deviation and a price range from 80.16 to 240.89.
Comparing the two, Block, Inc. delivered a less severe market performance decline than Wix.com Ltd., indicating relatively better resilience despite both stocks trending downward.
Target Prices
The current target price consensus for Block, Inc. and Wix.com Ltd. reflects a generally positive outlook from analysts.
| Company | Target High | Target Low | Consensus |
|---|---|---|---|
| Block, Inc. | 100 | 65 | 84.91 |
| Wix.com Ltd. | 210 | 70 | 160.27 |
Analysts expect Block, Inc.’s stock price to rise moderately above its current 65.95 USD, while Wix.com Ltd. shows potential for significant upside from its current 80.16 USD price.
Analyst Opinions Comparison
This section compares analysts’ ratings and grades for Block, Inc. and Wix.com Ltd.:
Rating Comparison
Block, Inc. Rating
- Rating: B+, classified as Very Favorable by analysts.
- Discounted Cash Flow Score: 3, indicating a moderate valuation outlook.
- ROE Score: 4, showing favorable efficiency in generating equity returns.
- ROA Score: 4, indicating favorable asset utilization.
- Debt To Equity Score: 2, suggesting moderate financial risk.
- Overall Score: 3, a moderate overall financial assessment.
Wix.com Ltd. Rating
- Rating: C, classified as Very Favorable by analysts.
- Discounted Cash Flow Score: 3, indicating a moderate valuation outlook.
- ROE Score: 1, reflecting a very unfavorable return on equity.
- ROA Score: 4, indicating favorable asset utilization.
- Debt To Equity Score: 1, indicating very unfavorable financial risk.
- Overall Score: 2, a moderate overall financial assessment.
Which one is the best rated?
Block, Inc. holds a higher rating of B+ compared to Wix.com Ltd.’s C, supported by stronger ROE and debt-to-equity scores. Both have moderate DCF and overall scores, but Block shows better financial efficiency and lower risk.
Scores Comparison
Here is a comparison of the financial scores for Block, Inc. and Wix.com Ltd.:
Block, Inc. Scores
- Altman Z-Score: 2.70, in the grey zone indicating moderate bankruptcy risk.
- Piotroski Score: 6, reflecting average financial strength.
Wix.com Ltd. Scores
- Altman Z-Score: 1.83, also in the grey zone with moderate bankruptcy risk.
- Piotroski Score: 6, reflecting average financial strength.
Which company has the best scores?
Both Block, Inc. and Wix.com Ltd. have Altman Z-Scores placing them in the grey zone, indicating moderate risk. Their Piotroski Scores are equal at 6, showing average financial health. Neither company shows a clear advantage based on these scores alone.
Grades Comparison
The following presents the recent reliable grades and ratings for Block, Inc. and Wix.com Ltd.:
Block, Inc. Grades
This table summarizes recent actions and grades from reputable grading companies for Block, Inc.:
| Grading Company | Action | New Grade | Date |
|---|---|---|---|
| Piper Sandler | maintain | Underweight | 2026-01-14 |
| Keefe, Bruyette & Woods | maintain | Outperform | 2026-01-02 |
| Needham | maintain | Buy | 2025-11-24 |
| B of A Securities | maintain | Buy | 2025-11-21 |
| Morgan Stanley | maintain | Equal Weight | 2025-11-21 |
| BTIG | maintain | Buy | 2025-11-20 |
| RBC Capital | maintain | Outperform | 2025-11-20 |
| Stephens & Co. | maintain | Overweight | 2025-11-20 |
| Mizuho | maintain | Outperform | 2025-11-20 |
| BTIG | maintain | Buy | 2025-11-14 |
Block, Inc.’s grades predominantly indicate a positive outlook with multiple Buy and Outperform ratings, alongside a few Hold-equivalent and one Underweight grade.
Wix.com Ltd. Grades
This table summarizes recent actions and grades from reputable grading companies for Wix.com Ltd.:
| Grading Company | Action | New Grade | Date |
|---|---|---|---|
| Morgan Stanley | maintain | Overweight | 2026-01-15 |
| Wells Fargo | maintain | Overweight | 2025-12-19 |
| Cantor Fitzgerald | maintain | Overweight | 2025-12-11 |
| Citigroup | maintain | Buy | 2025-11-20 |
| Citizens | maintain | Market Outperform | 2025-11-20 |
| Cantor Fitzgerald | maintain | Overweight | 2025-11-20 |
| Scotiabank | maintain | Sector Outperform | 2025-11-20 |
| Evercore ISI Group | maintain | Outperform | 2025-11-20 |
| Needham | maintain | Buy | 2025-11-20 |
| B. Riley Securities | maintain | Buy | 2025-11-20 |
Wix.com Ltd. consistently receives positive grades, with a predominance of Overweight, Buy, and Outperform ratings, reflecting a broadly favorable consensus.
Which company has the best grades?
Both companies hold a consensus rating of “Buy,” but Wix.com Ltd. shows a stronger pattern of Overweight and Outperform grades with no Underweight ratings. This may indicate a more uniformly positive analyst sentiment for Wix.com Ltd., which investors might interpret as reflecting relatively better perceived growth or stability potential.
Strengths and Weaknesses
Below is a comparison of key strengths and weaknesses of Block, Inc. (XYZ) and Wix.com Ltd. (WIX) based on their most recent data and financial metrics.
| Criterion | Block, Inc. (XYZ) | Wix.com Ltd. (WIX) |
|---|---|---|
| Diversification | Highly diversified with revenues from Software & Data Products (7.16B), Cryptocurrency Assets (10.2B), Hardware, and Transaction services | Revenue primarily from Business Solutions (496M) and Creative Subscription (1.26B), less diversified |
| Profitability | Net margin 12.01% (favorable), ROE 13.62% (neutral), but ROIC 3.03% below WACC (14.27%), indicating value destruction | Net margin 7.86% (neutral), ROIC 9.13% near WACC (9.35%), but negative ROE (-175.57%) and high P/E (86.2) suggest profitability challenges |
| Innovation | Strong growth in software and crypto-related products; improving ROIC trend (+13.7%) despite current value destruction | Growing ROIC trend (+158.9%) and favorable fixed asset turnover, but financials indicate mixed operational efficiency |
| Global presence | Strong global reach with digital payments and crypto assets; diversified transaction platforms | International presence focused on web development and creative tools, smaller scale than Block |
| Market Share | Significant market position in payments and crypto sectors; large transaction volumes | Niche player in website development subscriptions, smaller market footprint |
Key takeaways: Both companies show growing profitability trends but are currently slightly value destructive. Block, Inc. stands out with greater diversification and stronger profitability metrics, while Wix.com shows potential in innovation but faces financial stability concerns. Investors should weigh risk carefully.
Risk Analysis
Below is a comparative risk profile table for Block, Inc. (XYZ) and Wix.com Ltd. (WIX) based on the most recent 2024 data:
| Metric | Block, Inc. (XYZ) | Wix.com Ltd. (WIX) |
|---|---|---|
| Market Risk | High beta at 2.67, indicating high volatility | Moderate beta at 1.42, less volatile |
| Debt level | Low debt-to-equity ratio of 0.37, favorable | Negative debt-to-equity (-12.31), flagged but complex due to accounting; debt-to-assets high at 50.7%, unfavorable |
| Regulatory Risk | Moderate, US and international operations with financial services regulation | Moderate, operating globally with data privacy and e-commerce regulations |
| Operational Risk | Medium, reliant on hardware and software integration | Medium, heavily dependent on cloud infrastructure and platform stability |
| Environmental Risk | Low, primarily software and payments hardware | Low, primarily cloud-based software services |
| Geopolitical Risk | Moderate, presence in multiple countries including US, Japan, EU | Moderate to high, headquartered in Israel with exposure to geopolitical tensions |
In synthesis, Block, Inc. faces significant market risk due to its high beta but maintains strong financial health with low debt and solid liquidity. Wix.com shows financial vulnerabilities with a high debt-to-assets ratio and negative debt-to-equity, increasing financial risk. Both companies operate globally, exposing them to regulatory and geopolitical uncertainties, but Block’s diversified hardware/software ecosystem could offer more resilience. Investors should weigh Block’s higher volatility against Wix’s financial leverage risks when considering portfolio inclusion.
Which Stock to Choose?
Block, Inc. (XYZ) shows a favorable income evolution with a 10.06% revenue growth in 2024 and strong profitability metrics including a 12.01% net margin. Its financial ratios reveal a balanced debt profile and solid liquidity, supported by a B+ rating and a slightly favorable global ratios opinion.
Wix.com Ltd. (WIX) reports robust revenue growth of 12.74% in 2024 and favorable gross margin levels, though profitability ratios such as ROE are negative. Despite some unfavorable leverage ratios and a C rating, the company demonstrates a favorable income statement growth and slightly unfavorable global ratios evaluation.
Investors focused on stable profitability and balanced financial health might find Block, Inc. more aligned with their profile, while those open to higher risk and seeking growth potential could interpret Wix.com Ltd.’s improving income growth and expanding ROIC trend as attractive, despite weaker financial ratios.
Disclaimer: Investment carries a risk of loss of initial capital. The past performance is not a reliable indicator of future results. Be sure to understand risks before making an investment decision.
Go Further
I encourage you to read the complete analyses of Block, Inc. and Wix.com Ltd. to enhance your investment decisions: