In today’s rapidly evolving technology landscape, Block, Inc. and VeriSign, Inc. stand out as key players in software infrastructure, each driving innovation in unique ways. Block revolutionizes payment solutions and small business tools, while VeriSign secures critical internet domain services. As both companies shape essential digital ecosystems, this article will help you decide which presents the most compelling investment opportunity in 2026.
Table of contents
Companies Overview
I will begin the comparison between Block, Inc. and VeriSign, Inc. by providing an overview of these two companies and their main differences.
Block, Inc. Overview
Block, Inc. focuses on creating tools that enable sellers to accept card payments, provide reporting and analytics, and offer next-day settlement. Its product range includes hardware like Magstripe readers and Square Register, as well as software solutions such as Square Point of Sale and Cash App. Founded in 2009 and headquartered in Oakland, CA, Block serves markets in the US, Canada, Japan, Australia, and Europe, positioning itself in the software infrastructure sector.
VeriSign, Inc. Overview
VeriSign, Inc. specializes in domain name registry services and internet infrastructure, supporting recognized domain names worldwide. It operates root zone maintainer services and servers for domains including .com and .net, underpinning global e-commerce security and stability. Established in 1995 and based in Reston, VA, VeriSign employs fewer than 1,000 people and operates within the technology sector focusing on internet infrastructure.
Key similarities and differences
Both companies operate in the technology sector, specifically in software infrastructure, but serve distinct niches: Block targets payment solutions and financial tools for sellers, while VeriSign manages domain registry and internet security services. Block has a larger workforce and broader geographic reach, whereas VeriSign focuses on critical internet infrastructure with a smaller team. Their business models differ fundamentally—Block emphasizes transactional hardware and software, while VeriSign centers on domain and network infrastructure services.
Income Statement Comparison
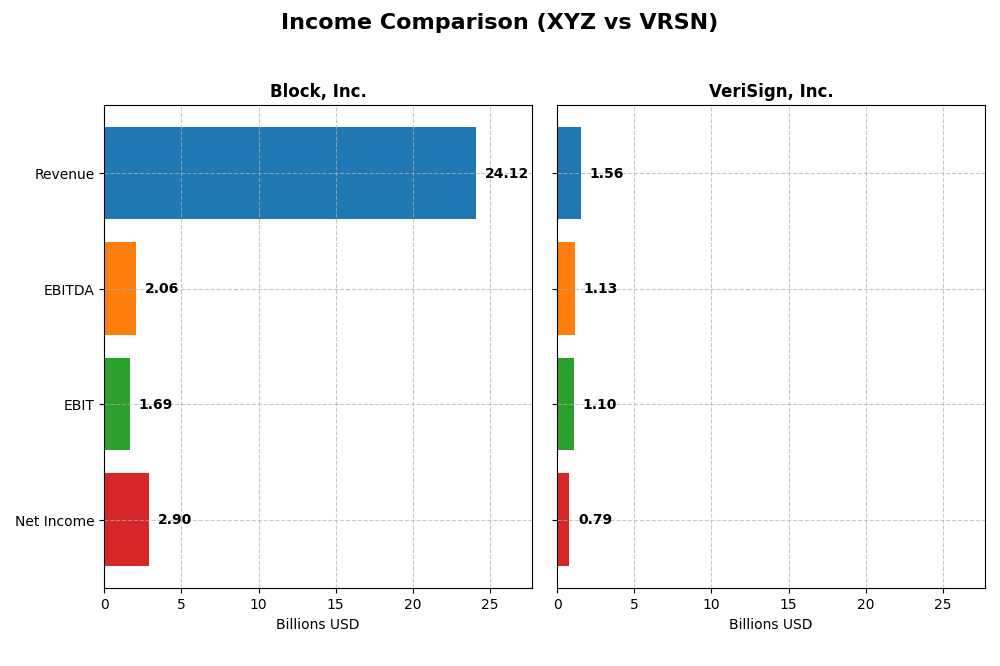
The table below presents a side-by-side comparison of key income statement metrics for Block, Inc. and VeriSign, Inc. for the fiscal year 2024, highlighting their financial performance.
| Metric | Block, Inc. (XYZ) | VeriSign, Inc. (VRSN) |
|---|---|---|
| Market Cap | 40.2B | 23.1B |
| Revenue | 24.1B | 1.56B |
| EBITDA | 2.06B | 1.13B |
| EBIT | 1.69B | 1.10B |
| Net Income | 2.90B | 786M |
| EPS | 4.7 | 8.01 |
| Fiscal Year | 2024 | 2024 |
Income Statement Interpretations
Block, Inc.
Block, Inc. demonstrated strong growth in revenue and net income from 2020 to 2024, with revenue increasing from $9.5B to $24.1B and net income turning positive in 2023 and surging to $2.9B in 2024. Gross margin improved to 36.85%, while net margin reached 12.01%. The latest year saw significant margin expansion and strong earnings growth despite rising operating expenses.
VeriSign, Inc.
VeriSign, Inc. showed steady revenue growth from $1.27B in 2020 to $1.56B in 2024, with net income fluctuating and declining slightly overall to $786M. Margins remain robust, with a gross margin of 87.71% and a net margin of 50.45%. The most recent year’s revenue growth slowed to 4.3%, and net margin decreased by 7.9%, reflecting some margin pressure despite solid profitability.
Which one has the stronger fundamentals?
Block, Inc. exhibits stronger fundamentals with rapid revenue and net income growth, favorable margin expansion, and a high percentage of favorable income statement metrics. VeriSign maintains higher margins but faces declining net income and margin contractions over the period. Overall, Block’s growth dynamics contrast with VeriSign’s stable yet less dynamic earnings performance.
Financial Ratios Comparison
Below is a comparison of key financial ratios for Block, Inc. and VeriSign, Inc. based on their most recent fiscal year data.
| Ratios | Block, Inc. (XYZ) | VeriSign, Inc. (VRSN) |
|---|---|---|
| ROE | 13.62% | -40.13% |
| ROIC | 3.03% | 451.00% |
| P/E | 18.10 | 25.84 |
| P/B | 2.47 | -10.37 |
| Current Ratio | 2.33 | 0.43 |
| Quick Ratio | 2.31 | 0.43 |
| D/E (Debt-to-Equity) | 0.37 | -0.92 |
| Debt-to-Assets | 21.53% | 128.08% |
| Interest Coverage | 95.93 | 14.05 |
| Asset Turnover | 0.66 | 1.11 |
| Fixed Asset Turnover | 45.14 | 6.66 |
| Payout Ratio | 0% | 0% |
| Dividend Yield | 0% | 0% |
Interpretation of the Ratios
Block, Inc.
Block, Inc. presents a slightly favorable ratio profile with strong liquidity indicated by a current ratio of 2.33 and a low debt-to-equity of 0.37. While the net margin is favorable at 12.01%, the return on invested capital (3.03%) and weighted average cost of capital (14.27%) raise some concerns. The company does not pay dividends, likely reflecting a reinvestment or growth strategy.
VeriSign, Inc.
VeriSign, Inc. shows a favorable overall ratio picture, with a very strong net margin of 50.45% and an impressive return on invested capital of 451%. However, the negative return on equity (-40.13%) and weak liquidity ratios (current and quick ratios at 0.43) highlight potential risks. VeriSign does not pay dividends, which may suggest prioritizing operational investments or managing financial structure.
Which one has the best ratios?
VeriSign has a more favorable overall ratio evaluation with stronger profitability and return metrics, despite liquidity weaknesses. Block, Inc. shows a more balanced liquidity and debt profile but faces challenges with capital returns. Both companies have zero dividend yields, reflecting distinct financial strategies rather than shareholder cash returns.
Strategic Positioning
This section compares the strategic positioning of Block, Inc. and VeriSign, Inc. in terms of Market position, Key segments, and Exposure to technological disruption:
Block, Inc.
- Competes in payments and commerce software with strong competitive pressure in technology infrastructure.
- Revenue driven by software, cryptocurrency assets, hardware, and transaction services across multiple countries.
- Faces disruption risks from evolving payment technologies and cryptocurrency markets.
VeriSign, Inc.
- Operates as a dominant domain registry with limited direct competition in internet infrastructure.
- Focuses on domain name registry services and internet infrastructure supporting global e-commerce.
- Maintains stability with exposure mainly to internet infrastructure security and domain services.
Block, Inc. vs VeriSign, Inc. Positioning
Block pursues a diversified strategy across payments, software, cryptocurrency, and hardware, exposing it to various market dynamics. VeriSign operates a concentrated niche in domain registry and internet infrastructure, benefiting from specialized market control but narrower segment exposure.
Which has the best competitive advantage?
VeriSign demonstrates a very favorable MOAT with strong value creation and growing ROIC, indicating a durable competitive advantage. Block shows a slightly unfavorable MOAT, shedding value despite improving profitability, suggesting weaker competitive sustainability.
Stock Comparison
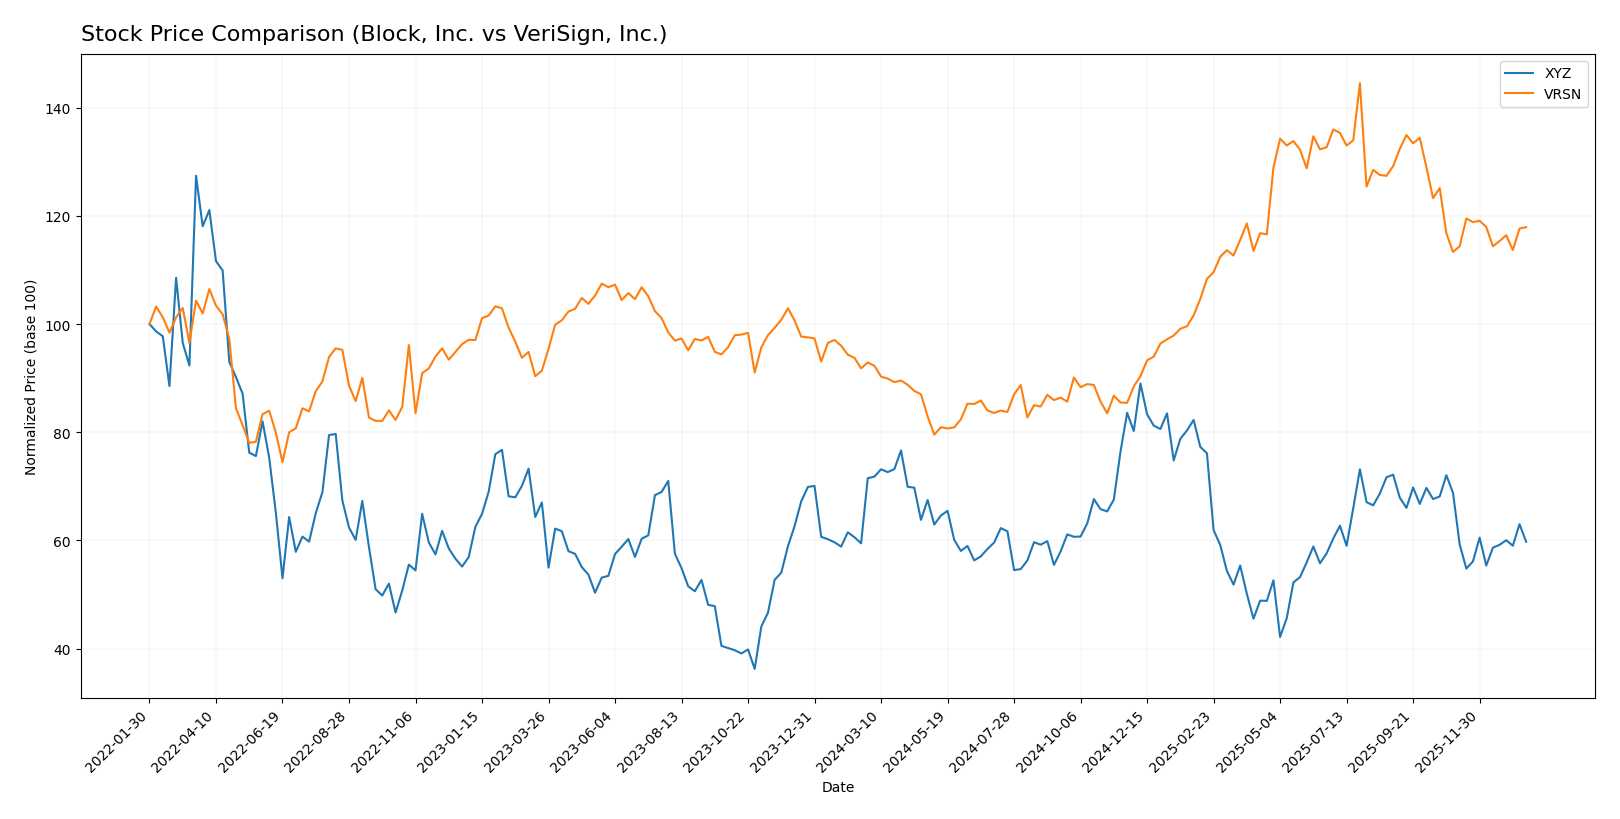
The stock price chart highlights notable divergence in price movements and trading activity between Block, Inc. and VeriSign, Inc. over the past 12 months, with contrasting trends and volume dynamics shaping their market performance.
Trend Analysis
Block, Inc. (XYZ) experienced a bearish trend over the past year with a -16.43% price change, showing deceleration in its downward movement and significant volatility indicated by a 10.43 standard deviation.
VeriSign, Inc. (VRSN) demonstrated a bullish trend with a 26.92% price increase over the same period, also decelerating but with higher volatility at 40.88 standard deviation and a recent positive slope.
Comparing both, VeriSign, Inc. outperformed Block, Inc. with a clear bullish trend and a higher percentage gain in market value over the last 12 months.
Target Prices
The current analyst target price consensus shows promising upside potential for both Block, Inc. and VeriSign, Inc.
| Company | Target High | Target Low | Consensus |
|---|---|---|---|
| Block, Inc. | 100 | 65 | 84.91 |
| VeriSign, Inc. | 325 | 325 | 325 |
Analysts expect Block, Inc. shares to rise from the current price of 65.95 toward the consensus of 84.91, indicating moderate upside. VeriSign, Inc.’s consensus target of 325 is significantly above its current 249.47 price, suggesting strong potential appreciation.
Analyst Opinions Comparison
This section compares analysts’ ratings and grades for Block, Inc. and VeriSign, Inc.:
Rating Comparison
Block, Inc. Rating
- Rating: B+ indicating a very favorable overall assessment by analysts.
- Discounted Cash Flow Score: Moderate score of 3, suggesting fair valuation outlook.
- ROE Score: Favorable score of 4, showing efficient profit generation from equity.
- ROA Score: Favorable score of 4, demonstrating effective asset utilization.
- Debt To Equity Score: Moderate score of 2, reflecting balanced financial risk.
- Overall Score: Moderate score of 3, summarizing a balanced financial standing.
VeriSign, Inc. Rating
- Rating: B- reflecting a very favorable overall assessment by analysts.
- Discounted Cash Flow Score: Favorable score of 4, indicating better future cash flow valuation.
- ROE Score: Very unfavorable score of 1, indicating low efficiency in generating equity returns.
- ROA Score: Very favorable score of 5, indicating excellent asset usage.
- Debt To Equity Score: Very unfavorable score of 1, indicating higher financial risk.
- Overall Score: Moderate score of 2, suggesting a somewhat lower overall financial standing.
Which one is the best rated?
Block, Inc. holds a higher overall rating (B+) compared to VeriSign, Inc. (B-), with stronger ROE and lower financial risk. VeriSign excels in discounted cash flow and ROA but has weaker equity returns and higher debt risk based on the data.
Scores Comparison
Here is a comparison of the financial health scores for Block, Inc. and VeriSign, Inc.:
Block, Inc. Scores
- Altman Z-Score: 2.70, in the grey zone indicating moderate bankruptcy risk.
- Piotroski Score: 6, classified as average financial strength.
VeriSign, Inc. Scores
- Altman Z-Score: -4.67, in the distress zone indicating high bankruptcy risk.
- Piotroski Score: 8, classified as very strong financial strength.
Which company has the best scores?
VeriSign has a notably stronger Piotroski Score, reflecting robust financial health, but a poor Altman Z-Score indicating distress. Block is in the moderate risk grey zone but has an average Piotroski Score. The scores show mixed signals for each company.
Grades Comparison
Here is the comparison of the latest grades issued by recognized grading companies for Block, Inc. and VeriSign, Inc.:
Block, Inc. Grades
The table below summarizes recent grades from established grading firms for Block, Inc.:
| Grading Company | Action | New Grade | Date |
|---|---|---|---|
| Piper Sandler | Maintain | Underweight | 2026-01-14 |
| Keefe, Bruyette & Woods | Maintain | Outperform | 2026-01-02 |
| Needham | Maintain | Buy | 2025-11-24 |
| B of A Securities | Maintain | Buy | 2025-11-21 |
| Morgan Stanley | Maintain | Equal Weight | 2025-11-21 |
| BTIG | Maintain | Buy | 2025-11-20 |
| RBC Capital | Maintain | Outperform | 2025-11-20 |
| Stephens & Co. | Maintain | Overweight | 2025-11-20 |
| Mizuho | Maintain | Outperform | 2025-11-20 |
| BTIG | Maintain | Buy | 2025-11-14 |
The grades for Block, Inc. show a predominantly positive outlook with multiple “Buy” and “Outperform” ratings, though Piper Sandler holds an “Underweight” rating.
VeriSign, Inc. Grades
Below is a summary of recent grades from reputable grading companies for VeriSign, Inc.:
| Grading Company | Action | New Grade | Date |
|---|---|---|---|
| JP Morgan | Maintain | Neutral | 2026-01-06 |
| Baird | Maintain | Outperform | 2025-07-01 |
| Baird | Maintain | Outperform | 2025-04-25 |
| Baird | Maintain | Outperform | 2025-04-01 |
| Citigroup | Maintain | Buy | 2025-02-04 |
| Citigroup | Maintain | Buy | 2025-01-03 |
| Baird | Upgrade | Outperform | 2024-12-09 |
| Baird | Maintain | Neutral | 2024-06-27 |
| Baird | Maintain | Neutral | 2024-04-26 |
| Citigroup | Maintain | Buy | 2024-04-02 |
VeriSign, Inc. displays a generally stable rating trend with a mixture of “Buy,” “Outperform,” and “Neutral” grades, reflecting moderate optimism.
Which company has the best grades?
Both Block, Inc. and VeriSign, Inc. have consensus ratings of “Buy,” but Block, Inc. shows a higher frequency of “Buy” and “Outperform” grades from multiple firms. This pattern could suggest stronger analyst conviction for Block, Inc., which may influence investor perception of its growth potential and risk profile.
Strengths and Weaknesses
Below is a comparison table highlighting the key strengths and weaknesses of Block, Inc. (XYZ) and VeriSign, Inc. (VRSN) based on their latest financial and strategic data.
| Criterion | Block, Inc. (XYZ) | VeriSign, Inc. (VRSN) |
|---|---|---|
| Diversification | Strong revenue diversification with Software & Data Products ($7.16B), Cryptocurrency Assets ($10.2B), Transactions ($6.6B), and Hardware ($143M). | Focused product portfolio, mainly domain name services, limiting diversification. |
| Profitability | Net margin at 12.01% (favorable), ROE 13.62% (neutral), ROIC 3.03% (unfavorable), overall slightly favorable ratios. | Very high net margin 50.45% and ROIC 451% (favorable), but ROE negative at -40.13%, mixed profitability signals. |
| Innovation | Moderate innovation indicated by growing ROIC trend (+13.7%), but currently shedding value (ROIC < WACC). | Demonstrates durable competitive advantage with very favorable moat and growing ROIC (+325.8%). |
| Global presence | Global operations with diversified financial services and cryptocurrency exposure. | Primarily serves domain name infrastructure globally but with a narrower business scope. |
| Market Share | Strong in fintech and crypto transaction markets with growing user base. | Dominant in domain name registry market, commanding a durable competitive advantage. |
Key takeaways: VeriSign shows a very favorable competitive position with exceptional profitability and a strong economic moat, despite some liquidity concerns. Block, Inc. has diversified revenue streams and improving profitability trends but currently destroys value due to high capital costs. Investors should weigh growth potential against current inefficiencies in capital use.
Risk Analysis
Below is a comparison of key risks for Block, Inc. and VeriSign, Inc. based on the most recent data from 2024.
| Metric | Block, Inc. (XYZ) | VeriSign, Inc. (VRSN) |
|---|---|---|
| Market Risk | High beta 2.67, volatile price range | Low beta 0.77, stable price range |
| Debt level | Low debt-to-equity 0.37, favorable | High debt-to-assets 128%, unfavorable |
| Regulatory Risk | Moderate, fintech regulations evolving | Moderate, internet infrastructure compliance |
| Operational Risk | Moderate, hardware/software integration | Low, stable domain registry operations |
| Environmental Risk | Low, limited physical footprint | Low, primarily digital services |
| Geopolitical Risk | Moderate, international presence in 7 countries | Moderate, US-based but global internet impact |
The most impactful risks come from Block’s high market volatility and evolving fintech regulations, while VeriSign faces significant debt and liquidity challenges despite strong core operations. Investors should weigh Block’s growth potential against its financial leverage and VeriSign’s stability concerns.
Which Stock to Choose?
Block, Inc. (XYZ) shows a favorable income evolution with strong revenue and net margin growth. Financial ratios reveal a balanced profile with mostly favorable debt and liquidity metrics, moderate profitability, and a slightly unfavorable MOAT due to ROIC below WACC. The company holds a very favorable B+ rating overall.
VeriSign, Inc. (VRSN) displays high profitability and a very favorable MOAT with ROIC far exceeding WACC. Its income growth is moderate with some unfavorable net margin trends. Financial ratios are mixed, with strong asset turnover but weaker liquidity and debt indicators. The firm carries a very favorable B- rating despite some ratio concerns.
For investors, VRSN’s strong value creation and profitability might appeal to those seeking quality growth, whereas XYZ’s balanced ratios and improving profitability could be attractive for moderate risk profiles prioritizing stability. The final assessment might depend on individual investor risk tolerance and strategic focus.
Disclaimer: Investment carries a risk of loss of initial capital. The past performance is not a reliable indicator of future results. Be sure to understand risks before making an investment decision.
Go Further
I encourage you to read the complete analyses of Block, Inc. and VeriSign, Inc. to enhance your investment decisions: