In the fast-evolving technology sector, Block, Inc. and UiPath Inc. stand out as innovators shaping the future of software infrastructure. Block focuses on payment solutions and commerce tools, while UiPath leads in robotic process automation, both targeting efficiency and digital transformation across industries. This article will analyze their market positions and growth strategies to help you decide which company holds more promise for your investment portfolio.
Table of contents
Companies Overview
I will begin the comparison between Block, Inc. and UiPath Inc. by providing an overview of these two companies and their main differences.
Block, Inc. Overview
Block, Inc. develops tools that enable sellers to accept card payments, offering hardware such as Magstripe and chip readers, and software including Square Point of Sale and Cash App. The company serves multiple countries and integrates payment processing with analytics and next-day settlement. Founded in 2009 and based in Oakland, California, Block operates primarily in the software infrastructure industry with a market cap of 40B USD.
UiPath Inc. Overview
UiPath Inc. provides an end-to-end robotic process automation platform, combining AI and low-code development environments to automate business processes. The company serves sectors including banking and healthcare mainly in the US, Romania, and Japan. Founded in 2005 and headquartered in New York City, UiPath operates in software infrastructure with a market cap of approximately 7.7B USD and offers professional services such as training and implementation.
Key similarities and differences
Both companies operate in the software infrastructure sector and focus on enterprise technology solutions. Block emphasizes payment processing hardware and software tools for sellers, while UiPath focuses on automation software using AI and robotics. Block’s business spans multiple countries with a larger employee base, whereas UiPath specializes in process automation primarily across fewer regions and industries, reflecting distinct approaches within the technology landscape.
Income Statement Comparison
The table below compares key income statement metrics for Block, Inc. and UiPath Inc. based on their most recent fiscal year results.
| Metric | Block, Inc. (XYZ) | UiPath Inc. (PATH) |
|---|---|---|
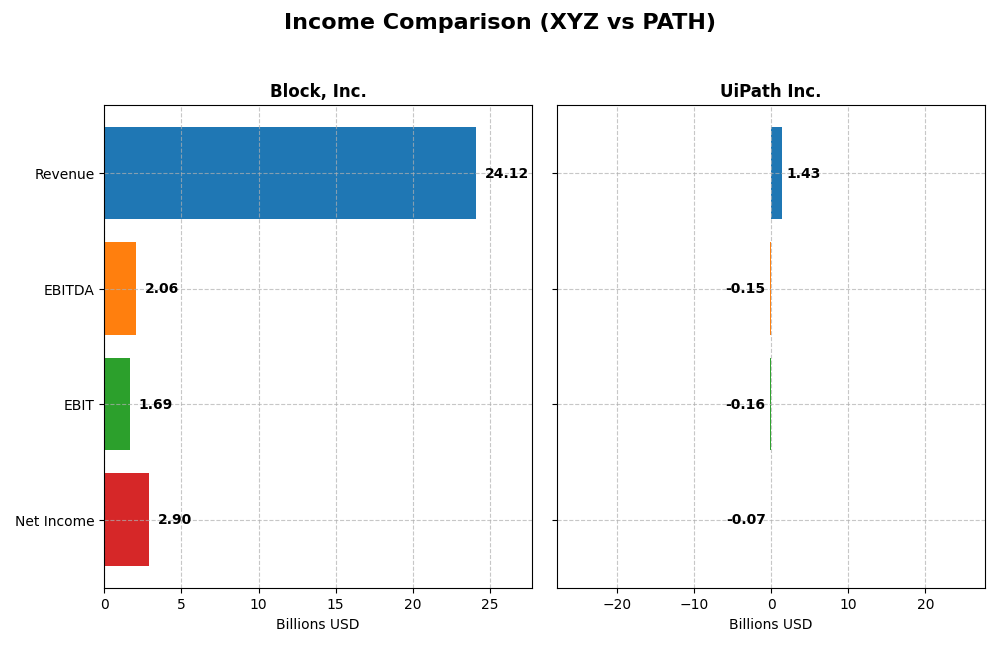
| Market Cap | 40B | 7.7B |
| Revenue | 24.1B | 1.43B |
| EBITDA | 2.06B | -145M |
| EBIT | 1.69B | -163M |
| Net Income | 2.9B | -74M |
| EPS | 4.7 | -0.13 |
| Fiscal Year | 2024 | 2025 |
Income Statement Interpretations
Block, Inc.
Block, Inc. demonstrated strong revenue growth from 2020 to 2024, increasing from 9.5B to 24.1B, with net income improving dramatically from 213M to 2.9B. Gross margin remained favorable at 36.85%, while net margin reached 12.01%, indicating improved profitability. The latest year saw solid revenue growth of 10.06%, gross profit up 21.26%, and a remarkable net margin expansion, reflecting robust operational performance.
UiPath Inc.
UiPath’s revenue rose steadily over 2021–2025, from 608M to 1.43B, supported by favorable gross margins of 82.73%. However, net income remained negative, though improving, with net losses narrowing from -92M to -74M. EBIT margins were unfavorable at -11.37%. The most recent year showed 9.3% revenue growth and a 24.98% improvement in net margin, signaling progress despite ongoing operating losses.
Which one has the stronger fundamentals?
Block, Inc. exhibits stronger fundamentals based on consistent positive net income growth, healthy gross and net margins, and substantial profitability improvements. UiPath, while growing revenue and gross profit, continues to report net losses and negative EBIT margins, reflecting challenges in achieving profitability. Overall, Block’s income statement reflects more favorable financial health and operational efficiency.
Financial Ratios Comparison
The table below provides a side-by-side comparison of key financial ratios for Block, Inc. (XYZ) and UiPath Inc. (PATH) based on their most recent fiscal year data.
| Ratios | Block, Inc. (XYZ) 2024 | UiPath Inc. (PATH) 2025 |
|---|---|---|
| ROE | 13.62% | -3.99% |
| ROIC | 3.03% | -7.41% |
| P/E | 18.1 | -108.0 |
| P/B | 2.47 | 4.31 |
| Current Ratio | 2.33 | 2.93 |
| Quick Ratio | 2.31 | 2.93 |
| D/E (Debt to Equity) | 0.37 | 0.04 |
| Debt-to-Assets | 21.5% | 2.72% |
| Interest Coverage | 95.9 | 0 |
| Asset Turnover | 0.66 | 0.50 |
| Fixed Asset Turnover | 45.14 | 14.41 |
| Payout Ratio | 0 | 0 |
| Dividend Yield | 0 | 0 |
Interpretation of the Ratios
Block, Inc.
Block, Inc. displays a mix of strengths and concerns in its financial ratios. The company has favorable liquidity ratios with a current ratio of 2.33 and a quick ratio of 2.31, alongside a strong interest coverage of 181.31. However, its return on invested capital (3.03%) and weighted average cost of capital (14.27%) are unfavorable, suggesting potential challenges in value creation. Block does not pay dividends, indicating a focus on reinvestment or growth strategies rather than shareholder distributions.
UiPath Inc.
UiPath’s ratios reveal several weaknesses, including negative net margin (-5.15%), return on equity (-3.99%), and return on invested capital (-7.41%), pointing to profitability struggles. While liquidity is solid with a current ratio of 2.93 and debt levels low at 0.04, the zero interest coverage ratio raises caution. UiPath also does not pay dividends, likely reflecting reinvestment in development and growth initiatives amid ongoing losses.
Which one has the best ratios?
Comparing the two, Block, Inc. shows a more balanced financial profile with half of its ratios favorable and a slightly favorable global opinion. UiPath faces more unfavorable metrics, particularly in profitability and coverage ratios, resulting in a slightly unfavorable overall assessment. Thus, Block, Inc. presents stronger financial ratios relative to UiPath based on the provided data.
Strategic Positioning
This section compares the strategic positioning of Block, Inc. and UiPath Inc., focusing on market position, key segments, and exposure to technological disruption:
Block, Inc.
- Large market cap of 40B; operates in competitive payment technology sector with diverse offerings.
- Diverse revenue streams: software, cryptocurrency assets, hardware, and transactions drive growth.
- Faces disruption from evolving payment technologies and crypto market volatility.
UiPath Inc.
- Smaller 7.7B market cap; competes in automation software with specialized robotic process automation.
- Revenue mainly from licenses, subscriptions, and professional services in automation software.
- Exposed to AI and automation tech advances with strong integration of low-code and AI tools.
Block, Inc. vs UiPath Inc. Positioning
Block has a diversified business model across payments, software, and cryptocurrency, offering multiple revenue sources but with exposure to volatile crypto assets. UiPath focuses on automation software with a concentrated product suite, relying on enterprise adoption of RPA and AI.
Which has the best competitive advantage?
Both companies show slightly unfavorable MOAT status, shedding value but with improving profitability trends. Neither currently demonstrates a strong sustainable competitive advantage based on ROIC versus WACC analysis.
Stock Comparison
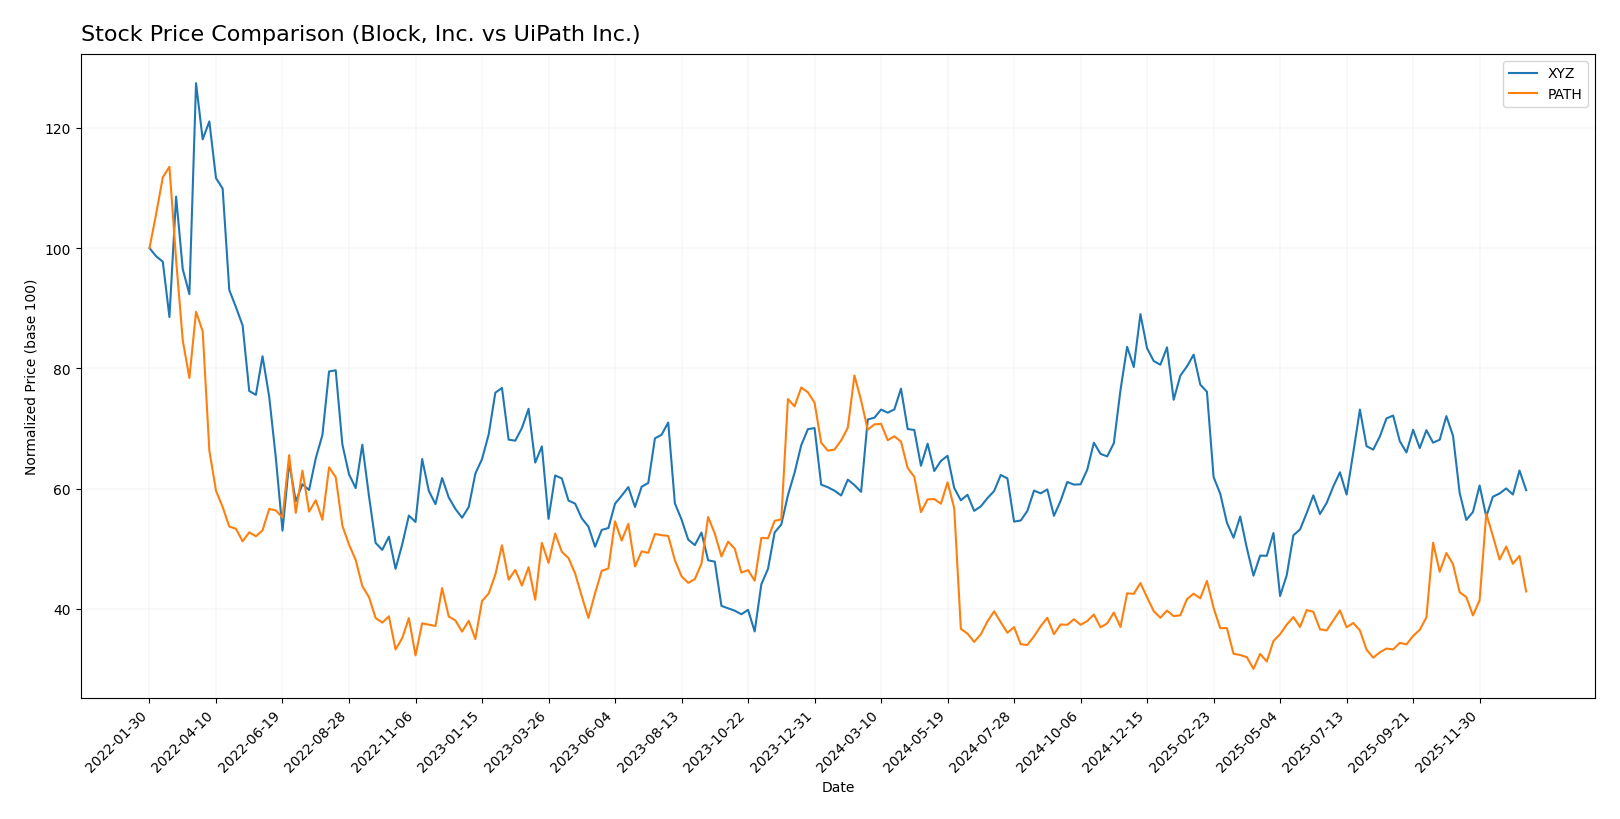
The stock prices of Block, Inc. and UiPath Inc. have shown significant declines over the past 12 months, with both experiencing bearish trends marked by notable price drops and varying volume dynamics.
Trend Analysis
Block, Inc. (XYZ) recorded a 16.43% price decrease over the past year, indicating a bearish trend with deceleration. The stock fluctuated between 46.53 and 98.25, showing high volatility with a 10.43 standard deviation.
UiPath Inc. (PATH) showed a steeper 38.53% price decline during the same period, also bearish but with accelerating downward momentum. The price ranged from 10.04 to 23.66, with lower volatility at a 3.33 standard deviation.
Comparing both, Block, Inc. outperformed UiPath Inc. with a smaller percentage drop, delivering a relatively better market performance over the past 12 months.
Target Prices
The current analyst consensus for target prices indicates moderate upside potential for both Block, Inc. and UiPath Inc.
| Company | Target High | Target Low | Consensus |
|---|---|---|---|
| Block, Inc. | 100 | 65 | 84.91 |
| UiPath Inc. | 19 | 14 | 16.6 |
Analysts expect Block, Inc.’s stock to rise significantly above its current price of 65.95 USD, while UiPath Inc.’s target consensus at 16.6 USD suggests a moderate increase from its current price of 14.34 USD.
Analyst Opinions Comparison
This section compares analysts’ ratings and grades for Block, Inc. and UiPath Inc.:
Rating Comparison
Block, Inc. Rating
- Rating: B+, classified as Very Favorable.
- Discounted Cash Flow Score: 3, Moderate.
- ROE Score: 4, Favorable efficiency in profit generation.
- ROA Score: 4, Favorable asset utilization.
- Debt To Equity Score: 2, Moderate financial risk.
- Overall Score: 3, Moderate overall standing.
UiPath Inc. Rating
- Rating: B+, classified as Very Favorable.
- Discounted Cash Flow Score: 3, Moderate.
- ROE Score: 4, Favorable efficiency in profit generation.
- ROA Score: 4, Favorable asset utilization.
- Debt To Equity Score: 4, Favorable lower financial risk.
- Overall Score: 3, Moderate overall standing.
Which one is the best rated?
Both companies have the same overall rating (B+) and identical scores for discounted cash flow, ROE, ROA, and overall score. However, UiPath Inc. has a stronger debt-to-equity score, indicating lower financial risk compared to Block, Inc.
Scores Comparison
Here is a comparison of the financial health scores for Block, Inc. and UiPath Inc.:
Block, Inc. Scores
- Altman Z-Score: 2.70, indicating a moderate risk in the grey zone.
- Piotroski Score: 6, reflecting average financial strength.
UiPath Inc. Scores
- Altman Z-Score: 5.27, indicating strong financial stability in the safe zone.
- Piotroski Score: 7, reflecting strong financial health.
Which company has the best scores?
UiPath Inc. has the best scores with a higher Altman Z-Score placing it in the safe zone, and a stronger Piotroski Score compared to Block, Inc., indicating better financial stability and strength.
Grades Comparison
Here is the comparison of recent grades from established grading companies for Block, Inc. and UiPath Inc.:
Block, Inc. Grades
The table below summarizes the latest grades from recognized financial institutions for Block, Inc.:
| Grading Company | Action | New Grade | Date |
|---|---|---|---|
| Piper Sandler | Maintain | Underweight | 2026-01-14 |
| Keefe, Bruyette & Woods | Maintain | Outperform | 2026-01-02 |
| Needham | Maintain | Buy | 2025-11-24 |
| B of A Securities | Maintain | Buy | 2025-11-21 |
| Morgan Stanley | Maintain | Equal Weight | 2025-11-21 |
| BTIG | Maintain | Buy | 2025-11-20 |
| RBC Capital | Maintain | Outperform | 2025-11-20 |
| Stephens & Co. | Maintain | Overweight | 2025-11-20 |
| Mizuho | Maintain | Outperform | 2025-11-20 |
| BTIG | Maintain | Buy | 2025-11-14 |
Overall, Block, Inc. shows a positive trend with multiple “Buy” and “Outperform” ratings, alongside some “Equal Weight” and one “Underweight” rating, indicating mixed but generally favorable analyst sentiment.
UiPath Inc. Grades
The table below summarizes the latest grades from recognized financial institutions for UiPath Inc.:
| Grading Company | Action | New Grade | Date |
|---|---|---|---|
| Barclays | Maintain | Equal Weight | 2026-01-12 |
| RBC Capital | Maintain | Sector Perform | 2026-01-05 |
| RBC Capital | Maintain | Sector Perform | 2025-12-10 |
| Morgan Stanley | Maintain | Equal Weight | 2025-12-09 |
| DA Davidson | Maintain | Neutral | 2025-12-05 |
| Canaccord Genuity | Maintain | Buy | 2025-12-04 |
| Mizuho | Maintain | Neutral | 2025-12-04 |
| RBC Capital | Maintain | Sector Perform | 2025-12-04 |
| Wells Fargo | Maintain | Equal Weight | 2025-12-04 |
| Evercore ISI Group | Maintain | In Line | 2025-12-04 |
UiPath Inc.’s grades are mostly “Equal Weight,” “Sector Perform,” and “Neutral,” with one “Buy” rating, reflecting a cautious or balanced market outlook.
Which company has the best grades?
Block, Inc. has received stronger and more positive grades overall compared to UiPath Inc., with more “Buy” and “Outperform” ratings. This could imply a higher analyst confidence level, potentially influencing investors seeking growth-oriented opportunities. Conversely, UiPath’s more moderate grades suggest a more conservative stance.
Strengths and Weaknesses
The table below compares Block, Inc. (XYZ) and UiPath Inc. (PATH) across key investment criteria based on the most recent financial and operational data.
| Criterion | Block, Inc. (XYZ) | UiPath Inc. (PATH) |
|---|---|---|
| Diversification | High: Revenue from software, crypto assets, hardware, and transactions totaling over $24B in 2024. | Moderate: Primarily software licenses and subscription services, about $1.46B total in 2025. |
| Profitability | Mixed: Net margin favorable at 12%, ROIC unfavorable at 3%, WACC high at 14.3%. | Weak: Negative net margin (-5.15%), ROIC unfavorable at -7.4%, WACC neutral at 8.9%. |
| Innovation | Strong in crypto and fintech solutions, growing ROIC trend despite value shedding. | High innovation in automation software, with strong ROIC growth but currently value-destroying. |
| Global presence | Extensive, given crypto and payments infrastructure across multiple markets. | Growing presence globally but smaller scale than Block, Inc. |
| Market Share | Large in payment processing and crypto markets. | Niche leader in robotic process automation but smaller market share. |
Key takeaways: Block, Inc. shows strong diversification and solid profitability metrics with some financial risks due to high WACC. UiPath is innovating rapidly with expanding revenue but faces profitability challenges and value destruction, indicating higher risk for investors.
Risk Analysis
Below is a comparative risk assessment table for Block, Inc. (XYZ) and UiPath Inc. (PATH) based on the most recent available data.
| Metric | Block, Inc. (XYZ) | UiPath Inc. (PATH) |
|---|---|---|
| Market Risk | High beta of 2.665, indicating higher volatility | Moderate beta of 1.079, indicating moderate volatility |
| Debt Level | Low debt-to-equity ratio of 0.37, favorable leverage | Very low debt-to-equity ratio of 0.04, very conservative leverage |
| Regulatory Risk | Moderate, due to fintech and payments industry regulations across multiple countries | Moderate, as software and automation sectors face evolving compliance requirements |
| Operational Risk | Medium, with diversified payment hardware and software products; reliance on innovation | Medium, reliant on continual software development and client adoption |
| Environmental Risk | Low, primarily a software and payments company with limited direct environmental impact | Low, predominantly software with limited environmental footprint |
| Geopolitical Risk | Moderate, with operations in US, Canada, Japan, Australia, Europe; exposed to trade tensions | Moderate, with major markets in US, Romania, Japan; some exposure to geopolitical shifts |
The most likely and impactful risks for Block, Inc. revolve around its high market volatility and exposure to fintech regulatory changes amid global expansion. For UiPath, the critical risks lie in operational execution and sustaining growth in a competitive RPA software market, combined with moderate geopolitical exposure. Both companies maintain low debt levels, which mitigates financial distress risk.
Which Stock to Choose?
Block, Inc. (XYZ) shows a favorable income evolution with strong revenue and net income growth over 2020-2024. Its financial ratios are slightly favorable, highlighted by a solid net margin of 12.01% and good liquidity. Profitability is moderate with a 13.6% ROE, supported by low debt and a very favorable credit profile. The overall rating is very favorable, reflecting sound financial health despite a slightly unfavorable ROIC versus WACC.
UiPath Inc. (PATH) presents a favorable income trajectory with steady revenue growth but still posts negative net margins and returns. Its financial ratios are slightly unfavorable, weighed down by negative profitability metrics and a weaker asset turnover. PATH maintains low debt levels and strong liquidity. The rating is also very favorable, but the company is currently shedding value as ROIC remains below WACC despite improving trends.
For investors, Block, Inc. could appear more suitable for those prioritizing stable profitability and balanced financial metrics, while UiPath Inc. might be more aligned with risk-tolerant investors focusing on growth potential amid ongoing value rebuilding. Both companies share a very favorable rating but differ in income quality and capital efficiency, suggesting choice depends on individual risk appetite and investment strategy.
Disclaimer: Investment carries a risk of loss of initial capital. The past performance is not a reliable indicator of future results. Be sure to understand risks before making an investment decision.
Go Further
I encourage you to read the complete analyses of Block, Inc. and UiPath Inc. to enhance your investment decisions: