In the fast-evolving technology sector, Block, Inc. and Teradata Corporation stand out as key players in software infrastructure. Both companies focus on data-driven solutions—Block through innovative payment and retail technologies, and Teradata with advanced multi-cloud analytics platforms. Their market overlap and distinct innovation strategies make them worthy of comparison. This article will help you decide which company offers the most compelling investment opportunity in 2026.
Table of contents
Companies Overview
I will begin the comparison between Block, Inc. and Teradata Corporation by providing an overview of these two companies and their main differences.
Block, Inc. Overview
Block, Inc. operates in the software infrastructure industry, focusing on payment solutions that enable sellers to accept card payments and manage transactions efficiently. The company offers a range of hardware products such as card readers and point-of-sale terminals, alongside software services including payment processing, analytics, and business management tools. Block serves multiple countries, including the US, Canada, Japan, and several European nations, positioning itself as a key player in the digital payment ecosystem.
Teradata Corporation Overview
Teradata Corporation specializes in connected multi-cloud data platforms designed for enterprise analytics. Its flagship product, Teradata Vantage, integrates data from various sources to simplify ecosystems and support cloud migration. The company also provides consulting, support, and maintenance services aimed at optimizing customers’ data and analytic infrastructures. Teradata serves diverse sectors globally, including financial services, healthcare, retail, and telecommunications, underlining its role as a comprehensive analytics solutions provider.
Key similarities and differences
Both Block and Teradata operate within the technology sector and focus on software infrastructure, yet their core businesses differ significantly. Block centers on payment processing and related hardware/software solutions for merchants, while Teradata provides data platform services and enterprise analytics consulting. Block’s market cap is substantially larger at about 40B compared to Teradata’s 2.8B. Additionally, Block is more consumer-facing, whereas Teradata targets enterprise clients with its multi-cloud analytics offerings.
Income Statement Comparison
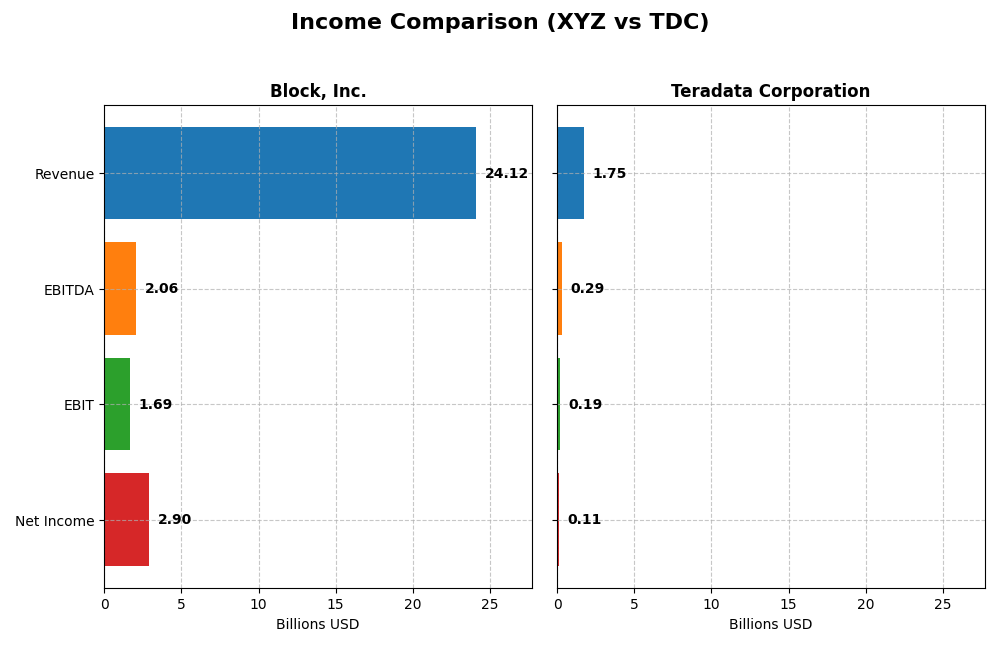
The table below presents a side-by-side comparison of key income statement metrics for Block, Inc. and Teradata Corporation for the fiscal year 2024.
| Metric | Block, Inc. | Teradata Corporation |
|---|---|---|
| Market Cap | 40.2B | 2.8B |
| Revenue | 24.1B | 1.75B |
| EBITDA | 2.06B | 293M |
| EBIT | 1.69B | 193M |
| Net Income | 2.90B | 114M |
| EPS | 4.7 | 1.18 |
| Fiscal Year | 2024 | 2024 |
Income Statement Interpretations
Block, Inc.
Block, Inc. exhibited strong revenue growth, increasing from $9.5B in 2020 to $24.1B in 2024, with net income turning sharply positive to $2.9B in 2024 from a loss of $541M in 2022. Margins improved significantly, with gross margin at 36.85% and net margin rising to 12.01%. The 2024 year showed robust earnings growth, driven by a 10% revenue increase and a 21% gross profit expansion.
Teradata Corporation
Teradata’s revenue declined slightly from $1.8B in 2020 to $1.75B in 2024, while net income fluctuated, peaking at $147M in 2021 before settling at $114M in 2024. Margins remained stable and favorable, with a gross margin of 60.46% and net margin of 6.51%. The 2024 results showed a revenue decrease of 4.5%, but net margin and earnings per share improved considerably, reflecting operational efficiency.
Which one has the stronger fundamentals?
Block, Inc. demonstrates stronger fundamentals with substantial revenue and net income growth over five years, alongside improving margins and earnings metrics. Teradata shows stable profitability but faces declining revenue and net income over the same period. While both companies have favorable income statement evaluations, Block’s significant growth and margin expansion suggest a more favorable financial trajectory.
Financial Ratios Comparison
This table compares key financial ratios for Block, Inc. (XYZ) and Teradata Corporation (TDC) based on their most recent fiscal year data for 2024.
| Ratios | Block, Inc. (XYZ) | Teradata Corporation (TDC) |
|---|---|---|
| ROE | 13.62% | 85.71% |
| ROIC | 3.03% | 16.89% |
| P/E | 18.10 | 26.34 |
| P/B | 2.47 | 22.58 |
| Current Ratio | 2.33 | 0.81 |
| Quick Ratio | 2.31 | 0.79 |
| D/E (Debt-to-Equity) | 0.37 | 4.33 |
| Debt-to-Assets | 21.53% | 33.80% |
| Interest Coverage | 95.93 | 7.21 |
| Asset Turnover | 0.66 | 1.03 |
| Fixed Asset Turnover | 45.14 | 9.07 |
| Payout Ratio | 0 | 0 |
| Dividend Yield | 0 | 0 |
Interpretation of the Ratios
Block, Inc.
Block, Inc. shows a balanced financial profile with 50% of its ratios favorable, including a strong current ratio of 2.33 and excellent interest coverage at 181.31. However, the company faces challenges with an unfavorable return on invested capital (3.03%) and a high weighted average cost of capital (14.27%). It does not pay dividends, likely focusing on reinvestment and growth.
Teradata Corporation
Teradata presents mixed results with strong profitability ratios like an 85.71% ROE and favorable returns on invested capital (16.89%) and capital employed. Yet, liquidity ratios are weak, with a current ratio of 0.81 and a high debt-to-equity ratio of 4.33. Teradata also does not distribute dividends, possibly prioritizing R&D and acquisitions.
Which one has the best ratios?
Block, Inc. offers a slightly favorable overall ratio profile with better liquidity and lower leverage, while Teradata shows strong profitability but weaker liquidity and higher financial risk. Block’s mix of strengths and fewer unfavorable ratios contrasts with Teradata’s polarized ratings, leading to a more balanced ratio evaluation for Block, Inc.
Strategic Positioning
This section compares the strategic positioning of Block, Inc. and Teradata Corporation, including their market position, key segments, and exposure to technological disruption:
Block, Inc.
- Large market cap at 40B, faces high beta volatility at 2.665, competitive in software infrastructure.
- Diverse revenue streams: cryptocurrency, software products, hardware, and transactions drive growth.
- Exposure to fast-evolving fintech and payment technologies; innovation critical to maintain position.
Teradata Corporation
- Smaller market cap at 2.8B, low beta at 0.57, operates in software infrastructure with steady competition.
- Focused on multi-cloud data platforms, consulting, and recurring software services across industries.
- Faces disruption risk from cloud migration and evolving analytics; strong consulting supports transition.
Block, Inc. vs Teradata Corporation Positioning
Block, Inc. adopts a diversified approach spanning payments, software, hardware, and cryptocurrency, offering multiple growth drivers but higher market volatility. Teradata concentrates on enterprise analytics and consulting with recurring revenues, providing stability yet narrower focus.
Which has the best competitive advantage?
Teradata demonstrates a very favorable moat with ROIC well above WACC and strong profitability growth, indicating a durable competitive advantage. Block, Inc. shows slightly unfavorable moat status, shedding value despite improving ROIC trends.
Stock Comparison
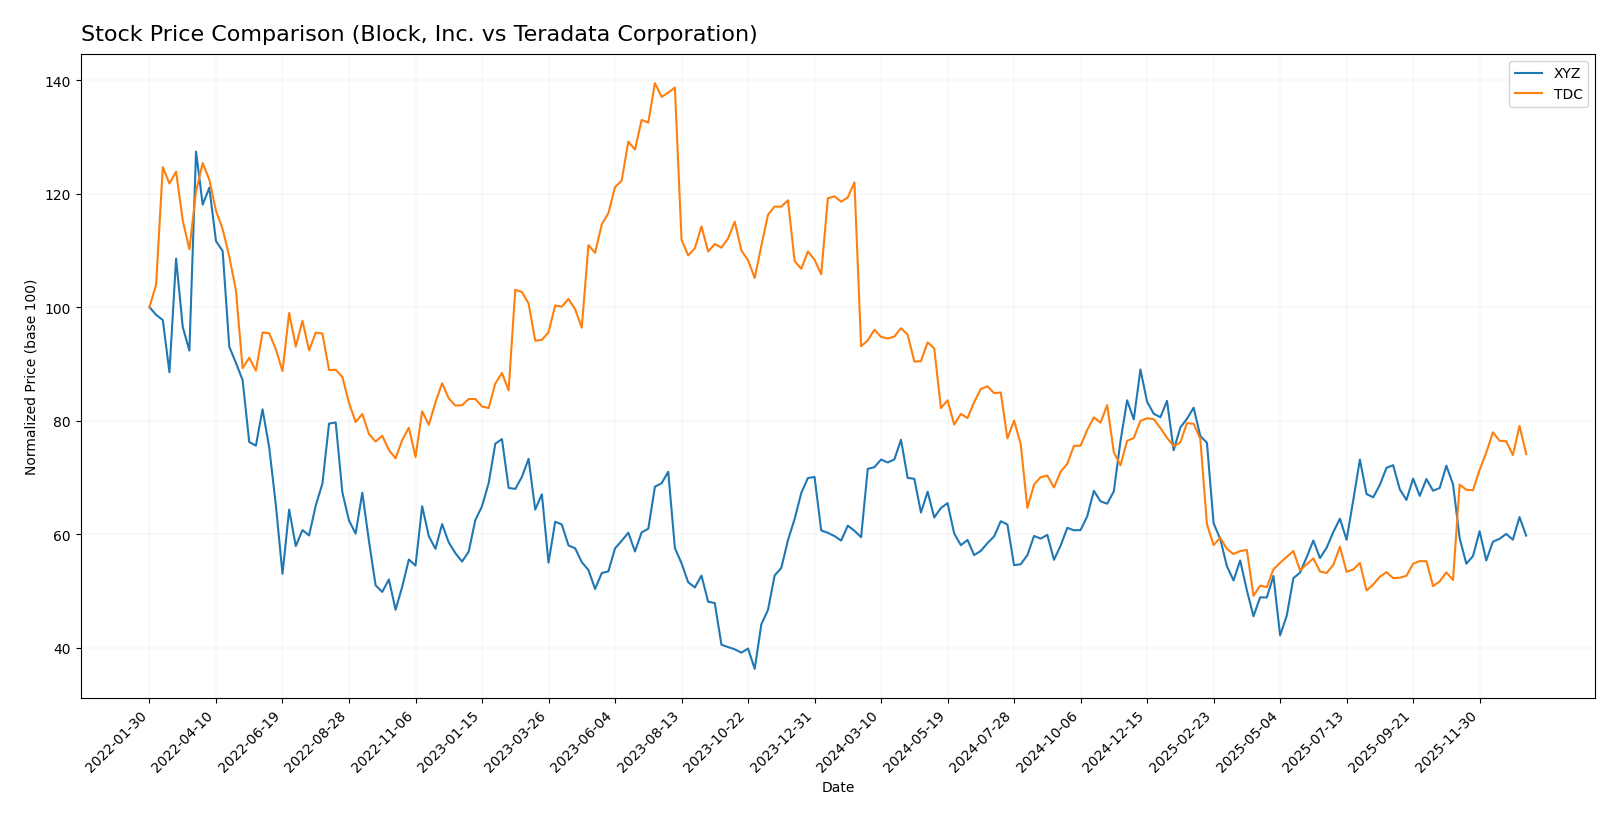
The stock prices of Block, Inc. and Teradata Corporation have exhibited significant fluctuations over the past 12 months, with both experiencing overall bearish trends yet contrasting recent momentum and volume dynamics.
Trend Analysis
Block, Inc. (XYZ) showed a bearish trend with a -16.43% price change over the past year and decelerating downward momentum, reaching a high of 98.25 and a low of 46.53, with notable volatility at 10.43 std deviation.
Teradata Corporation (TDC) experienced a stronger bearish trend over the year, declining -21.26%, but with accelerating downward pressure. It fluctuated between 38.67 and 19.73, with lower volatility at 5.63 std deviation.
Comparing recent performance, Teradata reversed course with a 42.78% gain since November 2025, outperforming Block, which continued to decline by -13.16%. Teradata delivered the highest market performance in this period.
Target Prices
The consensus target prices from verified analysts indicate potential upside for both Block, Inc. and Teradata Corporation.
| Company | Target High | Target Low | Consensus |
|---|---|---|---|
| Block, Inc. | 100 | 65 | 84.91 |
| Teradata Corporation | 35 | 27 | 31 |
Analysts expect Block, Inc.’s stock to rise from its current price of $65.95 toward a consensus target of $84.91, suggesting moderate growth potential. Teradata Corporation’s consensus target of $31 also indicates a slight upside from the current price of $29.77.
Analyst Opinions Comparison
This section compares analysts’ ratings and grades for Block, Inc. and Teradata Corporation:
Rating Comparison
Block, Inc. Rating
- Rating: B+, assessed as Very Favorable by analysts.
- Discounted Cash Flow Score: Moderate with a score of 3.
- ROE Score: Favorable at 4, indicating efficient profit generation.
- ROA Score: Favorable with a score of 4, effective asset utilization.
- Debt To Equity Score: Moderate risk at 2.
- Overall Score: Moderate with a score of 3.
Teradata Corporation Rating
- Rating: B+, assessed as Very Favorable by analysts.
- Discounted Cash Flow Score: Favorable with a score of 4.
- ROE Score: Very Favorable at 5, showing strong shareholder returns.
- ROA Score: Favorable at 4, indicating good asset efficiency.
- Debt To Equity Score: Very Unfavorable at 1, indicating higher risk.
- Overall Score: Moderate, matching Block’s score of 3.
Which one is the best rated?
Both companies share the same overall rating of B+ and an identical overall score of 3, indicating similar moderate standing. However, Teradata shows stronger profitability metrics (higher ROE) but carries greater financial risk with a weaker debt-to-equity score compared to Block.
Scores Comparison
Here is a comparison of the financial scores for Block, Inc. and Teradata Corporation:
Block, Inc. Scores
- Altman Z-Score: 2.70, in the grey zone, indicating moderate bankruptcy risk.
- Piotroski Score: 6, classified as average financial strength.
Teradata Corporation Scores
- Altman Z-Score: 0.81, in the distress zone, indicating high bankruptcy risk.
- Piotroski Score: 8, classified as very strong financial strength.
Which company has the best scores?
Teradata shows a stronger Piotroski Score, indicating better financial strength, but a weaker Altman Z-Score, suggesting higher bankruptcy risk. Block, Inc. has a moderate Altman Z-Score but a lower Piotroski Score.
Grades Comparison
Here is a comparison of recent grades assigned to Block, Inc. and Teradata Corporation by reputable grading firms:
Block, Inc. Grades
The following table summarizes recent analyst grades for Block, Inc.:
| Grading Company | Action | New Grade | Date |
|---|---|---|---|
| Piper Sandler | Maintain | Underweight | 2026-01-14 |
| Keefe, Bruyette & Woods | Maintain | Outperform | 2026-01-02 |
| Needham | Maintain | Buy | 2025-11-24 |
| B of A Securities | Maintain | Buy | 2025-11-21 |
| Morgan Stanley | Maintain | Equal Weight | 2025-11-21 |
| BTIG | Maintain | Buy | 2025-11-20 |
| RBC Capital | Maintain | Outperform | 2025-11-20 |
| Stephens & Co. | Maintain | Overweight | 2025-11-20 |
| Mizuho | Maintain | Outperform | 2025-11-20 |
| BTIG | Maintain | Buy | 2025-11-14 |
Overall, Block, Inc. has received predominantly Buy and Outperform ratings, with some mixed views such as Underweight and Equal Weight.
Teradata Corporation Grades
Below is a summary of recent analyst grades for Teradata Corporation:
| Grading Company | Action | New Grade | Date |
|---|---|---|---|
| Barclays | Maintain | Underweight | 2026-01-12 |
| RBC Capital | Maintain | Sector Perform | 2026-01-05 |
| Morgan Stanley | Maintain | Overweight | 2025-12-17 |
| Citizens | Upgrade | Market Outperform | 2025-11-10 |
| Barclays | Maintain | Underweight | 2025-11-05 |
| TD Cowen | Maintain | Hold | 2025-11-05 |
| Evercore ISI Group | Maintain | Outperform | 2025-11-05 |
| UBS | Maintain | Neutral | 2025-08-06 |
| Guggenheim | Maintain | Buy | 2025-05-07 |
| Barclays | Maintain | Underweight | 2025-04-21 |
Teradata’s grades show a wider range with several Underweight and Hold ratings but also some Outperform and Buy opinions.
Which company has the best grades?
Block, Inc. has received a stronger consensus with a majority of Buy and Outperform ratings compared to Teradata’s mixed Hold and Underweight grades. This suggests Block, Inc. is viewed more favorably by analysts, potentially influencing investor confidence and portfolio decisions.
Strengths and Weaknesses
Below is a comparative overview of strengths and weaknesses for Block, Inc. (XYZ) and Teradata Corporation (TDC) based on the most recent data available.
| Criterion | Block, Inc. (XYZ) | Teradata Corporation (TDC) |
|---|---|---|
| Diversification | High diversification with segments in software, cryptocurrency assets, hardware, and transactions | Moderate diversification focused on consulting, recurring products/services, and subscription software |
| Profitability | Net margin 12.0% (favorable), ROIC 3.03% (unfavorable), currently shedding value but improving ROIC | Net margin 6.5% (neutral), ROIC 16.9% (favorable), creating value with strong profitability growth |
| Innovation | Significant in cryptocurrency and software products, driving revenue growth | Innovation focused on data analytics and recurring software licenses, steady but less aggressive |
| Global presence | Strong presence in digital payments and crypto markets globally | Global reach with data analytics and consulting services, more niche market presence |
| Market Share | Large market share in fintech and crypto transactions | Leading in data analytics and consulting within its sector |
Key takeaways: Block, Inc. shows strong diversification and improving profitability despite currently shedding value, driven by innovation in fintech and crypto. Teradata demonstrates a durable competitive advantage with high ROIC and steady profitability but faces challenges in liquidity and higher valuation multiples. Investors should weigh Block’s growth potential against Teradata’s stable value creation.
Risk Analysis
Below is a comparative table of key risks for Block, Inc. (XYZ) and Teradata Corporation (TDC) based on the most recent data from 2024.
| Metric | Block, Inc. (XYZ) | Teradata Corporation (TDC) |
|---|---|---|
| Market Risk | High beta (2.67) indicates significant price volatility | Low beta (0.57) suggests lower volatility |
| Debt level | Low debt-to-equity (0.37), favorable leverage | High debt-to-equity (4.33), unfavorable leverage |
| Regulatory Risk | Moderate, due to fintech and payment regulations | Moderate, cloud and data privacy regulations apply |
| Operational Risk | Medium, reliance on hardware and software integration | Medium, complexity in multi-cloud platform management |
| Environmental Risk | Low, minimal direct environmental impact | Low, primarily software services with low footprint |
| Geopolitical Risk | Moderate, operates in multiple countries including US, EU, and Asia | Moderate, global client base exposed to geopolitical tensions |
Block, Inc. faces higher market risk due to its elevated beta, implying greater stock price swings, but benefits from strong balance sheet metrics and favorable interest coverage. Teradata’s main concern is its high debt level, placing it in financial distress territory per Altman Z-score, although it boasts strong profitability and operational efficiency. Investors should weigh Block’s volatility against Teradata’s leverage risks carefully.
Which Stock to Choose?
Block, Inc. (XYZ) shows a favorable income evolution with a 10.06% revenue growth in 2024 and strong net margin growth overall. Its financial ratios are slightly favorable, highlighting good liquidity and moderate leverage. Profitability is moderate with a 13.62% ROE, while debt levels are well-managed. The company holds a very favorable B+ rating.
Teradata Corporation (TDC) presents a mixed income evolution, with a recent revenue decline but favorable margins and net margin growth. Financial ratios are neutral, reflecting strong profitability metrics like an 85.71% ROE but weaker liquidity and higher debt. Its overall rating is also very favorable B+, supported by strong equity returns.
For investors prioritizing durable competitive advantages and value creation, Teradata’s very favorable moat with rising ROIC might appear more attractive, while Block’s slightly favorable moat and solid growth metrics could appeal to those focused on income growth and financial stability. The choice could depend on whether the investor emphasizes growth or returns on invested capital.
Disclaimer: Investment carries a risk of loss of initial capital. The past performance is not a reliable indicator of future results. Be sure to understand risks before making an investment decision.
Go Further
I encourage you to read the complete analyses of Block, Inc. and Teradata Corporation to enhance your investment decisions: