In the fast-evolving software infrastructure sector, Synopsys, Inc. (SNPS) and Block, Inc. (XYZ) stand out as influential players driving innovation. Synopsys leads in electronic design automation and semiconductor IP, while Block revolutionizes payment solutions and financial technology. Their market overlap and distinct innovation strategies make them compelling candidates for investment. Join me as we analyze which company offers the most promising opportunity for your portfolio in 2026.

Table of contents
Companies Overview
I will begin the comparison between Synopsys, Inc. and Block, Inc. by providing an overview of these two companies and their main differences.
Synopsys, Inc. Overview
Synopsys, Inc. operates in the software infrastructure industry, focusing on electronic design automation software used to design and test integrated circuits. Its mission includes providing a broad platform of design, verification, IP solutions, and security testing for various sectors such as electronics, automotive, and medicine. Synopsys is headquartered in Mountain View, California, and employs around 20,000 people.
Block, Inc. Overview
Block, Inc. is also positioned in the software infrastructure industry but centers on payment processing and commerce solutions. It offers hardware and software enabling sellers to accept card payments and manage point-of-sale operations, alongside digital products like Cash App and Weebly for money management and website hosting. The company is based in Oakland, California, with about 12,000 full-time employees.
Key similarities and differences
Both Synopsys and Block operate in technology and software infrastructure, serving diverse markets with innovative tools. While Synopsys focuses on electronic design automation and semiconductor IP, Block specializes in financial transaction technologies and commerce platforms. Synopsys has a larger workforce and market capitalization near 99B, compared to Block’s 40B, reflecting different industry focuses and scale.
Income Statement Comparison
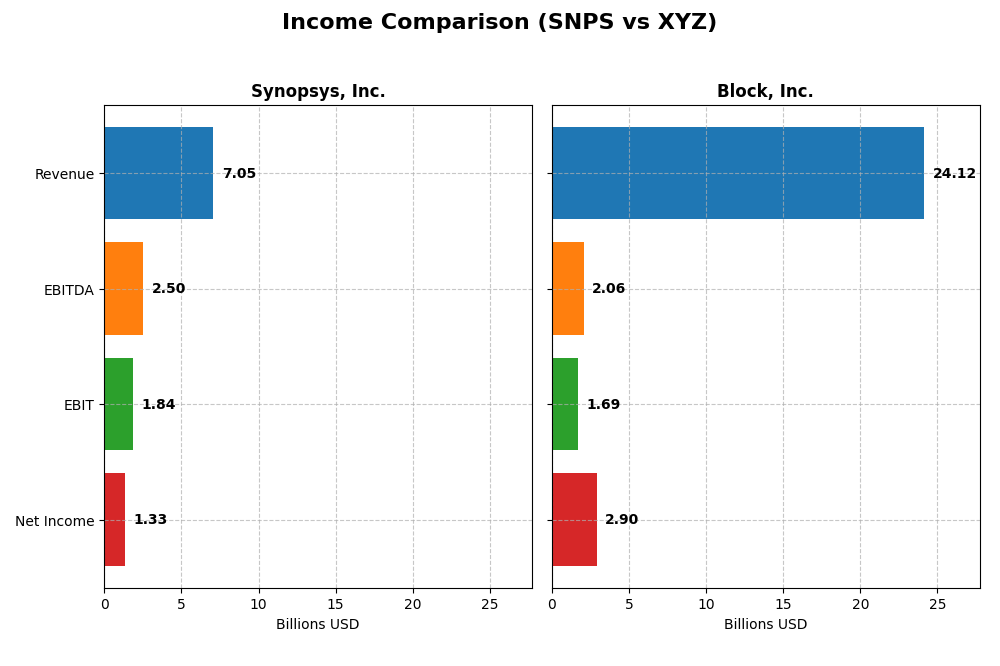
Below is a side-by-side comparison of the most recent fiscal year income statement metrics for Synopsys, Inc. and Block, Inc., highlighting key financial performance indicators.
| Metric | Synopsys, Inc. (SNPS) | Block, Inc. (XYZ) |
|---|---|---|
| Market Cap | 98.8B | 40.2B |
| Revenue | 7.05B | 24.12B |
| EBITDA | 2.50B | 2.06B |
| EBIT | 1.84B | 1.69B |
| Net Income | 1.33B | 2.90B |
| EPS | 8.13 | 4.70 |
| Fiscal Year | 2025 | 2024 |
Income Statement Interpretations
Synopsys, Inc.
Synopsys, Inc. showed steady revenue growth from 2021 to 2025, reaching $7.05B in 2025, with net income rising overall but declining notably in the last year to $1.33B. Margins remained strong, with a gross margin near 77% and a net margin around 19%. The latest year saw slower net income growth and a decline in earnings per share despite favorable revenue and EBIT increases.
Block, Inc.
Block, Inc. experienced significant revenue expansion over 2020-2024, hitting $24.1B in 2024. Net income surged to $2.9B in 2024 from a loss in earlier years, reflecting a strong turnaround. Gross margin improved to 36.85%, while EBIT margin remained modest near 7%. The most recent fiscal year showed robust growth across revenue, net margin, and EPS, indicating a strong recovery phase.
Which one has the stronger fundamentals?
Both companies exhibit favorable income statement trends, but Block, Inc.’s rapid revenue and net income growth, combined with large margin improvements, suggest stronger momentum. Synopsys maintains higher margins and stable profitability but faced recent earnings softness. Overall, Block shows more dynamic growth, while Synopsys offers steadier margin profiles, each with distinct fundamental strengths.
Financial Ratios Comparison
The table below presents a side-by-side comparison of key financial ratios for Synopsys, Inc. (SNPS) and Block, Inc. (XYZ) for their most recent fiscal years, providing an overview of profitability, liquidity, leverage, efficiency, and shareholder returns.
| Ratios | Synopsys, Inc. (2025) | Block, Inc. (2024) |
|---|---|---|
| ROE | 4.7% | 13.6% |
| ROIC | 2.0% | 3.0% |
| P/E | 54.4 | 18.1 |
| P/B | 2.57 | 2.47 |
| Current Ratio | 1.62 | 2.33 |
| Quick Ratio | 1.52 | 2.31 |
| D/E (Debt-to-Equity) | 0.50 | 0.37 |
| Debt-to-Assets | 29.6% | 21.5% |
| Interest Coverage | 2.05 | 95.9 |
| Asset Turnover | 0.15 | 0.66 |
| Fixed Asset Turnover | 5.04 | 45.14 |
| Payout ratio | 0 | 0 |
| Dividend yield | 0% | 0% |
Interpretation of the Ratios
Synopsys, Inc.
Synopsys shows a mixed financial profile with favorable net margin and liquidity ratios but weaker returns on equity and invested capital. Its price-to-earnings ratio is high, indicating expensive valuation, while asset turnover is low. The company does not pay dividends, likely reinvesting earnings to fuel growth and innovation, consistent with its sector’s demands.
Block, Inc.
Block presents a stronger liquidity position and interest coverage, with favorable net margin and moderate returns. Its debt ratios are conservative, and fixed asset turnover is excellent. The firm also does not distribute dividends, suggesting focus on reinvestment and expansion, aligning with its growth-oriented business model and technology investments.
Which one has the best ratios?
Block, Inc. holds a slight advantage with a higher proportion of favorable ratios, including liquidity, debt management, and asset efficiency, compared to Synopsys’ balanced but less robust return metrics. However, both companies reflect no dividend payouts, emphasizing reinvestment, and each carries specific risks worth monitoring.
Strategic Positioning
This section compares the strategic positioning of Synopsys, Inc. and Block, Inc. including market position, key segments, and exposure to technological disruption:
Synopsys, Inc.
- Large market cap near 99B with moderate competitive pressure in software infrastructure.
- Focus on electronic design automation software, IP solutions, and SoC infrastructure for multiple industries.
- Exposure through advanced software and IP products in semiconductor and system design sectors.
Block, Inc.
- Mid-size market cap around 40B, facing higher volatility and competition in payments tech.
- Concentrated on payment hardware, software platforms, cryptocurrency assets, and developer tools.
- Exposure linked to evolving payment technologies and cryptocurrency integration.
Synopsys, Inc. vs Block, Inc. Positioning
Synopsys adopts a diversified approach across electronic design automation and IP segments, serving broad industries, while Block concentrates on financial technology and payment solutions. Synopsys’s broader scope contrasts with Block’s focused fintech innovation.
Which has the best competitive advantage?
Both companies currently shed value with ROIC below WACC, but Block shows improving profitability trends, while Synopsys faces declining returns, indicating Block’s moat position is slightly more favorable despite value destruction.
Stock Comparison
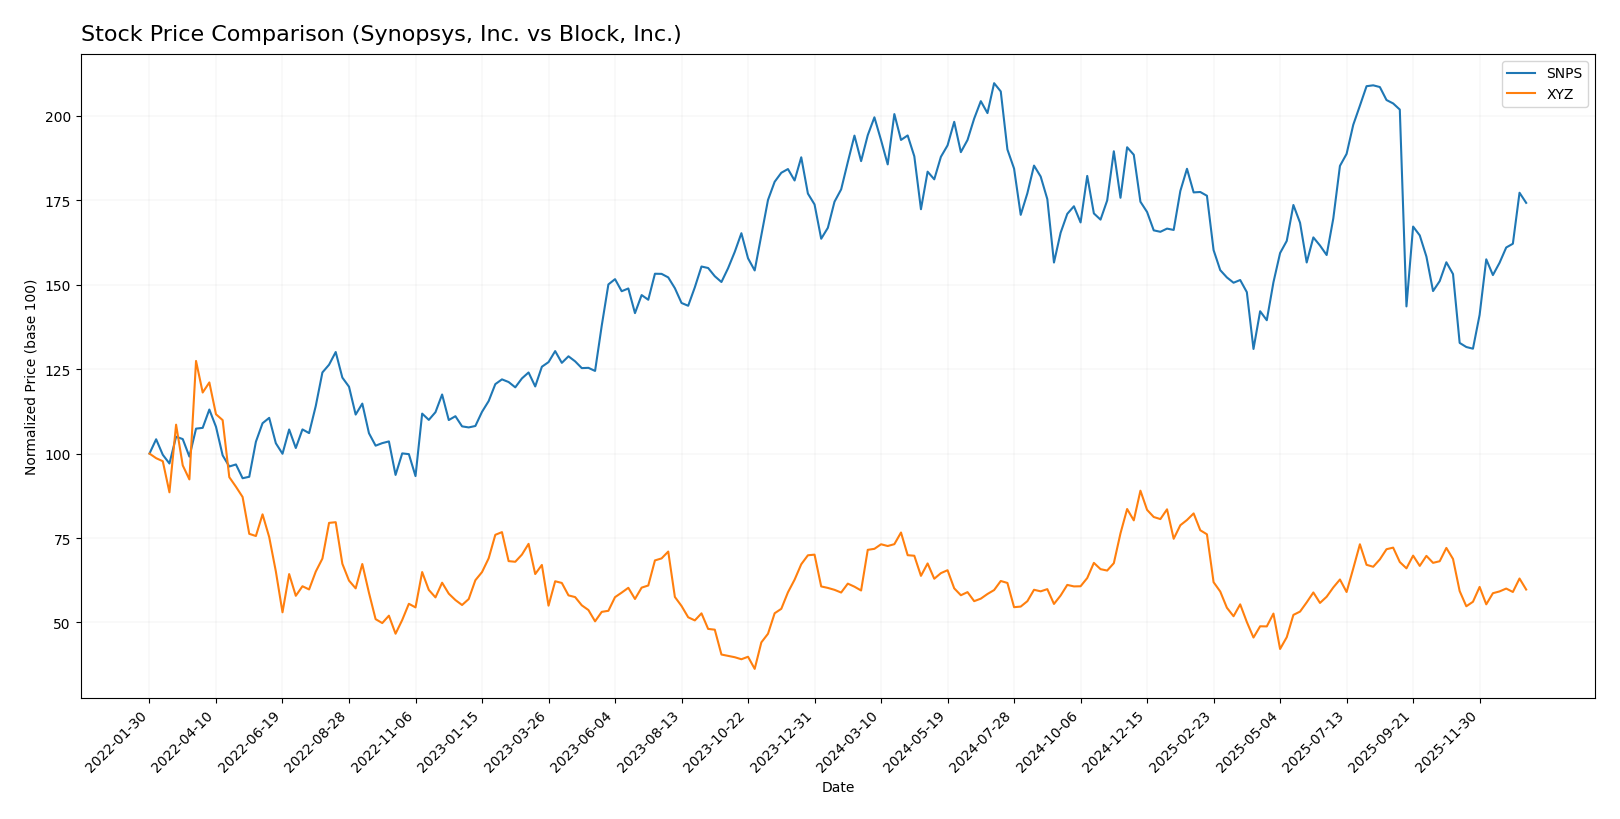
The stock price movements over the past year reveal distinct bearish trends for both Synopsys, Inc. and Block, Inc., with Synopsys showing accelerating decline and Block experiencing decelerating losses amid differing trading volume dynamics.
Trend Analysis
Synopsys, Inc. (SNPS) recorded a -10.31% price change over the past 12 months, indicating a bearish trend with accelerating decline. The stock reached a high of 621.3 and a low of 388.13, showing notable volatility with a standard deviation of 58.85. Recent months show a 13.77% rebound.
Block, Inc. (XYZ) posted a -16.43% price change over the same period, confirming a bearish trend with deceleration. Its price fluctuated between 98.25 and 46.53, with lower volatility at 10.43 standard deviation. Recent trends remain negative with a -13.16% decline.
Comparing the two, Synopsys delivered a higher market performance than Block over the past year, showing a smaller overall loss and recent positive momentum.
Target Prices
The target price consensus for Synopsys, Inc. and Block, Inc. reflects a moderately bullish outlook from analysts.
| Company | Target High | Target Low | Consensus |
|---|---|---|---|
| Synopsys, Inc. | 600 | 425 | 530 |
| Block, Inc. | 100 | 65 | 84.91 |
Analysts expect Synopsys shares to appreciate modestly above the current price of $516.31, while Block’s consensus target of $84.91 suggests room for upside from the present $65.95 trading level.
Analyst Opinions Comparison
This section compares analysts’ ratings and grades for Synopsys, Inc. and Block, Inc.:
Rating Comparison
Synopsys, Inc. Rating
- Rating: B-, considered very favorable.
- Discounted Cash Flow Score: 3, moderate valuation outlook.
- ROE Score: 3, moderate efficiency in generating equity returns.
- ROA Score: 3, moderate asset utilization effectiveness.
- Debt To Equity Score: 2, moderate financial risk.
- Overall Score: 3, moderate overall financial standing.
Block, Inc. Rating
- Rating: B+, considered very favorable.
- Discounted Cash Flow Score: 3, moderate valuation outlook.
- ROE Score: 4, favorable efficiency in generating equity returns.
- ROA Score: 4, favorable asset utilization effectiveness.
- Debt To Equity Score: 2, moderate financial risk.
- Overall Score: 3, moderate overall financial standing.
Which one is the best rated?
Block, Inc. holds a higher rating (B+) than Synopsys, Inc. (B-), with favorable scores in ROE and ROA, while both have the same overall moderate scores and similar debt-to-equity evaluations.
Scores Comparison
The following table summarizes the Altman Z-Score and Piotroski Score for Synopsys, Inc. and Block, Inc.:
SNPS Scores
- Altman Z-Score: 3.54, in the safe zone, indicating low bankruptcy risk.
- Piotroski Score: 4, average financial strength.
XYZ Scores
- Altman Z-Score: 2.70, in the grey zone, indicating moderate bankruptcy risk.
- Piotroski Score: 6, average financial strength.
Which company has the best scores?
Based on provided data, SNPS has a stronger Altman Z-Score in the safe zone, while XYZ has a higher Piotroski Score but both remain average. SNPS shows lower bankruptcy risk than XYZ.
Grades Comparison
Here is the detailed comparison of recent grades issued by reputable grading companies for Synopsys, Inc. and Block, Inc.:
Synopsys, Inc. Grades
The table below summarizes the latest analyst grades for Synopsys, Inc. from verified grading firms.
| Grading Company | Action | New Grade | Date |
|---|---|---|---|
| Piper Sandler | Downgrade | Neutral | 2026-01-13 |
| Morgan Stanley | Maintain | Overweight | 2025-12-12 |
| Rosenblatt | Maintain | Buy | 2025-12-11 |
| Keybanc | Maintain | Overweight | 2025-12-11 |
| Piper Sandler | Maintain | Overweight | 2025-12-11 |
| Needham | Maintain | Buy | 2025-12-11 |
| B of A Securities | Upgrade | Buy | 2025-12-11 |
| JP Morgan | Maintain | Overweight | 2025-12-11 |
| Wells Fargo | Maintain | Equal Weight | 2025-12-11 |
| Rosenblatt | Upgrade | Buy | 2025-12-09 |
Overall, Synopsys shows a generally positive trend with multiple “Buy” and “Overweight” ratings, though a recent downgrade to “Neutral” indicates some caution.
Block, Inc. Grades
Below is the summary of recent analyst grades for Block, Inc. from recognized grading companies.
| Grading Company | Action | New Grade | Date |
|---|---|---|---|
| Piper Sandler | Maintain | Underweight | 2026-01-14 |
| Keefe, Bruyette & Woods | Maintain | Outperform | 2026-01-02 |
| Needham | Maintain | Buy | 2025-11-24 |
| B of A Securities | Maintain | Buy | 2025-11-21 |
| Morgan Stanley | Maintain | Equal Weight | 2025-11-21 |
| BTIG | Maintain | Buy | 2025-11-20 |
| RBC Capital | Maintain | Outperform | 2025-11-20 |
| Stephens & Co. | Maintain | Overweight | 2025-11-20 |
| Mizuho | Maintain | Outperform | 2025-11-20 |
| BTIG | Maintain | Buy | 2025-11-14 |
Block, Inc. maintains a solid standing with numerous “Buy,” “Outperform,” and “Overweight” ratings, balanced by a recent “Underweight” from Piper Sandler.
Which company has the best grades?
Both Synopsys, Inc. and Block, Inc. have received predominantly positive grades, with Synopsys exhibiting a mix of “Buy” and “Overweight” ratings alongside a recent downgrade to “Neutral.” Block, Inc. shows strong support from analysts with many “Buy” and “Outperform” grades, though it faces a recent “Underweight” rating. Investors may interpret these patterns as reflecting differing analyst perspectives on near-term risks and opportunities.
Strengths and Weaknesses
Below is a comparative overview of Synopsys, Inc. (SNPS) and Block, Inc. (XYZ) focusing on key business and financial criteria based on the most recent data.
| Criterion | Synopsys, Inc. (SNPS) | Block, Inc. (XYZ) |
|---|---|---|
| Diversification | Moderate: Revenue mainly from License & Maintenance (3.5B), Technology Services (1.55B) | High: Diverse revenue from Software/Data Products (7.16B), Crypto Assets (10.2B), Transactions (6.6B) |
| Profitability | Mixed: Net margin 19%, ROE 4.7% (unfavorable), ROIC 2% (unfavorable) | Moderate: Net margin 12%, ROE 13.6% (neutral), ROIC 3% (unfavorable) |
| Innovation | Moderate: Strong in software licensing but declining ROIC signals challenges | High: Growing ROIC and innovation in crypto and transaction tech |
| Global presence | Established in semiconductor IP market | Expanding in fintech and crypto globally |
| Market Share | Strong in semiconductor EDA tools | Increasing in fintech, but still evolving |
Key takeaways: Synopsys shows stable revenue streams but suffers declining profitability and value destruction, signaling caution. Block demonstrates stronger diversification and improving profitability trends, making it a slightly more favorable investment option for growth-oriented portfolios.
Risk Analysis
Below is a comparative table outlining key risk factors for Synopsys, Inc. (SNPS) and Block, Inc. (XYZ) based on the most recent data available:
| Metric | Synopsys, Inc. (SNPS) | Block, Inc. (XYZ) |
|---|---|---|
| Market Risk | Beta 1.12, moderate volatility | Beta 2.67, high volatility |
| Debt level | Debt-to-assets 29.64%, moderate | Debt-to-assets 21.53%, low |
| Regulatory Risk | Moderate, tech industry compliance | Moderate, fintech regulatory scrutiny |
| Operational Risk | Moderate, complexity in EDA software | Moderate, hardware-software integration challenges |
| Environmental Risk | Low, primarily software business | Low, digital payment focus |
| Geopolitical Risk | Low to moderate, global supply chains | Moderate, international markets exposure |
The most impactful risks are market volatility and regulatory challenges. Block, Inc. faces higher market risk due to a beta of 2.67, indicating sensitivity to market swings. Synopsys shows moderate debt levels but less volatility. Both companies operate in sectors with evolving regulations, requiring careful monitoring. Overall, Block’s higher market risk and international exposure suggest a need for cautious position sizing.
Which Stock to Choose?
Synopsys, Inc. (SNPS) shows favorable income growth with a 15.12% revenue increase in 2025 and a solid gross margin of 76.98%. However, its profitability ratios reveal mixed signals, including an unfavorable ROE of 4.72% and a high PE ratio of 54.36. Debt levels are moderate with a current ratio of 1.62, and the overall rating is very favorable despite a neutral global ratios opinion.
Block, Inc. (XYZ) exhibits strong income growth, with a 10.06% revenue rise in 2024 and a decent gross margin of 36.85%. Its financial ratios are more favorable overall, highlighted by a 13.62% ROE and a stable debt profile with a current ratio of 2.33. The rating stands at very favorable with a slightly favorable global ratios evaluation, reflecting improving profitability trends.
Considering the ratings and comprehensive financial metrics, SNPS might appear more attractive for investors prioritizing income growth and strong margins, while XYZ could appeal to those valuing balanced financial health and improving returns. Risk-tolerant investors may interpret SNPS’s higher valuation as growth potential, whereas risk-averse profiles might see XYZ’s stable metrics as more reassuring.
Disclaimer: Investment carries a risk of loss of initial capital. The past performance is not a reliable indicator of future results. Be sure to understand risks before making an investment decision.
Go Further
I encourage you to read the complete analyses of Synopsys, Inc. and Block, Inc. to enhance your investment decisions: