In the fast-evolving world of financial technology, Block, Inc. and StoneCo Ltd. stand out as key players shaping the future of digital payments. Both companies operate in the software infrastructure industry, focusing on empowering merchants with innovative payment solutions and seamless commerce experiences. This comparison will dive into their market strategies and growth potential to help you, the investor, identify which company offers the most compelling opportunity for your portfolio.
Table of contents
Companies Overview
I will begin the comparison between Block, Inc. and StoneCo Ltd. by providing an overview of these two companies and their main differences.
Block, Inc. Overview
Block, Inc. develops tools enabling sellers to accept card payments, delivering hardware and software solutions for point-of-sale transactions. Its product range includes card readers, payment terminals, and software suites such as Square Point of Sale and Cash App. The company operates primarily in the US, Canada, Japan, Australia, and parts of Europe, positioning itself as a comprehensive payment infrastructure provider with a market cap of $40B.
StoneCo Ltd. Overview
StoneCo Ltd. offers financial technology solutions targeted at merchants and partners in Brazil, facilitating electronic commerce across in-store, online, and mobile channels. It serves roughly 1.77M clients, focusing on small and medium businesses, with a distribution model relying on proprietary hubs and sales teams. Headquartered in the Cayman Islands, StoneCo operates as a subsidiary within the financial technology sector and has a market cap near $3.9B.
Key similarities and differences
Both Block and StoneCo operate in the software infrastructure industry, providing financial technology solutions to merchants for payment processing. They focus on enabling commerce through hardware and software but differ in geographic reach and scale. Block has a broader international presence and a larger market cap, while StoneCo concentrates on the Brazilian market with a smaller client base and workforce. Their business models share core elements but are adapted to distinct regional markets.
Income Statement Comparison
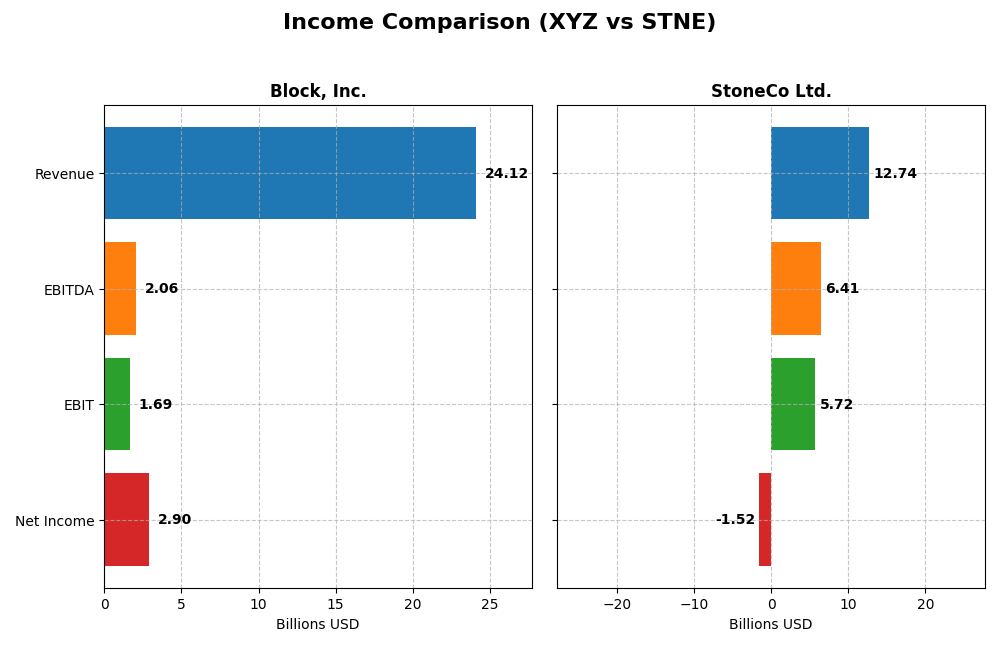
This table compares the most recent fiscal year income statement metrics for Block, Inc. and StoneCo Ltd., highlighting their market cap, revenue, profitability, and earnings per share.
| Metric | Block, Inc. (XYZ) | StoneCo Ltd. (STNE) |
|---|---|---|
| Market Cap | 40.2B USD | 3.9B BRL |
| Revenue | 24.1B USD | 12.7B BRL |
| EBITDA | 2.1B USD | 6.4B BRL |
| EBIT | 1.7B USD | 5.7B BRL |
| Net Income | 2.9B USD | -1.5B BRL |
| EPS | 4.7 USD | -5.02 BRL |
| Fiscal Year | 2024 | 2024 |
Income Statement Interpretations
Block, Inc.
Block, Inc. demonstrated strong revenue growth from 2020 to 2024, with a 154% increase, accompanied by a substantial rise in net income, which grew over 1,200% in the same period. Gross margins remained favorable around 36.85%, while net margins improved significantly to 12.01%. The 2024 fiscal year showed accelerated revenue and net income growth, though operating expenses grew in line with revenue.
StoneCo Ltd.
StoneCo Ltd. experienced robust revenue growth of 302% from 2020 to 2024, with gross margins staying favorable at 73.4%. However, despite an improved EBIT margin of 44.86%, net income declined sharply over the period, resulting in a negative net margin of -11.89%. The 2024 year saw continuing revenue and operating profit growth, yet net margin and EPS deteriorated significantly.
Which one has the stronger fundamentals?
Block, Inc. displays stronger fundamentals with favorable growth in revenue, net income, and margins, alongside a manageable interest expense and improving profitability. StoneCo shows impressive top-line growth and solid gross and EBIT margins but faces challenges with negative net margins and deteriorating net income and EPS. Overall, Block’s income statement metrics indicate more consistent financial health.
Financial Ratios Comparison
Below is a comparison of key financial ratios for Block, Inc. (XYZ) and StoneCo Ltd. (STNE) based on the most recent fiscal year data available for 2024.
| Ratios | Block, Inc. (XYZ) | StoneCo Ltd. (STNE) |
|---|---|---|
| ROE | 13.6% | -12.9% |
| ROIC | 3.0% | 22.4% |
| P/E | 18.1 | -9.8 |
| P/B | 2.47 | 1.27 |
| Current Ratio | 2.33 | 1.37 |
| Quick Ratio | 2.31 | 1.37 |
| D/E (Debt-to-Equity) | 0.37 | 1.10 |
| Debt-to-Assets | 21.5% | 23.5% |
| Interest Coverage | 95.9 | 5.57 |
| Asset Turnover | 0.66 | 0.23 |
| Fixed Asset Turnover | 45.1 | 6.95 |
| Payout Ratio | 0 | 0 |
| Dividend Yield | 0 | 0 |
Interpretation of the Ratios
Block, Inc.
Block, Inc. shows a balanced financial profile with half of its ratios favorable, including a strong current ratio of 2.33 and excellent interest coverage at 181.31, while its return on invested capital (3.03%) and WACC (14.27%) are unfavorable. The company does not pay dividends, reflecting a reinvestment focus typical for its growth phase and technology sector positioning.
StoneCo Ltd.
StoneCo Ltd. presents mixed results with 50% favorable ratios such as a robust ROIC of 22.41% and favorable PB ratio at 1.27, but concerns arise from negative net margin (-11.89%) and ROE (-12.87%), alongside a high debt-to-equity ratio of 1.1. Like Block, StoneCo does not distribute dividends, indicating reinvestment or growth priorities amid ongoing financial challenges.
Which one has the best ratios?
Both companies have a slightly favorable global ratios opinion with 50% favorable metrics; however, Block, Inc. demonstrates stronger liquidity and interest coverage, while StoneCo excels in ROIC but struggles with profitability and leverage. Investors should weigh these contrasting strengths and weaknesses carefully based on their risk tolerance and investment goals.
Strategic Positioning
This section compares the strategic positioning of Block, Inc. and StoneCo Ltd., including market position, key segments, and exposure to technological disruption:
Block, Inc.
- Large market cap of 40B USD with high beta indicating volatility and intense competition in software infrastructure.
- Diverse revenue streams from software, cryptocurrency assets, hardware, and transaction services, supporting multiple business drivers.
- Exposure to cryptocurrency and software innovation, with hardware integration supporting payments; potential disruption from evolving fintech technologies.
StoneCo Ltd.
- Smaller market cap near 3.9B USD, moderate beta, focused on Brazilian fintech market.
- Concentrated on fintech solutions for SMBs and digital merchants mainly in Brazil, relying on proprietary Stone Hubs.
- Technology-driven fintech solutions with a focus on hyper-local sales and software partnerships, facing disruption risks in Brazilian electronic commerce.
Block, Inc. vs StoneCo Ltd. Positioning
Block, Inc. pursues a diversified approach across software, hardware, and cryptocurrency, while StoneCo concentrates on fintech services tailored to the Brazilian market. Block’s scale and product variety contrast with StoneCo’s localized specialization and client focus.
Which has the best competitive advantage?
StoneCo exhibits a very favorable moat with ROIC well above WACC and strong profitability growth, indicating durable competitive advantage. Block, despite growing ROIC, currently sheds value and shows a slightly unfavorable moat status.
Stock Comparison
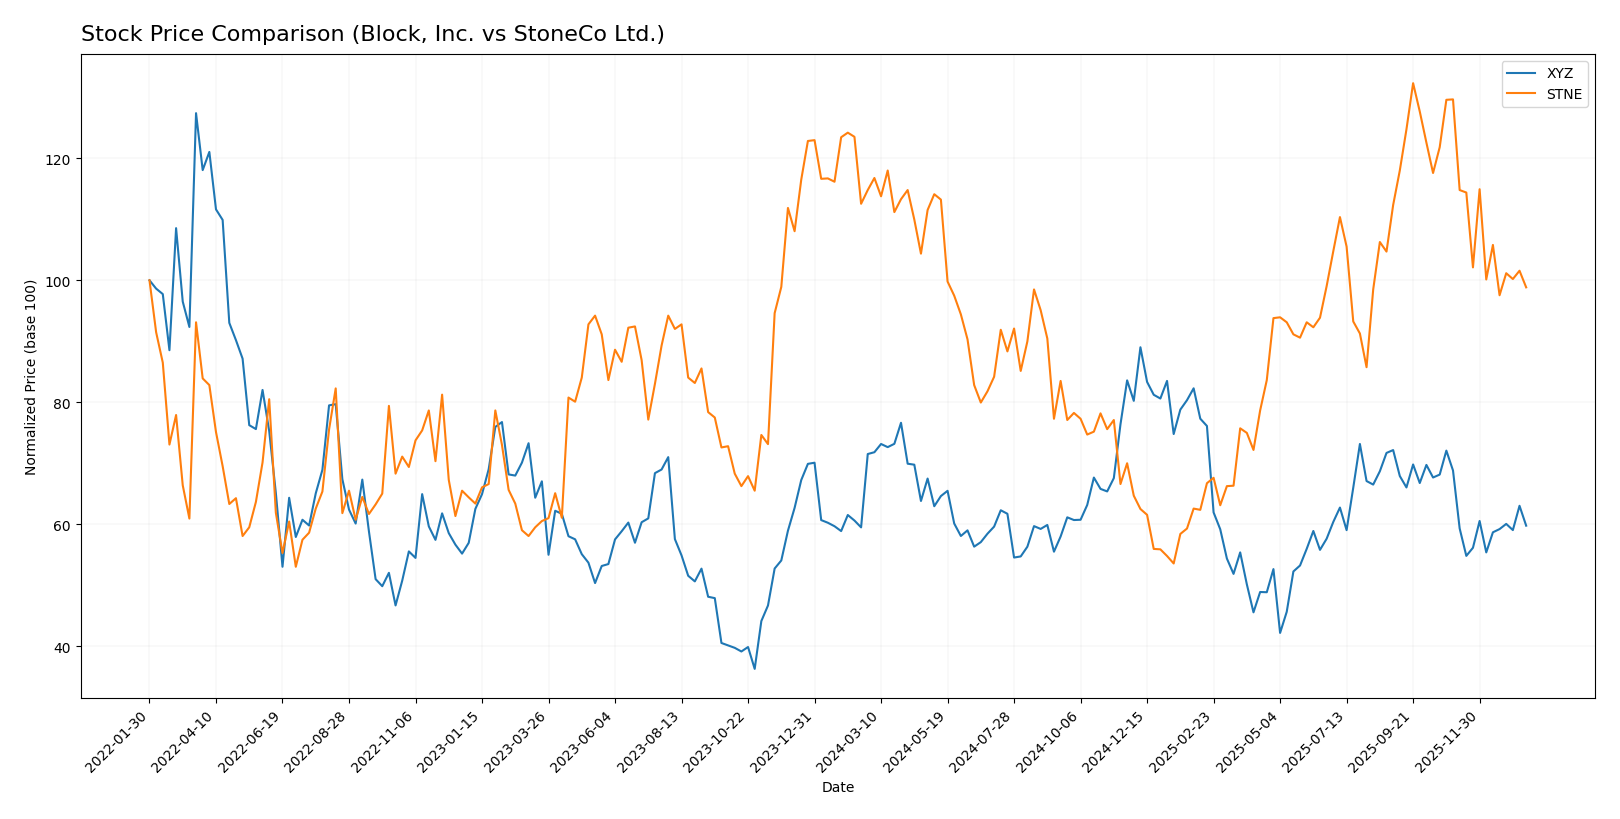
The past year reveals notable bearish trends for both Block, Inc. and StoneCo Ltd., with declining prices and decelerating momentum, while trading volumes show diverging dynamics between the two stocks.
Trend Analysis
Block, Inc. experienced a -16.43% price decline over the past 12 months, indicating a bearish trend with decelerating downward momentum and high volatility, peaking at 98.25 and bottoming at 46.53.
StoneCo Ltd. also posted a bearish trend, with a -13.9% price change over the same period, exhibiting deceleration and lower volatility than Block, hitting a high of 19.4 and a low of 7.85.
Comparing both, Block, Inc. showed a steeper overall decline but higher volatility, while StoneCo Ltd. had a slightly less negative price performance, making StoneCo the better performer between the two during this period.
Target Prices
Analysts present a clear target price consensus for both Block, Inc. and StoneCo Ltd.
| Company | Target High | Target Low | Consensus |
|---|---|---|---|
| Block, Inc. | 100 | 65 | 84.91 |
| StoneCo Ltd. | 20 | 20 | 20 |
For Block, Inc., the consensus target price at 84.91 suggests upside potential from the current price of 65.95. StoneCo Ltd.’s target at 20 indicates expected appreciation from the current 14.49 price, reflecting analyst optimism.
Analyst Opinions Comparison
This section compares analysts’ ratings and grades for Block, Inc. and StoneCo Ltd.:
Rating Comparison
Block, Inc. Rating
- Rating: B+, assessed as Very Favorable by analysts.
- Discounted Cash Flow Score: Moderate at 3.
- ROE Score: Favorable at 4, indicating strong equity profit generation.
- ROA Score: Favorable at 4, showing effective asset utilization.
- Debt To Equity Score: Moderate at 2, moderate financial risk.
- Overall Score: Moderate at 3.
StoneCo Ltd. Rating
- Rating: C, also assessed as Very Favorable.
- Discounted Cash Flow Score: Moderate at 3.
- ROE Score: Very Unfavorable at 1, indicating weak equity profit generation.
- ROA Score: Very Unfavorable at 1, showing poor asset utilization.
- Debt To Equity Score: Very Unfavorable at 1, high financial risk.
- Overall Score: Moderate at 2.
Which one is the best rated?
Block, Inc. holds a clearly better rating with a B+ and higher scores in ROE, ROA, and debt management, while StoneCo Ltd. has lower scores indicating weaker financial metrics.
Scores Comparison
Here is a comparison of the Altman Z-Score and Piotroski Score for Block, Inc. and StoneCo Ltd.:
Block, Inc. Scores
- Altman Z-Score: 2.70, indicating moderate bankruptcy risk in the grey zone.
- Piotroski Score: 6, reflecting average financial strength.
StoneCo Ltd. Scores
- Altman Z-Score: 1.02, indicating high bankruptcy risk in the distress zone.
- Piotroski Score: 5, reflecting average financial strength.
Which company has the best scores?
Block, Inc. has a higher Altman Z-Score, placing it in the grey zone versus StoneCo’s distress zone, while both have average Piotroski Scores. Based strictly on these scores, Block, Inc. shows relatively better financial stability.
Grades Comparison
The following tables and summaries present the recent grades awarded to Block, Inc. and StoneCo Ltd. by recognized financial institutions:
Block, Inc. Grades
This table summarizes the latest grades and actions from established grading companies for Block, Inc.:
| Grading Company | Action | New Grade | Date |
|---|---|---|---|
| Piper Sandler | Maintain | Underweight | 2026-01-14 |
| Keefe, Bruyette & Woods | Maintain | Outperform | 2026-01-02 |
| Needham | Maintain | Buy | 2025-11-24 |
| B of A Securities | Maintain | Buy | 2025-11-21 |
| Morgan Stanley | Maintain | Equal Weight | 2025-11-21 |
| BTIG | Maintain | Buy | 2025-11-20 |
| RBC Capital | Maintain | Outperform | 2025-11-20 |
| Stephens & Co. | Maintain | Overweight | 2025-11-20 |
| Mizuho | Maintain | Outperform | 2025-11-20 |
| BTIG | Maintain | Buy | 2025-11-14 |
Block, Inc. shows a consensus leaning toward Buy and Outperform grades, with a single Underweight rating by Piper Sandler.
StoneCo Ltd. Grades
This table summarizes the latest grades and actions from established grading companies for StoneCo Ltd.:
| Grading Company | Action | New Grade | Date |
|---|---|---|---|
| Goldman Sachs | Maintain | Buy | 2025-10-14 |
| B of A Securities | Maintain | Buy | 2025-09-09 |
| UBS | Maintain | Buy | 2025-08-29 |
| JP Morgan | Maintain | Overweight | 2025-07-16 |
| Barclays | Maintain | Equal Weight | 2025-05-12 |
| Barclays | Maintain | Equal Weight | 2025-04-23 |
| Citigroup | Upgrade | Buy | 2025-04-22 |
| Barclays | Maintain | Equal Weight | 2025-03-21 |
| Morgan Stanley | Maintain | Underweight | 2025-03-21 |
| Goldman Sachs | Maintain | Buy | 2025-02-06 |
StoneCo Ltd.’s grades generally indicate a Buy consensus, with several Equal Weight ratings and one Underweight from Morgan Stanley.
Which company has the best grades?
Both Block, Inc. and StoneCo Ltd. hold a Buy consensus from analysts, but Block, Inc. has more frequent Buy and Outperform ratings, while StoneCo Ltd. shows a mix of Buy and Equal Weight grades. This suggests a somewhat stronger positive sentiment toward Block, Inc., potentially influencing investor confidence and portfolio decisions.
Strengths and Weaknesses
Below is a comparative overview of Block, Inc. and StoneCo Ltd. highlighting their key strengths and weaknesses based on the latest financial and strategic data.
| Criterion | Block, Inc. (XYZ) | StoneCo Ltd. (STNE) |
|---|---|---|
| Diversification | High: Revenue streams from Software & Data (7.16B), Cryptocurrency Assets (10.2B), Hardware, and Transactions (6.61B) | Moderate: Primarily focused on payment solutions, less diversified product portfolio |
| Profitability | Moderate: Net margin 12.0%, ROE 13.6%, but ROIC 3.0% below WACC (14.3%) signals value erosion | Challenged: Negative net margin (-11.9%) and ROE (-12.9%), but ROIC strong at 22.4% exceeding WACC (10.7%) |
| Innovation | Solid: Growing ROIC trend (+13.7%), significant investments in crypto and software products | Strong: Very favorable ROIC trend (+371%), indicating durable competitive advantage and innovation |
| Global presence | Broad: Global operations with substantial hardware and crypto assets exposure | Focused: Mainly Brazilian and Latin American markets with growing international ambitions |
| Market Share | Significant in fintech and crypto sectors with expanding transaction volumes | Competitive in Latin American fintech, with improving profitability and market position |
Key takeaway: Block, Inc. offers diversified revenue with improving profitability but currently struggles to generate returns above capital costs, indicating caution. StoneCo Ltd. shows strong value creation and innovation potential despite recent profitability challenges, suggesting higher risk but attractive growth prospects.
Risk Analysis
Below is a comparative table highlighting key risks for Block, Inc. (XYZ) and StoneCo Ltd. (STNE) based on the latest available data for 2024:
| Metric | Block, Inc. (XYZ) | StoneCo Ltd. (STNE) |
|---|---|---|
| Market Risk | High beta 2.67; volatile tech sector exposure | Beta 1.84; emerging market (Brazil) exposure |
| Debt Level | Low debt-to-equity 0.37; strong interest coverage (181x) | High debt-to-equity 1.1; moderate interest coverage (5.4x) |
| Regulatory Risk | Moderate US and international fintech regulations | Elevated due to complex Brazilian financial regulations and geopolitical factors |
| Operational Risk | Diversified payment solutions; moderate operational complexity | Concentrated regional operations; dependence on local infrastructure |
| Environmental Risk | Low direct environmental impact; tech infrastructure | Low but potential risks due to regional environmental policies |
| Geopolitical Risk | Moderate, with operations in multiple countries | High, due to Brazil’s political and economic volatility |
The most impactful risks are StoneCo’s high debt level combined with geopolitical and regulatory challenges in Brazil, raising financial distress concerns (Altman Z-Score in distress zone). Block shows higher market volatility but benefits from lower leverage and diversified markets, placing it in a grey zone for bankruptcy risk. Investors should weigh regional exposure and financial stability carefully.
Which Stock to Choose?
Block, Inc. (XYZ) shows a favorable income evolution with strong revenue and net income growth over 2020-2024, supported by a slightly favorable financial ratios profile. Profitability is moderate with a 13.6% ROE, low debt levels, and a very favorable B+ rating, though the company is slightly value-destructive based on ROIC versus WACC.
StoneCo Ltd. (STNE) exhibits favorable revenue growth but struggles with negative net margins and ROE in 2024. Its financial ratios are mixed, with a high debt-to-equity ratio but strong ROIC exceeding WACC, indicating value creation. The company holds a very favorable C rating despite operating in financial distress per Altman Z-Score.
For investors, Block, Inc. might appear more suitable for those prioritizing steady income growth and moderate risk, while StoneCo could be interpreted as appealing to risk-tolerant investors seeking value creation amid financial challenges. Each profile should consider these nuances in the context of their investment strategy.
Disclaimer: Investment carries a risk of loss of initial capital. The past performance is not a reliable indicator of future results. Be sure to understand risks before making an investment decision.
Go Further
I encourage you to read the complete analyses of Block, Inc. and StoneCo Ltd. to enhance your investment decisions: