In today’s fast-evolving tech landscape, Palo Alto Networks, Inc. (PANW) and Block, Inc. (XYZ) stand out as influential players in the software infrastructure sector. While Palo Alto Networks leads in cybersecurity innovation, Block excels in payment solutions and financial technology. Their shared focus on cutting-edge software and expansion into new markets makes them ideal candidates for comparison. Let’s explore which company offers the most compelling investment opportunity for your portfolio.

Table of contents
Companies Overview
I will begin the comparison between Palo Alto Networks and Block by providing an overview of these two companies and their main differences.
Palo Alto Networks Overview
Palo Alto Networks, Inc. is a leading cybersecurity company focused on providing comprehensive solutions worldwide. Its offerings include firewall appliances, security management software, and cloud security services. The company serves various industries such as financial services, healthcare, and telecommunications, positioning itself as a critical infrastructure provider in cybersecurity with a market cap of 128B USD and over 15.7K employees.
Block Overview
Block, Inc. develops tools that enable sellers to accept card payments and manage sales analytics, along with hardware like card readers and payment terminals. It also offers software solutions for retail and restaurant management, as well as the Cash App for personal finance. Serving multiple countries, Block has a market cap of 40B USD and employs approximately 12K people, focusing on infrastructure software in payment processing.
Key similarities and differences
Both Palo Alto Networks and Block operate in the software infrastructure industry, emphasizing technology solutions for business operations. Palo Alto Networks specializes in cybersecurity products and services, while Block focuses on payment processing hardware and software. Their market caps and employee counts differ significantly, with Palo Alto Networks being larger and more focused on security, whereas Block targets financial transactions and retail management.
Income Statement Comparison
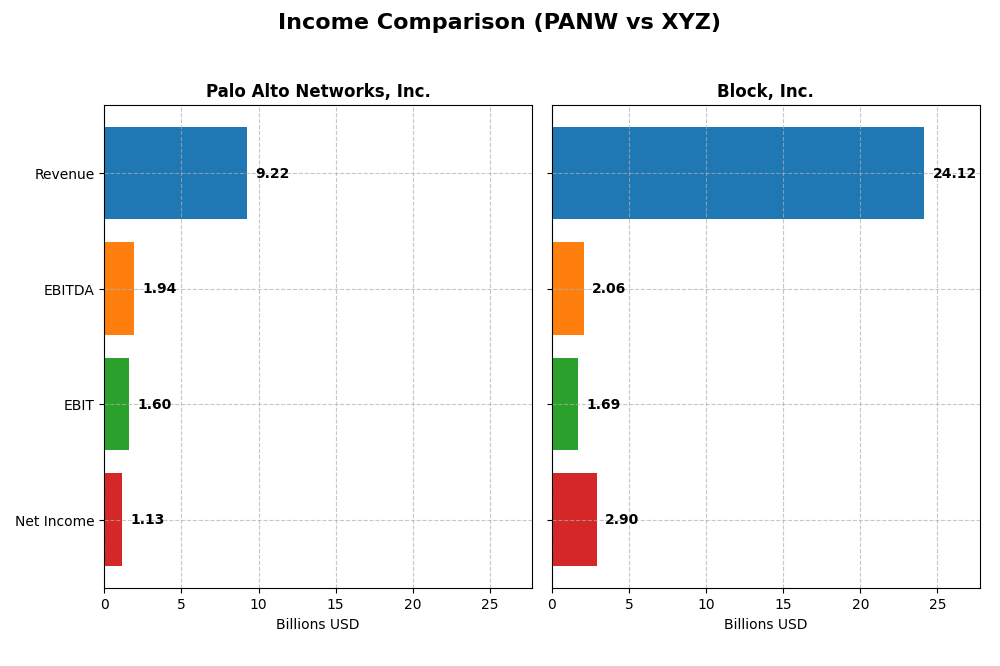
Below is a side-by-side comparison of the latest fiscal year income statements for Palo Alto Networks, Inc. and Block, Inc., highlighting key financial metrics.
| Metric | Palo Alto Networks, Inc. | Block, Inc. |
|---|---|---|
| Market Cap | 128.4B | 40.2B |
| Revenue | 9.22B | 24.12B |
| EBITDA | 1.94B | 2.06B |
| EBIT | 1.60B | 1.69B |
| Net Income | 1.13B | 2.90B |
| EPS | 1.71 | 4.70 |
| Fiscal Year | 2025 | 2024 |
Income Statement Interpretations
Palo Alto Networks, Inc.
From 2021 to 2025, Palo Alto Networks demonstrated strong revenue growth, rising from $4.3B to $9.2B, with net income improving from a loss of $0.5B to a positive $1.1B. Margins generally improved, with a solid gross margin of 73.4% and a net margin of 12.3% in 2025. However, net margin and EPS declined in the last year despite revenue and EBIT growth, indicating some pressure on profitability.
Block, Inc.
Between 2020 and 2024, Block’s revenue more than doubled, reaching $24.1B, with net income shifting from a modest $0.2B profit to $2.9B in 2024. The gross margin improved to 36.9%, while EBIT margin remained modest at 7.0%. The latest year saw significant growth in net margin and EPS, supported by a sharp increase in EBIT, although operating expenses grew unfavorably relative to revenue.
Which one has the stronger fundamentals?
Both companies present favorable income statement evaluations with over 85% positive indicators. Palo Alto Networks excels in margin strength and consistent revenue and net income growth over the period, while Block shines with higher overall revenue growth and dramatic recent earnings expansion. Margin quality favors Palo Alto, but Block’s rapid profitability turnaround and scale represent a strong fundamental profile.
Financial Ratios Comparison
The table below presents the most recent key financial ratios for Palo Alto Networks, Inc. and Block, Inc., providing a snapshot of their performance and financial health as of fiscal year 2025 and 2024 respectively.
| Ratios | Palo Alto Networks, Inc. (2025) | Block, Inc. (2024) |
|---|---|---|
| ROE | 14.49% | 13.62% |
| ROIC | 5.67% | 3.03% |
| P/E | 101.43 | 18.10 |
| P/B | 14.70 | 2.47 |
| Current Ratio | 0.89 | 2.33 |
| Quick Ratio | 0.89 | 2.31 |
| D/E | 0.04 | 0.37 |
| Debt-to-Assets | 1.43% | 21.53% |
| Interest Coverage | 414.3 | 95.93 |
| Asset Turnover | 0.39 | 0.66 |
| Fixed Asset Turnover | 12.56 | 45.14 |
| Payout ratio | 0 | 0 |
| Dividend yield | 0 | 0 |
Interpretation of the Ratios
Palo Alto Networks, Inc.
Palo Alto Networks shows a mix of strengths and weaknesses in its financial ratios. Favorable metrics include net margin at 12.3%, low debt-to-equity at 0.04, and strong interest coverage of 532.53, indicating solid financial health. However, the company faces challenges with a low current ratio of 0.89 and high price multiples (PE 101.43, PB 14.7), suggesting valuation concerns. It does not pay dividends, likely reflecting a reinvestment strategy in its growth phase.
Block, Inc.
Block, Inc. presents generally stronger liquidity ratios, with a current ratio of 2.33 and quick ratio of 2.31, both favorable. Its net margin is positive at 12.01%, and debt levels are manageable (debt-to-assets 21.53%). However, the weighted average cost of capital (WACC) is relatively high at 14.27%, which is unfavorable. Like Palo Alto, Block does not pay dividends, possibly prioritizing growth investments and innovation.
Which one has the best ratios?
Both companies have a slightly favorable ratio profile, but Block, Inc. holds an edge with a higher proportion of favorable liquidity and solvency ratios (50% versus 42.86%). Meanwhile, Palo Alto Networks exhibits stronger profitability margins but struggles with liquidity and valuation metrics. The choice depends on the investor’s focus on liquidity versus profitability and valuation risk.
Strategic Positioning
This section compares the strategic positioning of Palo Alto Networks and Block, including market position, key segments, and exposure to technological disruption:
Palo Alto Networks, Inc.
- Large market cap ($128B) with moderate beta (0.75); operates in competitive cybersecurity software sector.
- Revenue driven mainly by subscriptions ($4.97B) and support ($2.45B), focusing on cybersecurity products and services.
- Cybersecurity software faces constant threat from evolving cyber risks but benefits from growing cloud and IoT security needs.
Block, Inc.
- Mid-size market cap ($40B) with high beta (2.67); active in competitive payment and fintech software.
- Revenue diversified across cryptocurrency assets ($10.2B), software ($7.16B), and payment transactions ($6.61B).
- Fintech and cryptocurrency exposure imply high disruption risk but also potential for innovation-driven growth.
Palo Alto Networks, Inc. vs Block, Inc. Positioning
Palo Alto Networks adopts a concentrated strategy focused on cybersecurity software and subscription services, benefiting from steady demand but facing intense competition. Block pursues a diversified fintech approach spanning payments, software, and crypto assets, exposing it to broader market volatility and technological shifts.
Which has the best competitive advantage?
Both companies show slightly unfavorable MOAT evaluations, shedding value but with growing profitability trends. Neither demonstrates a strong sustainable competitive advantage based on ROIC versus WACC analysis over recent years.
Stock Comparison
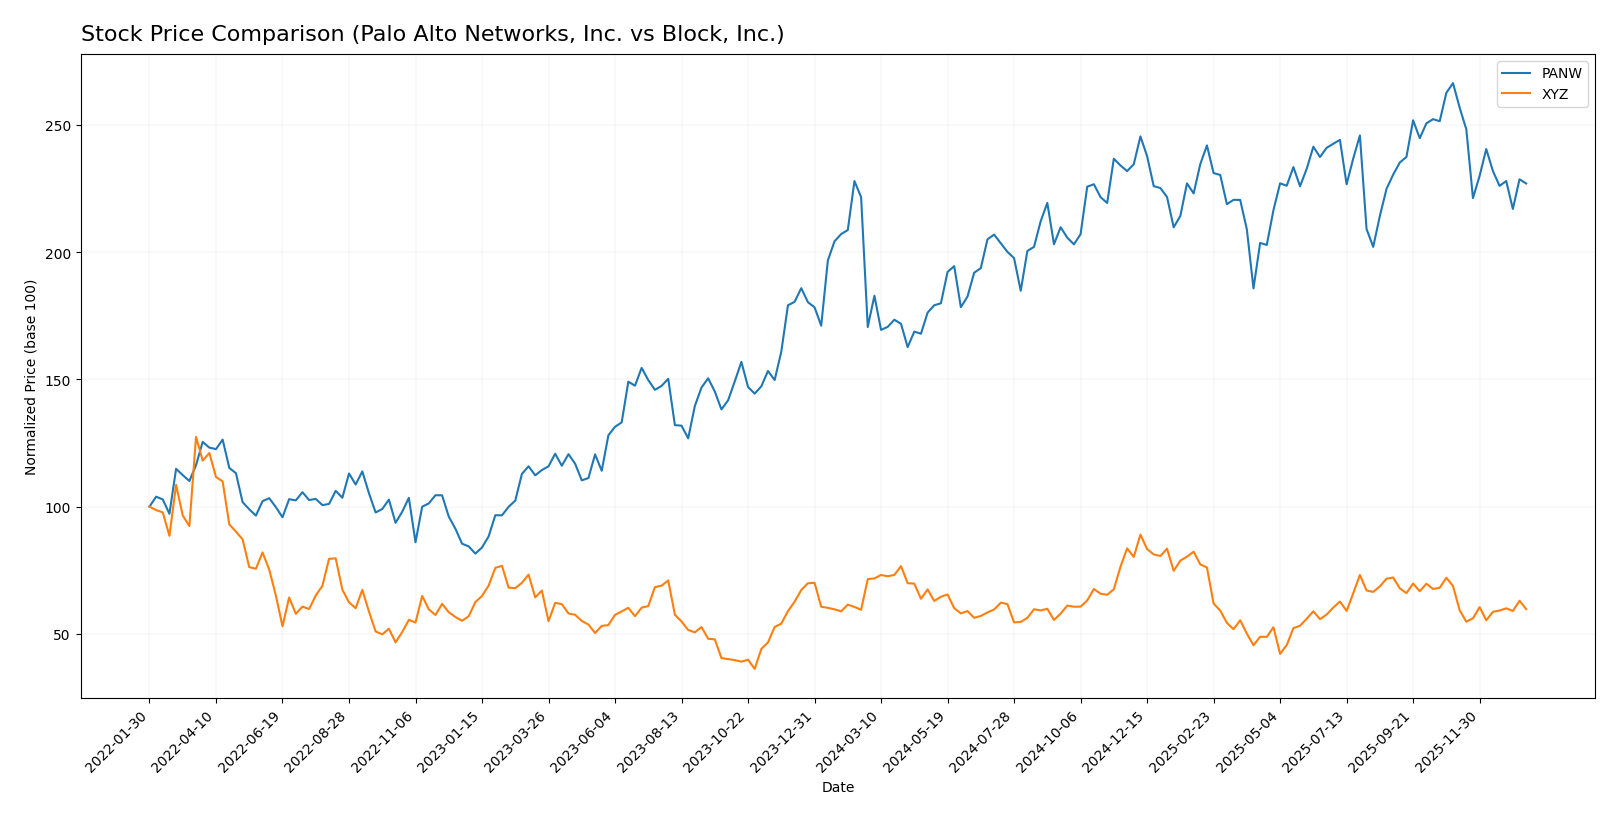
The stock prices of Palo Alto Networks, Inc. and Block, Inc. have shown contrasting movements over the past 12 months, with significant fluctuations and varying trading dynamics shaping their respective trends.
Trend Analysis
Palo Alto Networks, Inc. exhibited a bullish trend over the past year with a 33.05% price increase and a deceleration in upward momentum, reaching a high of 220.24 and a low of 134.51. Recent months show a negative slope with a -14.79% decline.
Block, Inc. showed a bearish trend with a -16.43% price change over the past year and decelerating decline, hitting a high of 98.25 and a low of 46.53. The recent trend continues downward with a -13.16% change and near-neutral slope.
Comparing both, Palo Alto Networks delivered the highest market performance with a strong positive price change, while Block, Inc. faced sustained price declines throughout the period analyzed.
Target Prices
The consensus target prices indicate a generally positive outlook from analysts for both Palo Alto Networks, Inc. and Block, Inc.
| Company | Target High | Target Low | Consensus |
|---|---|---|---|
| Palo Alto Networks, Inc. | 265 | 157 | 231.07 |
| Block, Inc. | 100 | 65 | 84.91 |
Analysts expect Palo Alto Networks to trade well above its current price of $187.66, reflecting strong growth potential. Block’s consensus target of $84.91 suggests upside from its current price of $65.95, though with higher volatility risk.
Analyst Opinions Comparison
This section compares analysts’ ratings and grades for Palo Alto Networks, Inc. and Block, Inc.:
Rating Comparison
Palo Alto Networks, Inc. Rating
- Rating: B, evaluated as Very Favorable by analysts.
- Discounted Cash Flow Score: 4, indicating a Favorable valuation outlook.
- ROE Score: 4, showing strong profit generation from equity.
- ROA Score: 3, reflecting moderate asset utilization efficiency.
- Debt To Equity Score: 4, indicating low financial risk and strong balance sheet.
- Overall Score: 3, a Moderate overall financial standing.
Block, Inc. Rating
- Rating: B+, also considered Very Favorable by analysts.
- Discounted Cash Flow Score: 3, seen as Moderate valuation.
- ROE Score: 4, similarly strong profit efficiency.
- ROA Score: 4, slightly better asset utilization than PANW.
- Debt To Equity Score: 2, a moderate level of financial risk.
- Overall Score: 3, also Moderate overall financial standing.
Which one is the best rated?
Based solely on the provided data, Block, Inc. holds a slightly higher rating of B+ compared to Palo Alto Networks’ B. While both share the same overall score, Palo Alto shows stronger discounted cash flow and debt metrics, whereas Block scores better on return on assets.
Scores Comparison
Here is the comparison of the financial scores for Palo Alto Networks, Inc. and Block, Inc.:
Palo Alto Networks, Inc. Scores
- Altman Z-Score: 5.95, indicating a safe zone with low bankruptcy risk.
- Piotroski Score: 6, considered average financial strength.
Block, Inc. Scores
- Altman Z-Score: 2.70, in the grey zone with moderate bankruptcy risk.
- Piotroski Score: 6, also reflecting average financial strength.
Which company has the best scores?
Palo Alto Networks shows a stronger Altman Z-Score, placing it in the safe zone, while Block remains in the grey zone. Both companies share an identical Piotroski Score of 6, indicating average financial health.
Grades Comparison
Here is a detailed comparison of the latest grades assigned to Palo Alto Networks, Inc. and Block, Inc.:
Palo Alto Networks, Inc. Grades
The following table summarizes recent grades from reputable financial institutions for Palo Alto Networks, Inc.:
| Grading Company | Action | New Grade | Date |
|---|---|---|---|
| UBS | Maintain | Neutral | 2026-01-13 |
| Piper Sandler | Maintain | Overweight | 2026-01-05 |
| Guggenheim | Upgrade | Neutral | 2026-01-05 |
| Morgan Stanley | Maintain | Overweight | 2025-12-18 |
| Goldman Sachs | Maintain | Buy | 2025-11-21 |
| HSBC | Downgrade | Reduce | 2025-11-21 |
| Needham | Maintain | Buy | 2025-11-20 |
| WestPark Capital | Maintain | Hold | 2025-11-20 |
| Bernstein | Maintain | Outperform | 2025-11-20 |
| DA Davidson | Maintain | Buy | 2025-11-20 |
Overall, the grading trend for Palo Alto Networks shows mostly stable to positive ratings, with a majority of buy and overweight recommendations, though one downgrade to reduce was noted.
Block, Inc. Grades
The following table presents recent grades from recognized grading companies for Block, Inc.:
| Grading Company | Action | New Grade | Date |
|---|---|---|---|
| Piper Sandler | Maintain | Underweight | 2026-01-14 |
| Keefe, Bruyette & Woods | Maintain | Outperform | 2026-01-02 |
| Needham | Maintain | Buy | 2025-11-24 |
| B of A Securities | Maintain | Buy | 2025-11-21 |
| Morgan Stanley | Maintain | Equal Weight | 2025-11-21 |
| BTIG | Maintain | Buy | 2025-11-20 |
| RBC Capital | Maintain | Outperform | 2025-11-20 |
| Stephens & Co. | Maintain | Overweight | 2025-11-20 |
| Mizuho | Maintain | Outperform | 2025-11-20 |
| BTIG | Maintain | Buy | 2025-11-14 |
The grading pattern for Block, Inc. is predominantly positive with multiple buy and outperform ratings, though one recent underweight rating suggests some caution.
Which company has the best grades?
Palo Alto Networks, Inc. and Block, Inc. both hold a consensus “Buy” rating supported by numerous buy and outperform grades. Palo Alto Networks shows a slightly more consistent overweight and buy trend with fewer lower ratings, whereas Block, Inc. has a more mixed profile including an underweight rating. These differences may influence investor perceptions of risk and potential return.
Strengths and Weaknesses
The table below compares key strengths and weaknesses of Palo Alto Networks, Inc. (PANW) and Block, Inc. (XYZ) based on their latest financial and operational data.
| Criterion | Palo Alto Networks, Inc. (PANW) | Block, Inc. (XYZ) |
|---|---|---|
| Diversification | Moderate: Focused on cybersecurity products, subscriptions, and support | High: Diverse revenue streams including software, cryptocurrency assets, hardware, and transactions |
| Profitability | Moderate: Net margin 12.3%, ROIC 5.67% (slightly unfavorable moat) | Moderate: Net margin 12.01%, ROIC 3.03% (slightly unfavorable moat) |
| Innovation | Strong product and subscription growth, fixed asset turnover favorable | Strong innovation in crypto and software, growing ROIC trend but still value-destructive |
| Global presence | Solid global footprint in cybersecurity | Extensive global presence with broad fintech and crypto activities |
| Market Share | Leading in cybersecurity niche with growing subscription revenues | Significant in fintech and crypto sectors, growing transaction volumes |
In summary, both companies show growing profitability trends but are currently shedding value relative to their capital costs. Palo Alto Networks exhibits strength in cybersecurity specialization and operational efficiency, while Block offers greater diversification and innovation in fintech and cryptocurrency markets. Investors should weigh sector risks and company strategies carefully.
Risk Analysis
Below is a comparative risk assessment table for Palo Alto Networks, Inc. (PANW) and Block, Inc. (XYZ) based on the most recent data from 2025 and 2024.
| Metric | Palo Alto Networks, Inc. (PANW) | Block, Inc. (XYZ) |
|---|---|---|
| Market Risk | Beta 0.75 (moderate volatility) | Beta 2.67 (high volatility) |
| Debt level | Very low debt-to-equity (0.04), low debt-to-assets (1.43%) | Moderate debt-to-equity (0.37), debt-to-assets 21.53% |
| Regulatory Risk | Moderate, cybersecurity industry subject to evolving standards | Moderate, financial tech subject to regulatory scrutiny |
| Operational Risk | Moderate, reliant on software infrastructure and cloud security | Moderate, hardware and software integration complexity |
| Environmental Risk | Low, technology sector with limited direct impact | Low, primarily digital and hardware products |
| Geopolitical Risk | Moderate, global sales expose to trade tensions | Moderate, international operations in multiple countries |
In synthesis, Block, Inc. faces higher market risk given its elevated beta, indicating greater price volatility. Palo Alto Networks benefits from a very strong balance sheet with minimal debt, reducing financial risk considerably. Regulatory risks remain relevant for both, especially as cybersecurity and fintech sectors face evolving compliance demands. Operational risks are moderate but manageable. Investors should weigh Block’s higher volatility against Palo Alto’s premium valuation and debt conservatism.
Which Stock to Choose?
Palo Alto Networks, Inc. (PANW) shows strong income growth over 2021-2025 with a favorable gross margin of 73.41% and an improving EBIT margin at 17.32%. Financial ratios reveal a slightly favorable profile, including a low debt-to-equity ratio (0.04) and excellent interest coverage, though valuation multiples like P/E (101.43) are unfavorable. The company carries minimal debt and holds a very favorable rating overall.
Block, Inc. (XYZ) exhibits solid revenue growth with a 36.85% gross margin and neutral EBIT margin of 6.99% in 2024. Its financial ratios are slightly more favorable overall, with strong liquidity demonstrated by a current ratio above 2.3 and moderate debt levels (D/E 0.37). Despite a bearish recent stock trend, its rating is very favorable, supported by moderate valuation multiples and stable profitability.
For investors prioritizing growth and strong income statement performance, PANW might appear more attractive due to its higher profitability and efficient capital use despite some valuation concerns. Conversely, investors favoring financial stability and liquidity may find XYZ’s more balanced ratios and moderate valuation preferable. Both companies show slightly unfavorable economic moats but with growing profitability, suggesting different profiles could weigh these factors distinctly.
Disclaimer: Investment carries a risk of loss of initial capital. The past performance is not a reliable indicator of future results. Be sure to understand risks before making an investment decision.
Go Further
I encourage you to read the complete analyses of Palo Alto Networks, Inc. and Block, Inc. to enhance your investment decisions: