Home > Comparison > Technology > PLTR vs XYZ
The strategic rivalry between Palantir Technologies Inc. and Block, Inc. shapes the evolving landscape of technology infrastructure. Palantir operates as a specialized software platform provider focused on data integration and intelligence analysis. In contrast, Block leads with a diversified payments ecosystem combining hardware and financial services. This analysis dissects their divergent models to identify which presents a superior risk-adjusted opportunity for a balanced, technology-focused portfolio.
Table of contents
Companies Overview
Palantir Technologies and Block, Inc. stand as key players shaping the software infrastructure landscape in 2026.
Palantir Technologies Inc.: Advanced Data Integration Powerhouse
Palantir dominates the software infrastructure sector by providing data integration platforms like Gotham and Foundry. Its revenue stems from contracts with governments and enterprises leveraging AI to analyze complex data. In 2026, Palantir focuses on expanding its AI platform and scaling software deployment across diverse environments, reinforcing its edge in data-driven decision-making.
Block, Inc.: Comprehensive Payment Ecosystem Leader
Block leads with a broad payment processing and commerce software ecosystem. It generates revenue through hardware sales, subscription software, and transaction fees, serving merchants globally. In 2026, Block prioritizes enhancing its Cash App ecosystem and developer platform, pushing seamless financial services and digital commerce innovation across multiple countries.
Strategic Collision: Similarities & Divergences
Both companies innovate in software infrastructure, but Palantir emphasizes data intelligence for operational insight, while Block focuses on financial transactions and commerce solutions. Their primary battleground lies in enterprise adoption of integrated platforms. Palantir offers a highly specialized, AI-driven data moat; Block delivers a diversified fintech ecosystem. These differences define distinct risk and growth profiles for investors.
Income Statement Comparison
This table dissects the core profitability and scalability of both corporate engines to reveal who dominates the bottom line:
| Metric | Palantir Technologies Inc. (PLTR) | Block, Inc. (XYZ) |
|---|---|---|
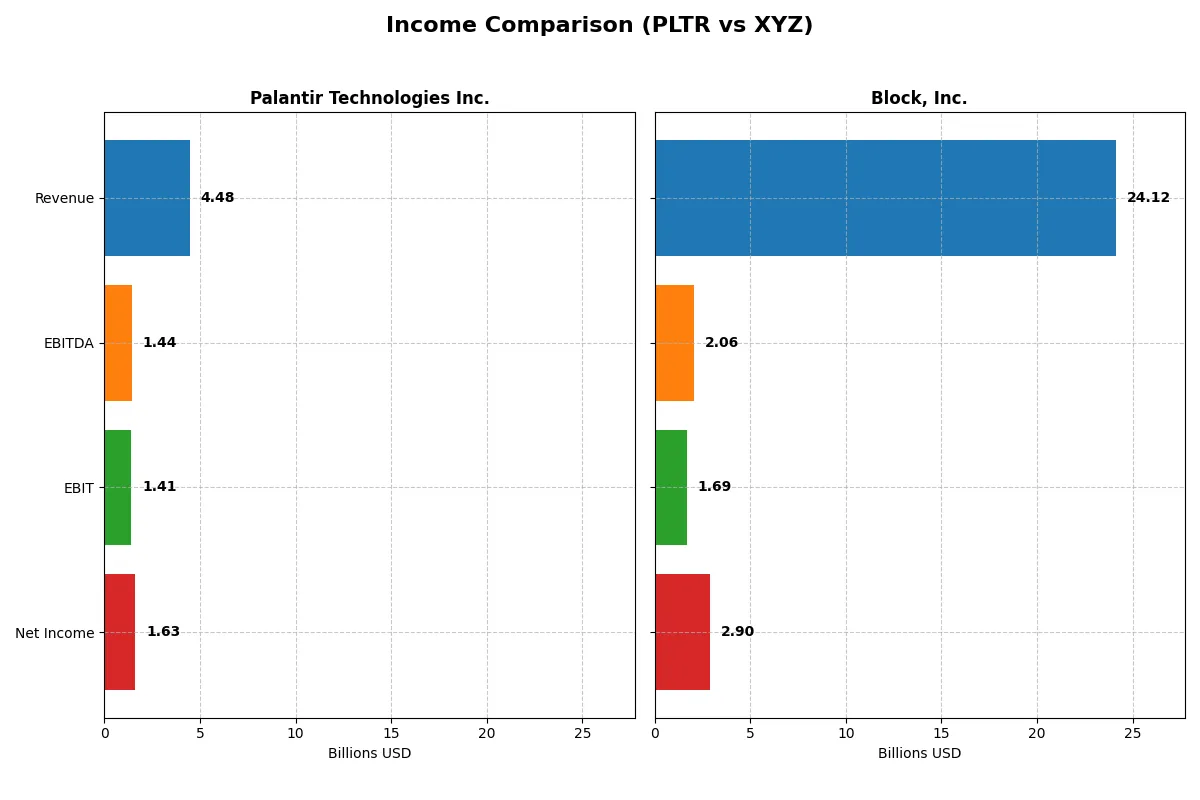
| Revenue | 4.48B | 24.12B |
| Cost of Revenue | 789M | 15.23B |
| Operating Expenses | 2.27B | 7.99B |
| Gross Profit | 3.69B | 8.89B |
| EBITDA | 1.44B | 2.06B |
| EBIT | 1.41B | 1.69B |
| Interest Expense | 0 | 9.30M |
| Net Income | 1.63B | 2.90B |
| EPS | 0.69 | 4.70 |
| Fiscal Year | 2025 | 2024 |
Income Statement Analysis: The Bottom-Line Duel
This income statement comparison reveals which company converts revenue into profit more efficiently, highlighting operational strength and margin resilience.
Palantir Technologies Inc. Analysis
Palantir shows rapid revenue growth, hitting $4.48B in 2025, up 56% from 2024. Net income surged to $1.63B, reflecting a robust 36.3% net margin. Its gross margin remains excellent at 82.4%, signaling strong cost control. The 2025 leap in EBIT and net margin confirms accelerating efficiency and profitability momentum.
Block, Inc. Analysis
Block’s revenue reached $24.12B in 2024, growing 10% year-over-year. Net income soared to $2.90B, delivering a 12.0% net margin on a lower gross margin of 36.9%. EBIT margin stands modest at 7.0%. Despite slower top-line growth, Block’s explosive net margin and EPS growth reveal a sharp turnaround in bottom-line performance.
Margin Dominance vs. Revenue Magnitude
Palantir dominates on margin strength with superior gross and net margins, showcasing operational efficiency. Block wins on scale and bottom-line growth, leveraging a vast revenue base to expand profits sharply. Investors seeking high margin and rapid margin expansion may prefer Palantir. Those favoring large-scale profit growth might lean toward Block.
Financial Ratios Comparison
These vital ratios act as a diagnostic tool to expose the underlying fiscal health, valuation premiums, and capital efficiency of the companies analyzed:
| Ratios | Palantir Technologies Inc. (PLTR) | Block, Inc. (XYZ) |
|---|---|---|
| ROE | 22.0% | 13.6% |
| ROIC | 17.9% | 3.0% |
| P/E | 259.2 | 18.1 |
| P/B | 57.0 | 2.5 |
| Current Ratio | 7.1 | 2.3 |
| Quick Ratio | 7.1 | 2.3 |
| D/E | 0.03 | 0.37 |
| Debt-to-Assets | 2.6% | 21.5% |
| Interest Coverage | 0 (no data) | 95.9 |
| Asset Turnover | 0.50 | 0.66 |
| Fixed Asset Turnover | 17.8 | 45.1 |
| Payout ratio | 0 | 0 |
| Dividend yield | 0 | 0 |
| Fiscal Year | 2025 | 2024 |
Efficiency & Valuation Duel: The Vital Signs
Ratios serve as a company’s DNA, exposing hidden risks and operational strengths that shape investment decisions.
Palantir Technologies Inc.
Palantir posts a strong 22% ROE and a robust 36.3% net margin, signaling operational efficiency. However, its P/E ratio stands at 259, marking the stock as significantly expensive. Palantir returns no dividends, instead channeling capital into R&D and growth, reflecting a long-term innovation focus despite stretched valuation metrics.
Block, Inc.
Block delivers a moderate 13.6% ROE and a 12% net margin, showing stable profitability but less efficiency than Palantir. Its P/E at 18.1 suggests a fair valuation relative to earnings. Block also lacks dividends, prioritizing reinvestment in operations and product development, balancing growth ambitions with more reasonable price multiples.
Premium Valuation vs. Operational Safety
Palantir offers superior profitability but at an extremely high valuation, implying higher risk for reward. Block trades more reasonably, with solid but less dynamic returns. Growth-oriented investors may prefer Palantir’s innovation edge, while risk-conscious ones might favor Block’s balanced profile.
Which one offers the Superior Shareholder Reward?
Palantir Technologies Inc. (PLTR) pays no dividends but generates strong free cash flow (0.89/share in 2025) with zero payout ratio, signaling full reinvestment in growth. Block, Inc. (XYZ) also pays no dividends but has modest free cash flow (2.52/share in 2024) and a lower payout ratio, reflecting a cautious distribution stance. Buybacks are silent for both, making reinvestment the main driver. PLTR’s high margins and cash coverage ratios suggest more sustainable long-term value creation. I find Palantir’s aggressive reinvestment and robust cash flow more likely to yield superior total returns in 2026.
Comparative Score Analysis: The Strategic Profile
The radar chart reveals the fundamental DNA and trade-offs of Palantir Technologies Inc. and Block, Inc., highlighting their financial strengths and valuation contrasts:
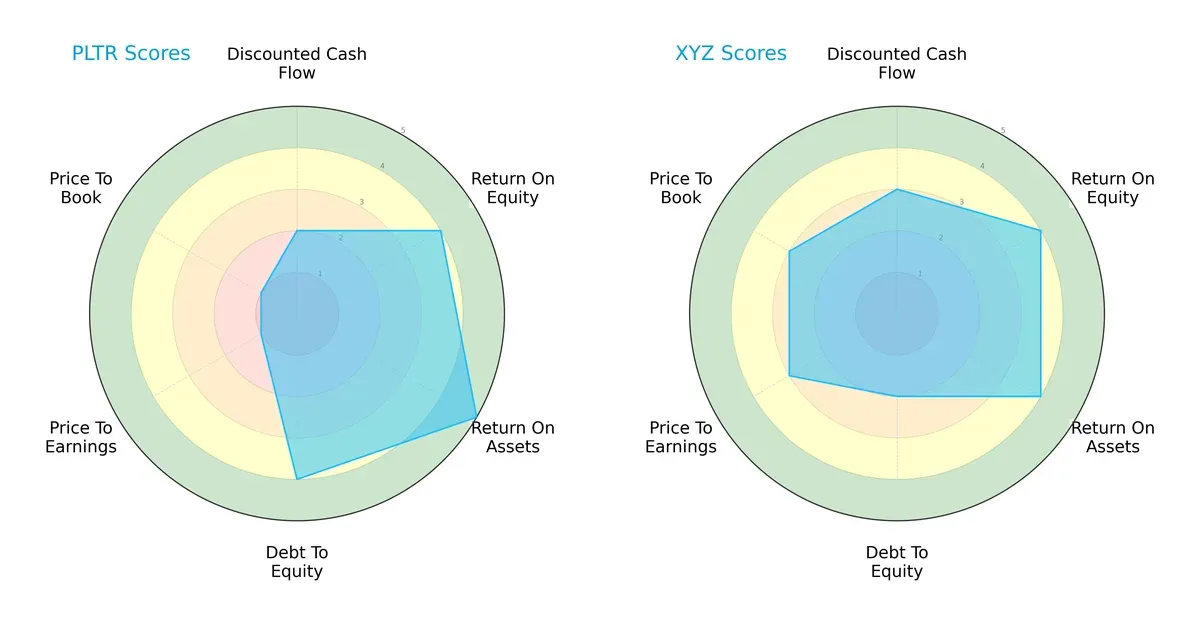
Palantir excels in asset efficiency (ROA 5 vs. 4) and maintains stronger leverage control (Debt/Equity 4 vs. 2). Block shows a more balanced valuation profile with moderate P/E and P/B scores (3 vs. 1), while Palantir’s valuation metrics appear stretched. Both firms share similar ROE scores (4), but Block edges slightly higher on discounted cash flow (3 vs. 2). Palantir relies on operational efficiency and tight debt management, whereas Block offers a steadier valuation and cash flow outlook.
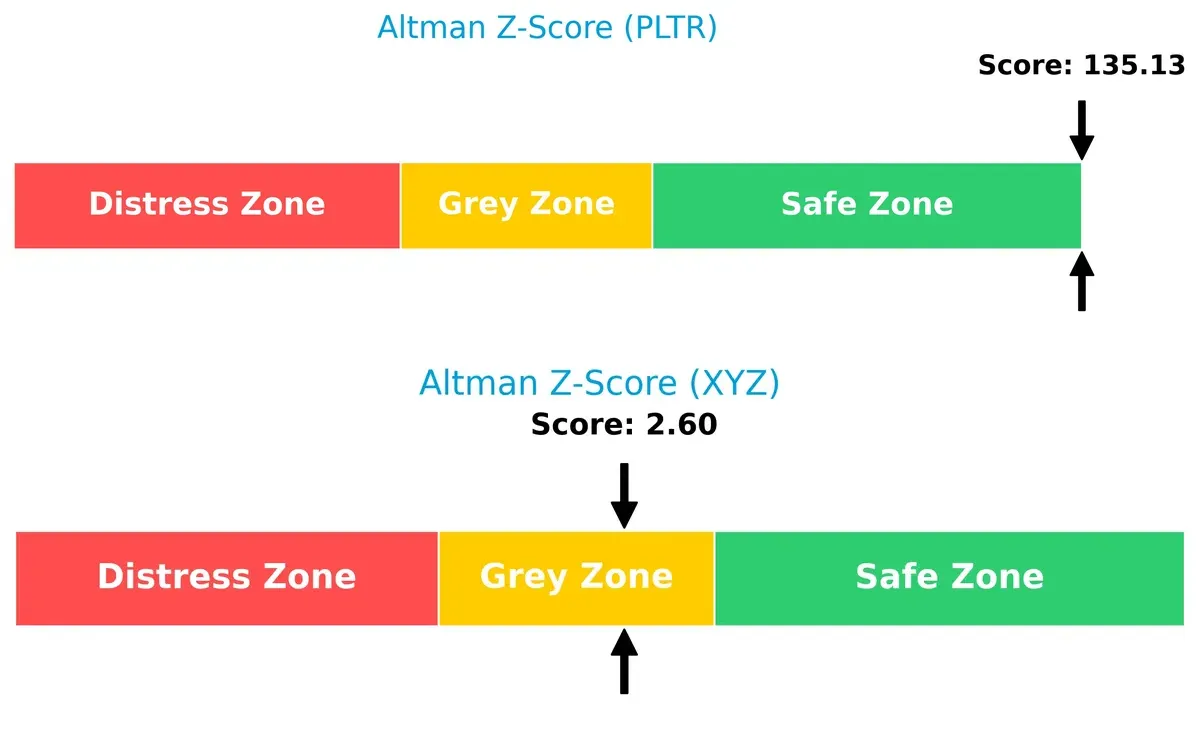
Bankruptcy Risk: Solvency Showdown
Palantir’s Altman Z-Score of 135 places it well within the safe zone, signaling robust long-term solvency. Block’s score of 2.6 falls into the grey zone, implying moderate financial distress risk in this cycle:
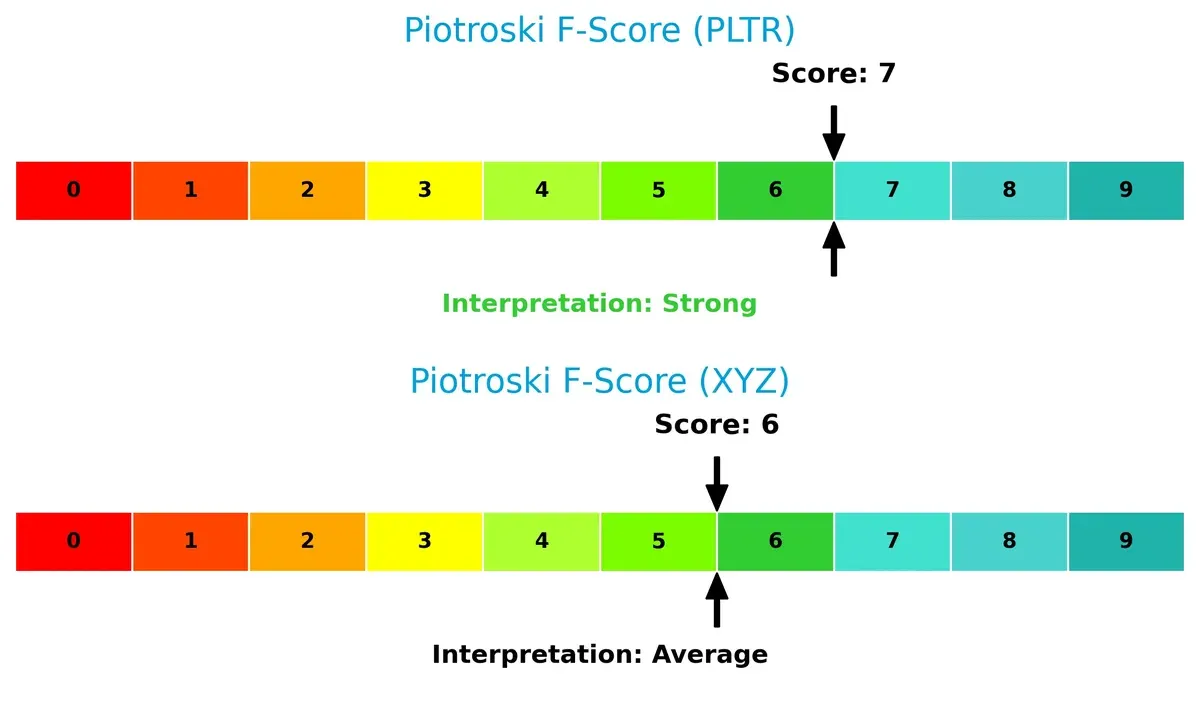
Financial Health: Quality of Operations
Palantir’s Piotroski F-Score of 7 indicates strong financial health with sound internal operations. Block’s score of 6, while decent, flags slightly weaker fundamentals relative to Palantir:
How are the two companies positioned?
This section dissects the operational DNA of Palantir and Block by comparing their revenue distribution and internal dynamics. The goal is to confront their economic moats and identify which model offers the most resilient competitive advantage today.
Revenue Segmentation: The Strategic Mix
This comparison dissects how Palantir Technologies and Block, Inc. diversify income streams and where their primary sector bets lie:
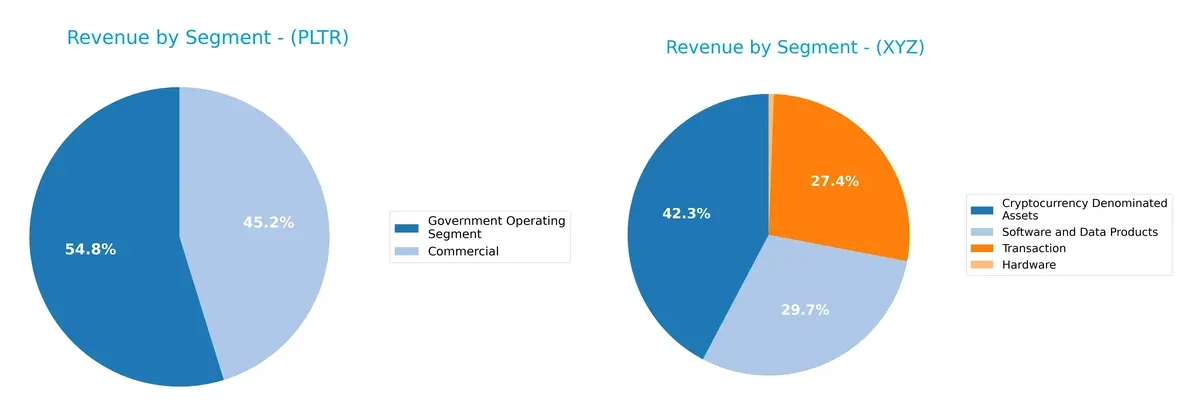
Palantir anchors revenue in two segments: Government Operating at $1.57B and Commercial at $1.30B in 2024, showing a balanced but concentrated portfolio. Block dwarfs Palantir with a more diversified spread: Cryptocurrency Assets lead at $10.2B, followed by Software at $7.2B, and Transactions at $6.6B. This diversification signals Block’s ecosystem lock-in, while Palantir’s focus on government contracts implies concentration risk but stronger infrastructure dominance.
Strengths and Weaknesses Comparison
This table compares the Strengths and Weaknesses of Palantir Technologies Inc. (PLTR) and Block, Inc. (XYZ):
PLTR Strengths
- High net margin at 36.31%
- Strong ROE of 22.0%
- ROIC well above WACC at 17.95% vs 11.79%
- Low debt-to-assets ratio at 2.58%
- Significant growth in commercial and government segments
- Diversified revenue across US, UK, and Rest of World
XYZ Strengths
- Favorable net margin at 12.01%
- Solid current and quick ratios above 2.3
- Strong interest coverage at 181x
- Diversified product lines including software, hardware, and crypto assets
- Large US market presence with $22.3B revenue
- High fixed asset turnover at 45.14
PLTR Weaknesses
- Extremely high PE and PB ratios indicating possible overvaluation
- Unfavorable current ratio despite strong quick ratio
- WACC exceeds optimal level
- Zero dividend yield
- Moderate asset turnover at 0.5
XYZ Weaknesses
- ROIC below WACC at 3.03% vs 14.05%
- Lower ROE at 13.62% with neutral status
- Neutral PE and PB ratios may limit growth appeal
- Zero dividend yield
- Higher debt-to-assets ratio at 21.5%
Palantir’s strengths lie in profitability and low leverage, but high valuation multiples raise caution. Block shows diversified revenues and solid liquidity but faces challenges in capital efficiency and leverage. Both companies must balance growth with prudent capital management.
The Moat Duel: Analyzing Competitive Defensibility
A structural moat is the sole shield protecting long-term profits from relentless competition erosion. Here’s how two tech firms stack up:
Palantir Technologies Inc.: Data-Driven Network Effects
Palantir’s moat stems from powerful network effects and proprietary data integration. It sustains high ROIC (6.2% above WACC) and margin stability above 30%. Its expanding AI platform promises deeper defensibility in 2026.
Block, Inc.: Ecosystem Lock-in via Payment Solutions
Block’s competitive edge lies in its integrated payment ecosystem and hardware-software synergy. Despite a positive ROIC trend, it currently destroys value versus WACC, signaling weaker moat depth than Palantir. Expansion into new markets may improve resilience.
Verdict: Network Effects vs. Ecosystem Lock-in
Palantir’s wider moat, backed by strong value creation and rising profitability, outmatches Block’s slightly unfavorable ROIC position. Palantir is better equipped to defend and expand its market share in evolving tech landscapes.
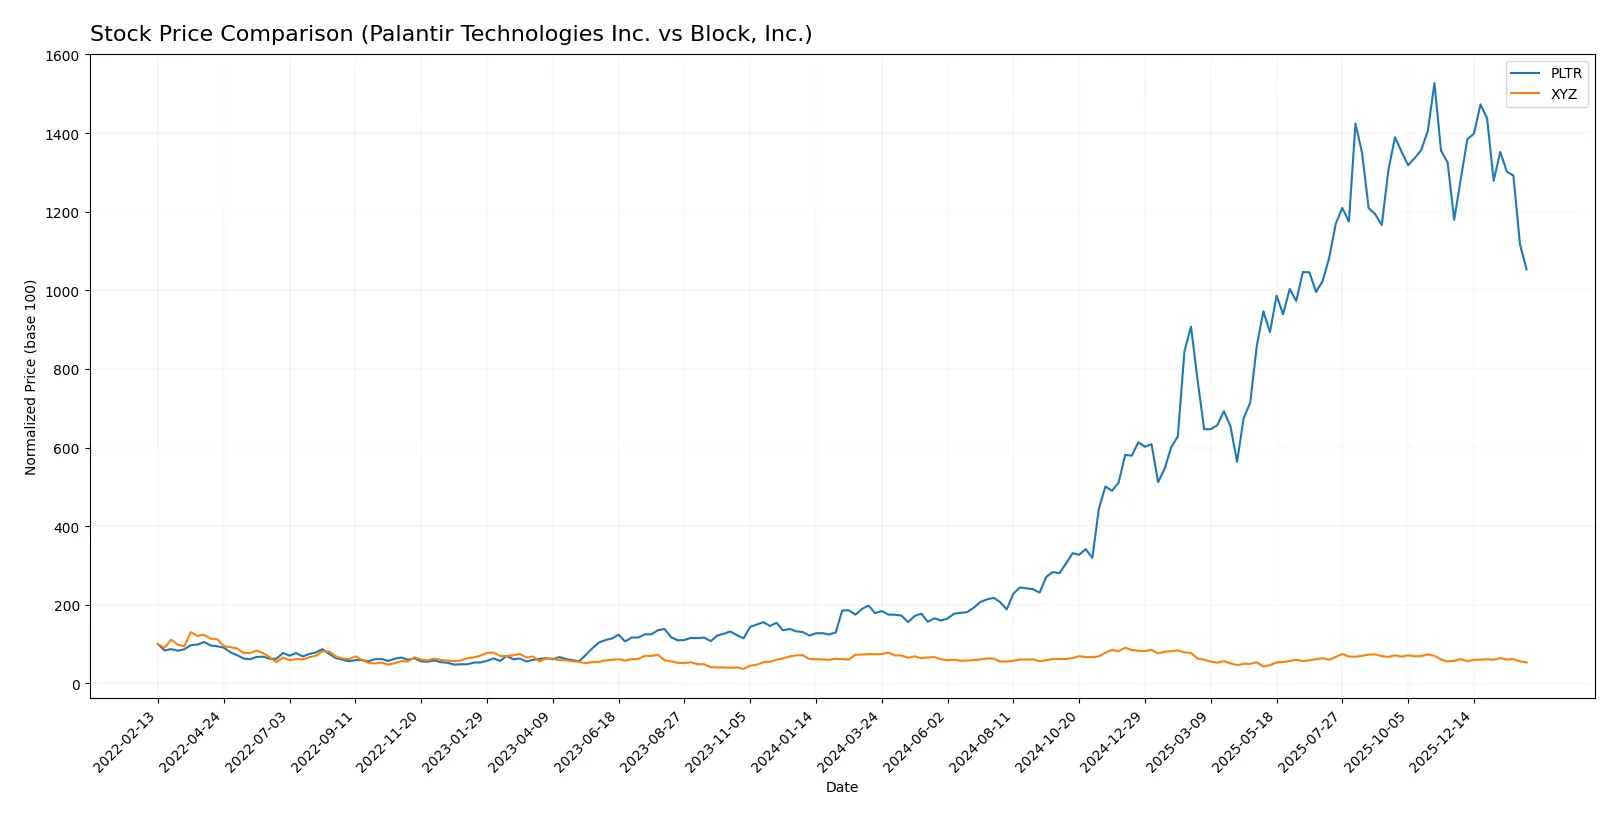
Which stock offers better returns?
The past year reveals stark contrasts: Palantir surged dramatically before recent pullbacks, while Block steadily declined with mild deceleration in losses.
Trend Comparison
Palantir Technologies posted a 489% price increase over 12 months, marking a strong bullish trend despite recent deceleration and a 10.7% drop in the last quarter.
Block, Inc. experienced a 28% decline over the same period, continuing a bearish trend with decelerating losses and a 6.8% drop in the recent quarter.
Palantir’s stock significantly outperformed Block’s, delivering the highest total market gains in the 12-month window analyzed.
Target Prices
Analysts show a bullish consensus for both Palantir Technologies Inc. and Block, Inc., indicating potential upside from current prices.
| Company | Target Low | Target High | Consensus |
|---|---|---|---|
| Palantir Technologies Inc. | 180 | 230 | 198.8 |
| Block, Inc. | 65 | 100 | 84 |
Palantir’s target consensus of $198.8 suggests a 44% upside versus its current $138.38 price. Block’s $84 target implies a 46% gain above its $57.67 share price.

Don’t Let Luck Decide Your Entry Point
Optimize your entry points with our advanced ProRealTime indicators. You’ll get efficient buy signals with precise price targets for maximum performance. Start outperforming now!
How do institutions grade them?
The following tables summarize recent institutional grades for Palantir Technologies Inc. and Block, Inc.:
Palantir Technologies Inc. Grades
This table shows recent grade actions from leading financial institutions for Palantir.
| Grading Company | Action | New Grade | Date |
|---|---|---|---|
| Citigroup | Maintain | Buy | 2026-02-03 |
| UBS | Maintain | Neutral | 2026-02-03 |
| DA Davidson | Maintain | Neutral | 2026-02-03 |
| Citigroup | Upgrade | Buy | 2026-01-12 |
| Morgan Stanley | Maintain | Equal Weight | 2025-11-04 |
| Piper Sandler | Maintain | Overweight | 2025-11-04 |
| Goldman Sachs | Maintain | Neutral | 2025-11-04 |
| Baird | Maintain | Neutral | 2025-11-04 |
| B of A Securities | Maintain | Buy | 2025-11-04 |
| UBS | Maintain | Neutral | 2025-11-04 |
Block, Inc. Grades
This table displays the latest institutional ratings and actions for Block, Inc.
| Grading Company | Action | New Grade | Date |
|---|---|---|---|
| Piper Sandler | Maintain | Underweight | 2026-01-14 |
| Keefe, Bruyette & Woods | Maintain | Outperform | 2026-01-02 |
| Needham | Maintain | Buy | 2025-11-24 |
| B of A Securities | Maintain | Buy | 2025-11-21 |
| Morgan Stanley | Maintain | Equal Weight | 2025-11-21 |
| BTIG | Maintain | Buy | 2025-11-20 |
| Mizuho | Maintain | Outperform | 2025-11-20 |
| Stephens & Co. | Maintain | Overweight | 2025-11-20 |
| RBC Capital | Maintain | Outperform | 2025-11-20 |
| BTIG | Maintain | Buy | 2025-11-14 |
Which company has the best grades?
Block, Inc. has more consistent buy and outperform ratings than Palantir, which shows mixed neutral and buy grades. This difference may influence investors seeking stronger analyst conviction.
Risks specific to each company
The following categories identify the critical pressure points and systemic threats facing both firms in the 2026 market environment:
1. Market & Competition
Palantir Technologies Inc.
- Operates in a niche intelligence software sector with high entry barriers but faces increasing competition from cloud and AI firms.
Block, Inc.
- Competes in a crowded payments and fintech space with rapid innovation cycles and pressure from both startups and incumbents.
2. Capital Structure & Debt
Palantir Technologies Inc.
- Extremely low debt (D/E 0.03) reduces financial risk and interest burden, supporting stable capital allocation.
Block, Inc.
- Moderate leverage (D/E 0.37) is manageable but increases vulnerability to rate hikes and credit tightening.
3. Stock Volatility
Palantir Technologies Inc.
- Beta at 1.69 signals above-market volatility, driven by high valuation multiples and tech sector sensitivity.
Block, Inc.
- Beta at 2.67 shows very high volatility, reflecting fintech cyclicality and investor sentiment swings.
4. Regulatory & Legal
Palantir Technologies Inc.
- Faces stringent government data privacy and export controls, which could restrict international expansion.
Block, Inc.
- Subject to increasing global financial regulations and compliance costs, especially across multiple jurisdictions.
5. Supply Chain & Operations
Palantir Technologies Inc.
- Software-based model limits supply chain risks but depends heavily on sustained government contracts.
Block, Inc.
- Hardware components expose Block to supply chain disruptions and cost inflation pressures.
6. ESG & Climate Transition
Palantir Technologies Inc.
- Limited direct environmental impact but must manage social governance related to data ethics and privacy.
Block, Inc.
- Increasing focus on sustainable operations and corporate governance amid investor pressure.
7. Geopolitical Exposure
Palantir Technologies Inc.
- Significant exposure to US and allied governments; geopolitical tensions could disrupt contracts.
Block, Inc.
- Operates globally with exposure to currency risks and geopolitical instability in multiple markets.
Which company shows a better risk-adjusted profile?
Palantir’s key risk is geopolitical exposure given its reliance on sensitive government contracts. Block faces its largest risk in market volatility amplified by competitive fintech pressures. Despite Palantir’s high valuation multiples, its strong balance sheet and safer Altman Z-score suggest a more resilient risk-adjusted profile than Block, whose higher beta and grey-zone financial scores warrant caution. Palantir’s Altman Z-score above 135 starkly contrasts with Block’s 2.6, highlighting Palantir’s superior financial stability amid 2026 uncertainties.
Final Verdict: Which stock to choose?
Palantir Technologies excels as a cash-generating powerhouse with a robust, growing moat reflected in its superior ROIC versus WACC. Its aggressive reinvestment strategy fuels rapid profitability, but its sky-high valuation and current ratio warrant caution. This stock suits portfolios targeting aggressive growth with tolerance for valuation risk.
Block, Inc. offers a strategic moat rooted in steady recurring revenue and a more balanced financial profile. While its ROIC trails its cost of capital, the company demonstrates improving profitability and stronger financial stability than Palantir. It fits well with investors seeking growth at a reasonable price and moderate risk exposure.
If you prioritize aggressive growth driven by strong capital efficiency and expanding margins, Palantir outshines with its value creation and momentum. However, if you seek more stability and a proven recurring revenue moat, Block offers better downside protection and a more moderate valuation. Each reflects distinct investor profiles with differing risk appetites.
Disclaimer: Investment carries a risk of loss of initial capital. The past performance is not a reliable indicator of future results. Be sure to understand risks before making an investment decision.
Go Further
I encourage you to read the complete analyses of Palantir Technologies Inc. and Block, Inc. to enhance your investment decisions: