In the rapidly evolving software infrastructure sector, Oracle Corporation and Block, Inc. stand out as influential players shaping the future of enterprise technology. Oracle, a long-established giant, offers comprehensive cloud and database solutions, while Block focuses on innovative payment and commerce platforms. Their overlapping market presence and distinct innovation strategies make this comparison essential for discerning investors. Join me as we analyze which company presents the most compelling investment opportunity in 2026.

Table of contents
Companies Overview
I will begin the comparison between Oracle Corporation and Block, Inc. by providing an overview of these two companies and their main differences.
Oracle Corporation Overview
Oracle Corporation focuses on enterprise information technology, offering cloud software applications like ERP, performance management, and supply chain solutions. It also provides infrastructure technologies including databases, middleware, and hardware products. With a market cap of $549B and 159K employees, Oracle serves various industries, government, and education sectors globally from its headquarters in Austin, Texas.
Block, Inc. Overview
Block, Inc. develops tools enabling sellers to accept card payments and provides related hardware and software solutions. Its product portfolio includes payment terminals, point-of-sale software, Cash App, and website hosting services. Based in Oakland, California, Block operates in multiple countries, employs 12K people, and has a market cap of $40B, focusing on payment infrastructure and financial technology.
Key similarities and differences
Both Oracle and Block operate in the technology sector with a focus on software infrastructure, yet their business models diverge. Oracle emphasizes enterprise cloud applications and infrastructure technologies, while Block concentrates on payment processing hardware, software, and financial services. Oracle’s scale and employee base are substantially larger, reflecting its broad industry reach compared to Block’s more specialized fintech approach.
Income Statement Comparison
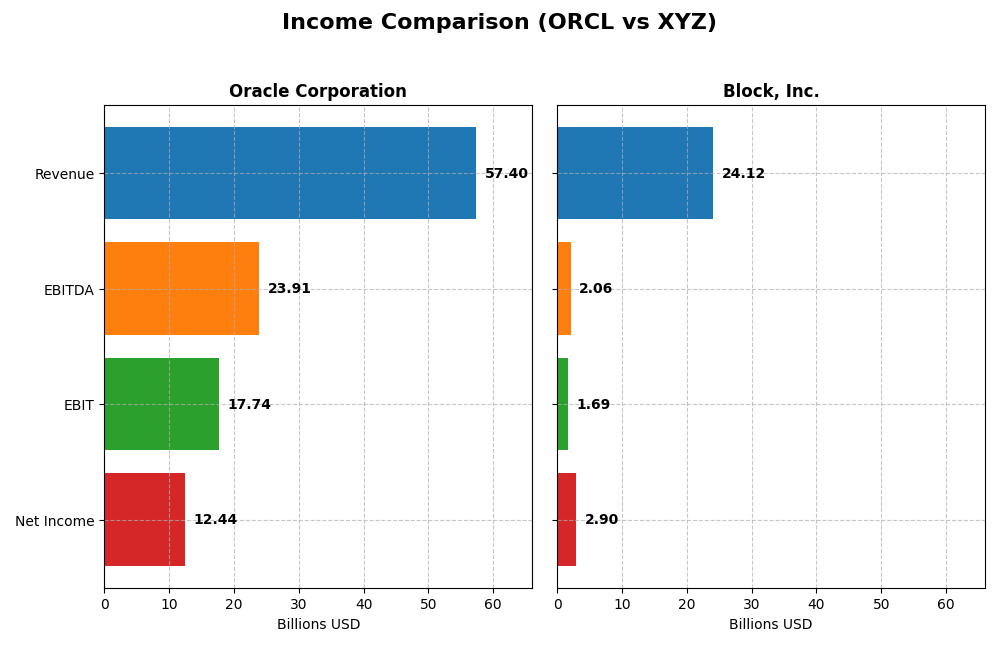
The table below compares the latest full fiscal year income statement metrics of Oracle Corporation and Block, Inc., providing a snapshot of their financial performance.
| Metric | Oracle Corporation | Block, Inc. |
|---|---|---|
| Market Cap | 549B | 40B |
| Revenue | 57.4B | 24.1B |
| EBITDA | 23.9B | 2.1B |
| EBIT | 17.7B | 1.7B |
| Net Income | 12.4B | 2.9B |
| EPS | 4.46 | 4.7 |
| Fiscal Year | 2025 | 2024 |
Income Statement Interpretations
Oracle Corporation
Oracle’s revenue grew steadily from $40.5B in 2021 to $57.4B in 2025, reflecting a 41.8% increase overall. Net income saw volatility, peaking at $13.7B in 2021 but declining to $12.4B in 2025. Margins remain strong, with a gross margin of 70.5% and net margin around 21.7%. The latest year showed favorable revenue and EBIT growth with margin improvements.
Block, Inc.
Block’s revenue surged from $9.5B in 2020 to $24.1B in 2024, a 154% overall increase. Net income improved dramatically from a loss of $0.54B in 2022 to nearly $2.9B in 2024. The gross margin is modest at 36.9%, while EBIT margin is low but improving. The recent year saw strong profit and margin growth, despite unfavorable operating expense trends relative to revenue.
Which one has the stronger fundamentals?
Oracle demonstrates stable profitability with high margins and consistent revenue growth, though net income growth was less favorable over the period. Block shows remarkable revenue and net income expansion, with improving margins but lower absolute profitability compared to Oracle. Overall, both present favorable income statements, with Oracle excelling in margin stability and Block in growth momentum.
Financial Ratios Comparison
The table below presents a comparison of key financial ratios for Oracle Corporation and Block, Inc. based on their most recent fiscal year data.
| Ratios | Oracle Corporation (2025) | Block, Inc. (2024) |
|---|---|---|
| ROE | 60.8% | 13.6% |
| ROIC | 10.9% | 3.0% |
| P/E | 37.1 | 18.1 |
| P/B | 22.6 | 2.47 |
| Current Ratio | 0.75 | 2.33 |
| Quick Ratio | 0.75 | 2.31 |
| D/E | 5.09 | 0.37 |
| Debt-to-Assets | 61.8% | 21.5% |
| Interest Coverage | 4.94 | 95.9 |
| Asset Turnover | 0.34 | 0.66 |
| Fixed Asset Turnover | 1.32 | 45.1 |
| Payout ratio | 38.1% | 0% |
| Dividend yield | 1.03% | 0% |
Interpretation of the Ratios
Oracle Corporation
Oracle shows strong profitability ratios, with a favorable net margin of 21.68% and an impressive return on equity of 60.84%. However, liquidity and leverage ratios are weak, including a low current ratio of 0.75 and a high debt-to-equity of 5.09, raising potential solvency concerns. Oracle pays dividends, offering a modest 1.03% yield with stable payouts, supported by free cash flow, though the payout ratio and buybacks warrant monitoring for sustainability.
Block, Inc.
Block exhibits mixed ratios: favorable net margin at 12.01% and strong liquidity with a current ratio of 2.33, but its return on invested capital at 3.03% is weak. The company carries low debt levels, reflected in a debt-to-assets ratio of 21.53%, and excellent interest coverage. Block does not pay dividends, likely due to reinvestment in growth and R&D, focusing on expanding its product offerings and market reach.
Which one has the best ratios?
Block presents a more balanced financial profile with half of its ratios favorable, particularly in liquidity and solvency, despite weaker returns on capital. Oracle’s profitability is superior, but it faces multiple unfavorable ratios in leverage and liquidity. Overall, Block’s slightly favorable ratio mix contrasts with Oracle’s predominantly unfavorable financial metrics, making the comparison nuanced.
Strategic Positioning
This section compares the strategic positioning of Oracle Corporation and Block, Inc., focusing on Market position, Key segments, and Exposure to technological disruption:
Oracle Corporation
- Large market cap of $549B with established presence in enterprise IT; faces competitive pressure in software infrastructure
- Key segments include Cloud and License Business ($49B), Hardware ($2.9B), and Services ($5.2B); diversified IT offerings
- Exposure includes cloud software, databases, blockchain, and IoT technologies, leveraging infrastructure tech
Block, Inc.
- Smaller market cap of $40B, focused on payment solutions and fintech; competitive in digital transaction services
- Key segments are Cryptocurrency Assets ($10B), Software and Data Products ($7.1B), Hardware, and Transactions; fintech-centric
- Exposure is centered on payment hardware, software APIs, and cryptocurrency-related products, adapting fintech innovations
Oracle Corporation vs Block, Inc. Positioning
Oracle’s strategy is diversified across cloud, hardware, and services with strong enterprise IT focus, providing stability but facing declining ROIC. Block concentrates on fintech and crypto, showing growing ROIC but smaller scale and value destruction.
Which has the best competitive advantage?
Both companies have slightly unfavorable moats, with Oracle shedding value amid declining profitability, while Block is improving profitability despite value destruction, indicating neither holds a clear sustainable competitive advantage.
Stock Comparison
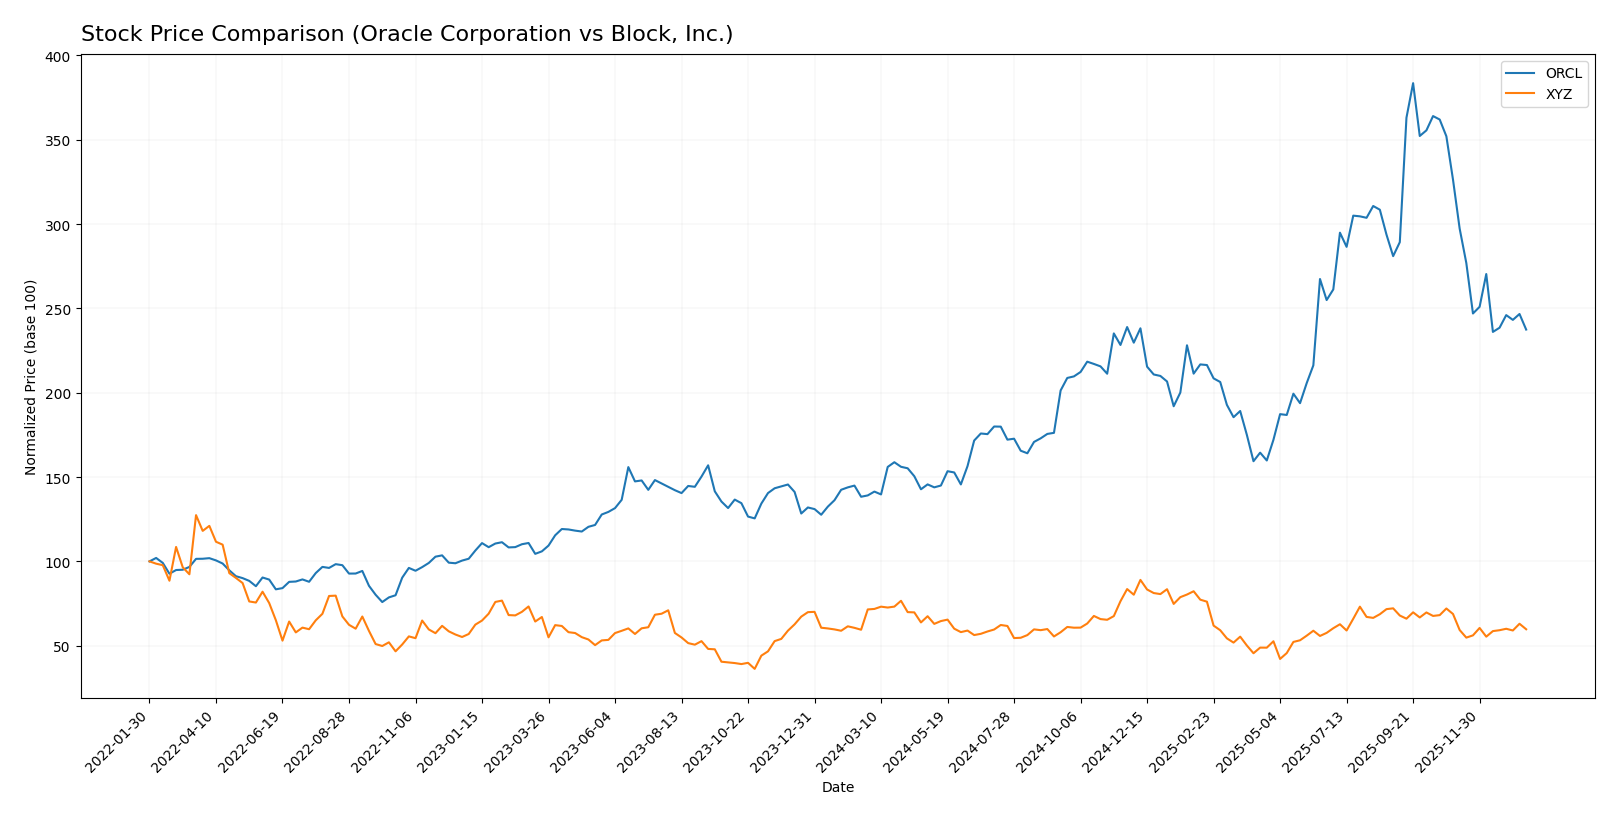
The stock price movements of Oracle Corporation and Block, Inc. over the past 12 months reveal contrasting trends, with Oracle showing strong gains but recent weakness, while Block experiences an overall decline with decelerating momentum.
Trend Analysis
Oracle Corporation’s stock demonstrated a bullish trend over the past year with a 70.69% increase, though the trend shows deceleration and recent weakness with a -27.23% drop between November 2025 and January 2026. Volatility remains high with a 49.0 standard deviation.
Block, Inc. experienced a bearish trend with a -16.43% decline over the past year and decelerating momentum. Recent performance also weakened by -13.16%, with lower volatility at a 10.43 standard deviation.
Comparing the two, Oracle delivered the highest market performance over the past year despite recent pullbacks, while Block’s stock has consistently trended downward with less volatility.
Target Prices
The current analyst consensus for target prices reflects a positive outlook on both Oracle Corporation and Block, Inc.
| Company | Target High | Target Low | Consensus |
|---|---|---|---|
| Oracle Corporation | 400 | 175 | 314.08 |
| Block, Inc. | 100 | 65 | 84.91 |
Analysts expect Oracle’s stock to appreciate significantly above its current price of 191.09 USD, suggesting strong growth potential. Block’s consensus target price is also notably higher than its current 65.95 USD, indicating optimism about its future performance.
Analyst Opinions Comparison
This section compares analysts’ ratings and grades for Oracle Corporation and Block, Inc.:
Rating Comparison
Oracle Corporation Rating
- Rating: B, considered very favorable overall by analysts.
- Discounted Cash Flow Score: Moderate score of 3 indicating fair valuation.
- ROE Score: Very favorable high score of 5, showing strong equity returns.
- ROA Score: Favorable score of 4, indicating good asset utilization.
- Debt To Equity Score: Very unfavorable low score of 1, indicating higher financial risk.
- Overall Score: Moderate score of 3 reflecting balanced financial standing.
Block, Inc. Rating
- Rating: B+, also rated very favorable overall.
- Discounted Cash Flow Score: Same moderate score of 3.
- ROE Score: Favorable score of 4, slightly lower than Oracle.
- ROA Score: Same favorable score of 4 as Oracle.
- Debt To Equity Score: Moderate score of 2, indicating better balance sheet strength.
- Overall Score: Same moderate score of 3 as Oracle.
Which one is the best rated?
Block, Inc. holds a slightly better overall rating (B+) compared to Oracle’s B, with both sharing moderate overall scores. Oracle excels in ROE but has weaker debt management, while Block shows more balanced financial risk scores.
Scores Comparison
Here is a comparison of the Altman Z-Score and Piotroski Score for Oracle Corporation and Block, Inc.:
Oracle Corporation Scores
- Altman Z-Score: 2.43, indicating moderate risk in the grey zone.
- Piotroski Score: 5, reflecting average financial strength.
Block, Inc. Scores
- Altman Z-Score: 2.70, indicating moderate risk in the grey zone.
- Piotroski Score: 6, reflecting average financial strength.
Which company has the best scores?
Block, Inc. has slightly higher Altman Z-Score and Piotroski Score than Oracle, both remaining in the grey and average categories respectively, indicating marginally better financial stability based on these metrics.
Grades Comparison
Here is a comparison of the recent grades assigned to Oracle Corporation and Block, Inc. by reputable financial institutions:
Oracle Corporation Grades
This table summarizes Oracle’s latest grades from well-known grading companies:
| Grading Company | Action | New Grade | Date |
|---|---|---|---|
| UBS | Maintain | Buy | 2026-01-05 |
| RBC Capital | Maintain | Sector Perform | 2026-01-05 |
| Jefferies | Maintain | Buy | 2026-01-05 |
| Goldman Sachs | Maintain | Neutral | 2025-12-12 |
| Keybanc | Maintain | Overweight | 2025-12-11 |
| UBS | Maintain | Buy | 2025-12-11 |
| Citigroup | Maintain | Buy | 2025-12-11 |
| JP Morgan | Maintain | Neutral | 2025-12-11 |
| DA Davidson | Maintain | Neutral | 2025-12-11 |
| Scotiabank | Maintain | Sector Outperform | 2025-12-11 |
Oracle’s ratings predominantly feature “Buy” or equivalent positive assessments, with several neutral and sector-based ratings, indicating stable confidence in its performance.
Block, Inc. Grades
This table summarizes Block’s latest grades from reputable grading companies:
| Grading Company | Action | New Grade | Date |
|---|---|---|---|
| Piper Sandler | Maintain | Underweight | 2026-01-14 |
| Keefe, Bruyette & Woods | Maintain | Outperform | 2026-01-02 |
| Needham | Maintain | Buy | 2025-11-24 |
| B of A Securities | Maintain | Buy | 2025-11-21 |
| Morgan Stanley | Maintain | Equal Weight | 2025-11-21 |
| BTIG | Maintain | Buy | 2025-11-20 |
| RBC Capital | Maintain | Outperform | 2025-11-20 |
| Stephens & Co. | Maintain | Overweight | 2025-11-20 |
| Mizuho | Maintain | Outperform | 2025-11-20 |
| BTIG | Maintain | Buy | 2025-11-14 |
Block’s ratings exhibit a mix of “Buy,” “Outperform,” and some neutral or cautious views such as “Underweight” and “Equal Weight,” reflecting a more varied outlook.
Which company has the best grades?
Oracle has received a stronger and more consistent set of positive grades, mostly “Buy” and sector outperform ratings, compared to Block’s more mixed evaluations. This difference may influence investors’ perception of stability and growth potential.
Strengths and Weaknesses
Below is a comparison table highlighting key strengths and weaknesses of Oracle Corporation and Block, Inc. based on the most recent financial and operational data.
| Criterion | Oracle Corporation (ORCL) | Block, Inc. (XYZ) |
|---|---|---|
| Diversification | Strong with Cloud & License (49.2B), Services (5.2B), and Hardware (2.9B) revenue streams | Diversified across Software & Data Products (7.2B), Cryptocurrency Assets (10.2B), Transactions (6.6B), and Hardware (0.14B) |
| Profitability | High net margin at 21.7%, ROE 60.8%, ROIC 10.9% | Moderate net margin 12.0%, ROE 13.6%, ROIC 3.0% but improving profitability trend |
| Innovation | Established tech leader, but innovation impact slower; declining ROIC trend (-17.7%) | Rapid innovation in fintech and crypto; ROIC growing +13.7%, signaling improving efficiency |
| Global presence | Extensive global footprint with mature enterprise clients | Growing global presence focused on digital payments and crypto markets |
| Market Share | Large enterprise software market share but facing margin pressure | Emerging market share in fintech and crypto, gaining traction but smaller scale |
In summary, Oracle offers strong diversification and profitability but faces challenges in sustaining ROIC growth. Block shows promising innovation and improving profitability, though it operates at a smaller scale with higher growth potential but increased risk. Investors should weigh Oracle’s stability against Block’s dynamic growth profile.
Risk Analysis
Below is a comparative table of key risks for Oracle Corporation (ORCL) and Block, Inc. (XYZ) based on the most recent available data.
| Metric | Oracle Corporation (ORCL) | Block, Inc. (XYZ) |
|---|---|---|
| Market Risk | Beta 1.65, moderate volatility | Beta 2.67, high volatility |
| Debt Level | High leverage, debt-to-assets 61.8% | Low leverage, debt-to-assets 21.5% |
| Regulatory Risk | Moderate, tech sector regulations | Moderate, fintech regulations |
| Operational Risk | Large scale, complex operations | Growing operations, tech innovation |
| Environmental Risk | Moderate, some hardware production | Low to moderate, mostly software |
| Geopolitical Risk | US-focused, some global exposure | US and international exposure |
Oracle shows elevated financial leverage and moderate operational complexity, increasing its financial risk, despite a very favorable return on equity. Block, with lower debt and higher liquidity ratios, appears financially stronger but faces higher market volatility. Regulatory risks remain moderate for both due to their sectors. The most impactful risks are Oracle’s high debt levels and Block’s market volatility. Both firms have Altman Z-Scores in the grey zone, indicating moderate bankruptcy risk, requiring cautious monitoring.
Which Stock to Choose?
Oracle Corporation (ORCL) shows favorable income growth with a 41.8% revenue increase over 2021-2025 but declining net income and margin. Its financial ratios reveal strong profitability with a 60.8% ROE but high debt levels and an overall unfavorable ratio profile. The company’s rating is very favorable (B), supported by moderate overall scores but burdened by poor debt and valuation metrics.
Block, Inc. (XYZ) demonstrates robust income expansion, with revenue growth of 154% and substantial net income gains over 2020-2024. Financial ratios are slightly favorable, highlighting solid liquidity and low debt but moderate profitability metrics. Its rating is very favorable (B+), with balanced scores and improving profitability trends despite some valuation neutrality.
For investors, the choice might depend on risk tolerance and strategy: growth-focused investors could find XYZ’s strong income momentum and improving profitability appealing, while those emphasizing established profitability and return on equity might view ORCL’s financial strength favorably despite its leverage risks. Both companies show slight unfavorable MOAT statuses, indicating caution regarding value creation.
Disclaimer: Investment carries a risk of loss of initial capital. The past performance is not a reliable indicator of future results. Be sure to understand risks before making an investment decision.
Go Further
I encourage you to read the complete analyses of Oracle Corporation and Block, Inc. to enhance your investment decisions: