Block, Inc. and Okta, Inc. are two prominent players in the software infrastructure sector, each driving innovation in digital payment solutions and identity management, respectively. Both companies serve a diverse range of clients worldwide, with a strong focus on secure, scalable technology. This comparison aims to highlight their market positions and growth strategies, helping you decide which stock could be the best addition to your investment portfolio. Let’s explore which company stands out for investors today.

Table of contents
Companies Overview
I will begin the comparison between Block, Inc. and Okta, Inc. by providing an overview of these two companies and their main differences.
Block, Inc. Overview
Block, Inc. develops tools enabling sellers to accept card payments, offering hardware like card readers and point-of-sale terminals, as well as software solutions including Square Point of Sale and Cash App. The company serves multiple countries, including the US, Canada, Japan, and several European nations. Founded in 2009 and based in Oakland, California, Block has a market cap of approximately 40B and employs around 12,000 people.
Okta, Inc. Overview
Okta, Inc. provides identity and access management software for enterprises, SMBs, and government agencies worldwide. Its Okta Identity Cloud includes products like Single Sign-On, Multi-Factor Authentication, and API Access Management. Headquartered in San Francisco and founded in 2009, Okta’s market cap is about 15B with nearly 6,000 employees. The company distributes its software through direct sales and channel partners.
Key similarities and differences
Both companies operate in the software infrastructure industry with a focus on technology solutions, but their business models differ. Block primarily targets payment processing and point-of-sale hardware combined with software, while Okta specializes in identity security and access management software. Block has a larger employee base and market capitalization, whereas Okta’s offerings focus on cloud-based security and identity solutions.
Income Statement Comparison
This table compares the most recent fiscal year income statement figures of Block, Inc. and Okta, Inc. to highlight their financial performance side by side.
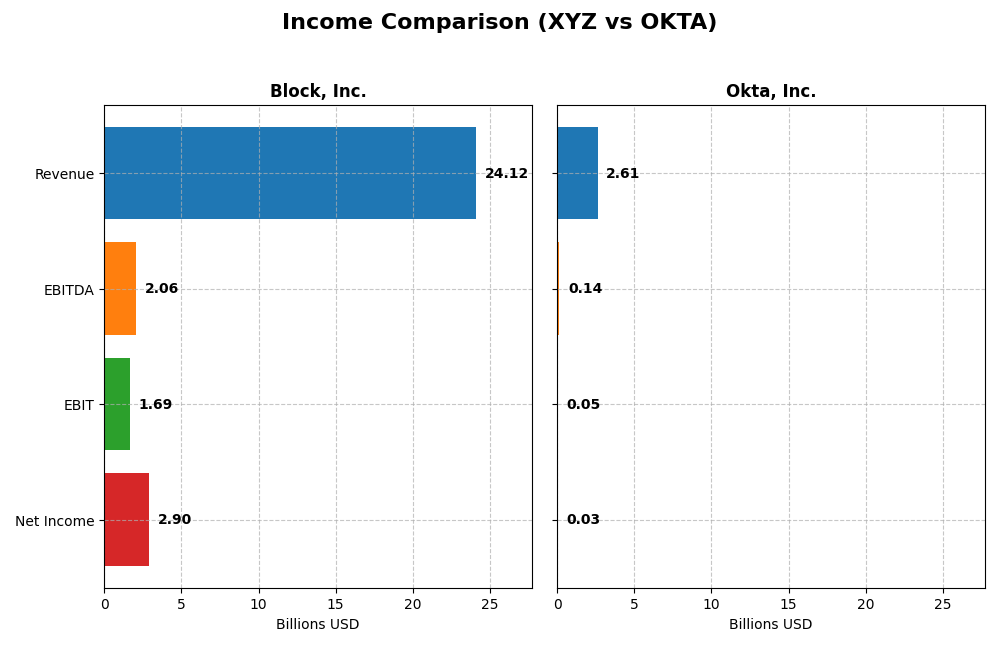
| Metric | Block, Inc. (XYZ) | Okta, Inc. (OKTA) |
|---|---|---|
| Market Cap | 40.2B | 15.2B |
| Revenue | 24.1B | 2.61B |
| EBITDA | 2.06B | 139M |
| EBIT | 1.69B | 51M |
| Net Income | 2.90B | 28M |
| EPS | 4.7 | 0.17 |
| Fiscal Year | 2024 | 2025 |
Income Statement Interpretations
Block, Inc.
Block, Inc. shows strong revenue growth, rising from $9.5B in 2020 to $24.1B in 2024, with net income improving from $213M to $2.9B. The gross margin remains favorable at 36.85%, while EBIT margin is neutral at 6.99%. In 2024, revenue growth accelerated to 10%, supported by a significant net margin increase, reflecting improved profitability despite rising operating expenses.
Okta, Inc.
Okta, Inc. experienced steady revenue growth from $835M in 2021 to $2.61B in 2025, with net income recovering from a $266M loss to a $28M profit. The company maintains a favorable gross margin of 76.32%, with EBIT margin neutral at 1.95%. In 2025, revenue grew 15.3%, and net margin improved over 100%, indicating a positive turnaround in operational efficiency and profitability.
Which one has the stronger fundamentals?
Both companies exhibit favorable income statement trends with strong revenue growth and margin improvements. Block, Inc. features higher absolute revenue and net income with significant margin expansion, while Okta, Inc. demonstrates a robust recovery from losses and superior gross margins. Block’s scale and profitability contrast with Okta’s faster margin improvements, offering different strengths in fundamentals.
Financial Ratios Comparison
Below is a comparison of key financial ratios for Block, Inc. (XYZ) and Okta, Inc. (OKTA) based on the most recent available fiscal year data.
| Ratios | Block, Inc. (XYZ) 2024 | Okta, Inc. (OKTA) 2025 |
|---|---|---|
| ROE | 13.62% | 0.44% |
| ROIC | 3.03% | -0.61% |
| P/E | 18.10 | 570.60 |
| P/B | 2.47 | 2.49 |
| Current Ratio | 2.33 | 1.35 |
| Quick Ratio | 2.31 | 1.35 |
| D/E | 0.37 | 0.15 |
| Debt-to-Assets | 21.53% | 10.09% |
| Interest Coverage | 95.93 | -14.80 |
| Asset Turnover | 0.66 | 0.28 |
| Fixed Asset Turnover | 45.14 | 22.31 |
| Payout ratio | 0 | 0 |
| Dividend yield | 0 | 0 |
Interpretation of the Ratios
Block, Inc.
Block, Inc. shows a balanced profile with half of its ratios favorable, including strong liquidity (current ratio 2.33) and low leverage (debt-to-equity 0.37). However, its return on invested capital (3.03%) and weighted average cost of capital (14.27%) remain unfavorable, indicating challenges in capital efficiency. Block does not pay dividends, likely prioritizing reinvestment and growth opportunities.
Okta, Inc.
Okta, Inc. displays a mixed ratio set with less than half favorable; it benefits from low leverage (debt-to-assets 10.09%) and solid interest coverage (10.2), but profitability metrics like net margin (1.07%) and return on equity (0.44%) are weak. Okta also does not pay dividends, reflecting a focus on reinvestment in R&D and expansion during its growth phase.
Which one has the best ratios?
Block, Inc. exhibits a slightly more favorable overall ratio profile with better liquidity, leverage, and a higher proportion of favorable metrics, despite some weaknesses in capital returns. Okta’s ratios reflect a neutral stance with profitability concerns and fewer favorable indicators. Based purely on ratios, Block appears stronger but both show areas needing attention.
Strategic Positioning
This section compares the strategic positioning of Block, Inc. and Okta, Inc., including market position, key segments, and exposure to technological disruption:
Block, Inc.
- Larger market cap of 40B with higher beta indicating greater volatility and competitive pressure.
- Diverse revenue streams from software, cryptocurrency assets, hardware, and transaction services.
- Exposure includes evolving payment technologies and cryptocurrency markets, with hardware integration.
Okta, Inc.
- Smaller market cap of 15B with lower beta suggesting less market volatility and moderate competitive pressure.
- Concentrated revenue mainly from subscription services with additional technology service offerings.
- Focused on identity and access management cloud solutions, with security and authentication innovations.
Block, Inc. vs Okta, Inc. Positioning
Block presents a diversified business model across payments, software, and cryptocurrency, which may offer resilience but also complexity. Okta’s concentrated focus on identity solutions targets a niche with consistent subscription growth but less product variety.
Which has the best competitive advantage?
Both companies are currently shedding value relative to their cost of capital, despite improving profitability trends. Their economic moats are rated slightly unfavorable, reflecting challenges in sustaining competitive advantages based on current ROIC versus WACC dynamics.
Stock Comparison
The stock price chart over the past 12 months reveals contrasting dynamics between Block, Inc. and Okta, Inc., with Block showing a notable bearish trend and Okta exhibiting a bullish trajectory, each marked by significant price fluctuations and volume behavior.

Trend Analysis
Block, Inc. (XYZ) experienced a bearish trend over the past year with a price decline of -16.43%. The trend showed deceleration, with a high volatility indicated by a standard deviation of 10.43, and a trading range between 46.53 and 98.25.
Okta, Inc. (OKTA) posted a bullish trend with a 7.58% price increase over the same period. The trend accelerated, featuring a higher volatility of 11.38 standard deviation, and price variation between 72.24 and 127.3.
Comparing both stocks, Okta delivered the highest market performance with a positive 7.58% gain, contrasting with Block’s significant -16.43% loss during the last 12 months.
Target Prices
The current analyst consensus reveals optimistic target prices for both Block, Inc. and Okta, Inc.
| Company | Target High | Target Low | Consensus |
|---|---|---|---|
| Block, Inc. | 100 | 65 | 84.91 |
| Okta, Inc. | 140 | 60 | 110.67 |
Analysts expect Block, Inc.’s price to rise from its current 65.95 USD toward an 85 USD consensus, while Okta, Inc.’s consensus target of 110.67 USD significantly exceeds its current 89.55 USD price.
Analyst Opinions Comparison
This section compares analysts’ ratings and grades for Block, Inc. and Okta, Inc.:
Rating Comparison
Block, Inc. Rating
- Rating: B+, categorized as Very Favorable by analysts.
- Discounted Cash Flow Score: Moderate at 3 out of 5.
- ROE Score: Favorable at 4, indicating efficient equity use.
- ROA Score: Favorable at 4, reflecting effective asset use.
- Debt To Equity Score: Moderate at 2, showing balanced risk.
- Overall Score: Moderate at 3, suggesting average financial health.
Okta, Inc. Rating
- Rating: B, also marked Very Favorable by analysts.
- Discounted Cash Flow Score: Favorable at 4 out of 5.
- ROE Score: Moderate at 2, showing less efficiency.
- ROA Score: Moderate at 3, moderately effective asset use.
- Debt To Equity Score: Favorable at 4, indicating lower risk.
- Overall Score: Moderate at 3, reflecting similar financial health.
Which one is the best rated?
Block, Inc. holds a higher rating of B+ compared to Okta’s B, supported by stronger ROE and ROA scores. Okta scores better in discounted cash flow and debt-to-equity metrics, but both have the same overall score.
Scores Comparison
Here is a comparison of the financial health scores for Block, Inc. and Okta, Inc.:
Block, Inc. Scores
- Altman Z-Score: 2.70, in the grey zone indicating moderate bankruptcy risk.
- Piotroski Score: 6, assessed as average financial strength.
Okta, Inc. Scores
- Altman Z-Score: 4.15, in the safe zone indicating low bankruptcy risk.
- Piotroski Score: 8, assessed as very strong financial health.
Which company has the best scores?
Okta, Inc. shows stronger financial stability with a safe zone Altman Z-Score and a very strong Piotroski Score. Block, Inc. remains in the grey zone with average Piotroski results, indicating comparatively higher risk.
Grades Comparison
The following is a comparison of the latest available grades and ratings for Block, Inc. and Okta, Inc.:
Block, Inc. Grades
This table summarizes recent grades from reputable financial institutions for Block, Inc.:
| Grading Company | Action | New Grade | Date |
|---|---|---|---|
| Piper Sandler | Maintain | Underweight | 2026-01-14 |
| Keefe, Bruyette & Woods | Maintain | Outperform | 2026-01-02 |
| Needham | Maintain | Buy | 2025-11-24 |
| B of A Securities | Maintain | Buy | 2025-11-21 |
| Morgan Stanley | Maintain | Equal Weight | 2025-11-21 |
| BTIG | Maintain | Buy | 2025-11-20 |
| RBC Capital | Maintain | Outperform | 2025-11-20 |
| Stephens & Co. | Maintain | Overweight | 2025-11-20 |
| Mizuho | Maintain | Outperform | 2025-11-20 |
| BTIG | Maintain | Buy | 2025-11-14 |
Block, Inc.’s grades show a majority of buy and outperform ratings, with a single underweight and equal weight, indicating generally positive sentiment with some caution.
Okta, Inc. Grades
This table shows recent grades from recognized grading companies for Okta, Inc.:
| Grading Company | Action | New Grade | Date |
|---|---|---|---|
| Stephens & Co. | Upgrade | Overweight | 2026-01-14 |
| Piper Sandler | Maintain | Neutral | 2026-01-05 |
| RBC Capital | Maintain | Outperform | 2026-01-05 |
| Jefferies | Upgrade | Buy | 2025-12-16 |
| Needham | Maintain | Buy | 2025-12-12 |
| BTIG | Maintain | Buy | 2025-12-04 |
| Susquehanna | Maintain | Neutral | 2025-12-03 |
| Cantor Fitzgerald | Maintain | Overweight | 2025-12-03 |
| Canaccord Genuity | Maintain | Buy | 2025-12-03 |
| Scotiabank | Maintain | Sector Perform | 2025-12-03 |
Okta, Inc.’s grades reflect a strong buy and overweight trend, supported by recent upgrades, showing improving market sentiment.
Which company has the best grades?
Both companies share an overall consensus “Buy” rating, but Okta, Inc. exhibits more upgrades and a stronger overweight trend, which could suggest higher confidence from analysts. For investors, this might imply better growth prospects or market positioning relative to Block, Inc., whose ratings include some cautionary underweight and equal weight grades.
Strengths and Weaknesses
Below is a comparative overview of key strengths and weaknesses for Block, Inc. and Okta, Inc. based on the most recent data.
| Criterion | Block, Inc. (XYZ) | Okta, Inc. (OKTA) |
|---|---|---|
| Diversification | High: revenues from software, crypto assets, transactions, and hardware | Moderate: mainly subscription services with minor technology services |
| Profitability | Moderate: net margin 12.01%, ROE neutral, but ROIC unfavorable vs. WACC | Low: net margin 1.07%, ROE and ROIC unfavorable; company shedding value |
| Innovation | Strong: consistent growth in ROIC, expanding crypto and software segments | Strong growth in ROIC but still value destructive, reflecting investment in innovation |
| Global presence | Broad: diverse product lines and markets including crypto and payments | Focused: primarily subscription-based security services with growing adoption |
| Market Share | Significant in fintech and crypto transaction space | Niche leader in identity and access management, but smaller scale in revenues |
Key takeaways: Block demonstrates solid diversification and improving profitability with growing ROIC despite current value destruction. Okta shows rapid ROIC growth but struggles with profitability and value creation. Investors should weigh Block’s broader market presence and Okta’s innovation-driven growth carefully.
Risk Analysis
Below is a comparative risk analysis for Block, Inc. (XYZ) and Okta, Inc. (OKTA) based on the most recent data available.
| Metric | Block, Inc. (XYZ) | Okta, Inc. (OKTA) |
|---|---|---|
| Market Risk | High beta (2.665) indicates elevated volatility | Low beta (0.76) suggests lower volatility |
| Debt level | Moderate debt-to-equity (0.37), favorable leverage | Low debt-to-equity (0.15), low financial risk |
| Regulatory Risk | Moderate, exposed to payment and data regulations in multiple countries | Moderate, identity/security sector with compliance demands |
| Operational Risk | Moderate, complexity in hardware-software integration | Moderate, reliance on software platform stability |
| Environmental Risk | Low, primarily software and hardware with limited direct impact | Low, cloud-based services with minimal environmental footprint |
| Geopolitical Risk | Moderate, operates in several countries including US, Japan, EU | Moderate, international client base with exposure to geopolitical shifts |
The most likely and impactful risks for Block, Inc. include market volatility due to its high beta and regulatory challenges in global payment processing. Okta’s risks stem mainly from operational dependency on software security and a high valuation that may not be supported by current profitability, increasing market sensitivity. Both maintain manageable debt levels, but investors should monitor regulatory changes closely.
Which Stock to Choose?
Block, Inc. (XYZ) shows a favorable income evolution with 10.06% revenue growth in 2024 and strong profitability reflected in a 12.01% net margin. Financial ratios are slightly favorable overall, featuring a healthy current ratio (2.33) and low debt-to-equity (0.37). Despite a slightly unfavorable moat rating, its ROIC is growing and rated B+ with moderate to favorable scores.
Okta, Inc. (OKTA) also demonstrates favorable income growth, with 15.33% revenue increase in 2025 and solid gross margin at 76.32%. However, its profitability ratios are mostly unfavorable, including a low 1.07% net margin and negative ROIC versus WACC. Financial ratios are neutral overall, with a strong Altman Z-Score and high Piotroski Score; its rating is B with mixed scores.
For investors prioritizing growth, Okta’s higher revenue growth and improving profitability might appear attractive despite some unfavorable ratios. Conversely, those seeking a stock with more balanced financial stability and favorable income metrics might find Block’s profile more aligned with a slightly favorable rating and improving profitability. The choice could depend on tolerance for risk and investment strategy.
Disclaimer: Investment carries a risk of loss of initial capital. The past performance is not a reliable indicator of future results. Be sure to understand risks before making an investment decision.
Go Further
I encourage you to read the complete analyses of Block, Inc. and Okta, Inc. to enhance your investment decisions: