In today’s fast-evolving tech landscape, Block, Inc. and Oddity Tech Ltd. stand out as innovators in the software infrastructure sector, yet they target distinct market niches—financial technology and consumer beauty tech, respectively. Their shared focus on cutting-edge technology and digital transformation makes them compelling competitors. This article will explore their strengths and risks to help you decide which company could be the most attractive investment opportunity in 2026.
Table of contents
Companies Overview
I will begin the comparison between Block, Inc. and Oddity Tech Ltd. by providing an overview of these two companies and their main differences.
Block, Inc. Overview
Block, Inc. operates in the Software – Infrastructure industry, focusing on enabling sellers to accept card payments with a broad range of hardware and software solutions. Its offerings include payment terminals, point-of-sale software, and financial services like Cash App. Founded in 2009 and headquartered in Oakland, CA, Block serves markets across the US, Canada, Japan, Australia, and Europe, positioning itself as a significant player in payment technologies.
Oddity Tech Ltd. Overview
Oddity Tech Ltd. is a consumer-tech company specializing in beauty and wellness products through digital-first brands. Utilizing its proprietary PowerMatch technology, Oddity seeks to disrupt traditional offline markets with innovative offerings under brands like IL MAKIAGE and SpoiledChild. Founded in 2013 and based in Tel Aviv-Jaffa, Israel, the company is focused on leveraging technology to scale global beauty and wellness solutions.
Key similarities and differences
Both companies operate in the technology sector with a focus on software infrastructure, but their core markets differ significantly. Block targets payment processing and financial services, while Oddity Tech concentrates on digital beauty and wellness products. Block has a much larger market capitalization and employee base, reflecting its broader geographic presence and product scope. Oddity Tech is more niche, emphasizing consumer-tech innovation within a specific industry.
Income Statement Comparison
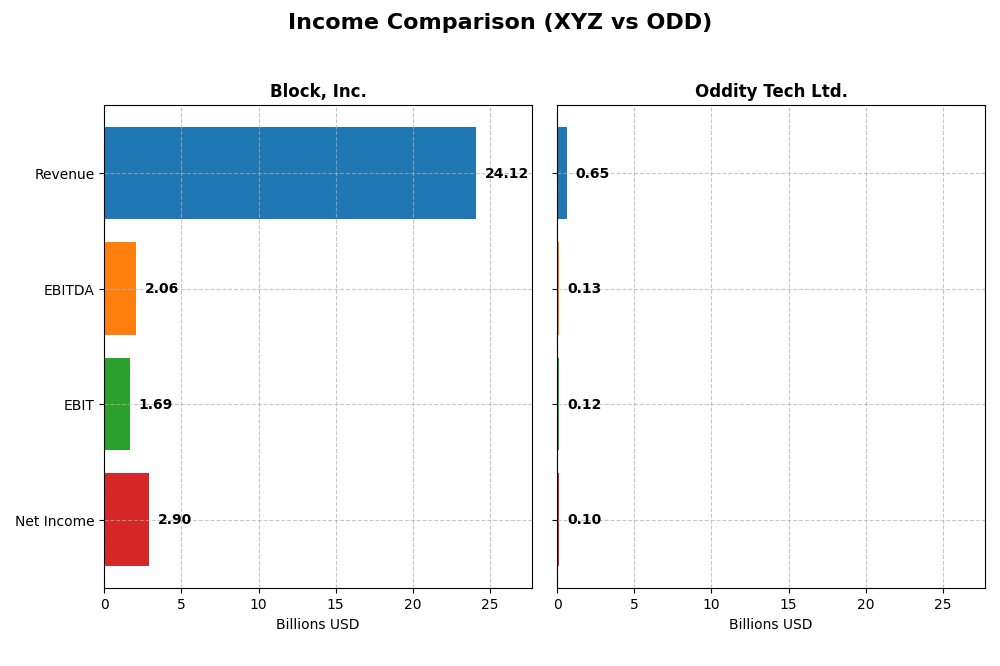
The table below compares key income statement metrics for Block, Inc. and Oddity Tech Ltd. for the fiscal year 2024, providing a snapshot of their financial performance.
| Metric | Block, Inc. (XYZ) | Oddity Tech Ltd. (ODD) |
|---|---|---|
| Market Cap | 40.2B | 2.01B |
| Revenue | 24.1B | 647M |
| EBITDA | 2.06B | 125M |
| EBIT | 1.69B | 116M |
| Net Income | 2.90B | 101M |
| EPS | 4.7 | 1.78 |
| Fiscal Year | 2024 | 2024 |
Income Statement Interpretations
Block, Inc.
Block, Inc. exhibited strong revenue growth from $9.5B in 2020 to $24.1B in 2024, with net income recovering from losses in 2022 to $2.9B in 2024. Gross margin improved to 36.85%, while net margin reached 12.01%, both favorable. The latest year showed robust earnings growth despite operating expenses rising alongside revenue, indicating efficiency gains.
Oddity Tech Ltd.
Oddity Tech Ltd. showed impressive revenue growth from $110M in 2020 to $647M in 2024, with net income rising steadily to $101M. Margins remained strong, with a gross margin of 72.38% and net margin at 15.69%, all favorable. The 2024 fiscal year reflected solid profitability improvements and accelerated growth across key income metrics.
Which one has the stronger fundamentals?
Both companies demonstrate favorable income statement trends, yet Oddity Tech Ltd. shows consistently higher margins and steadier profitability growth. Block, Inc. has larger scale and significant recent earnings turnaround but with somewhat less margin stability. Oddity Tech’s flawless favorable evaluation contrasts with Block’s minor unfavorable points, suggesting differing risk and growth profiles.
Financial Ratios Comparison
Below is a comparison of key financial ratios for Block, Inc. (XYZ) and Oddity Tech Ltd. (ODD) based on their most recent fiscal year data from 2024.
| Ratios | Block, Inc. (XYZ) | Oddity Tech Ltd. (ODD) |
|---|---|---|
| ROE | 13.6% | 36.0% |
| ROIC | 3.0% | 28.6% |
| P/E | 18.1 | 23.7 |
| P/B | 2.47 | 8.54 |
| Current Ratio | 2.33 | 1.79 |
| Quick Ratio | 2.31 | 0.99 |
| D/E (Debt to Equity) | 0.37 | 0.08 |
| Debt-to-Assets | 21.5% | 5.2% |
| Interest Coverage | 95.9 | 1521.1 |
| Asset Turnover | 0.66 | 1.47 |
| Fixed Asset Turnover | 45.1 | 19.4 |
| Payout Ratio | 0 | 0 |
| Dividend Yield | 0 | 0 |
Interpretation of the Ratios
Block, Inc.
Block, Inc. displays a balanced mix of financial ratios, with 50% rated favorable and 21% unfavorable, leading to a slightly favorable overall assessment. Strong liquidity is evident in its current and quick ratios, while return on invested capital and WACC are areas of concern. The company does not pay dividends, likely reflecting a strategy focused on reinvestment and growth rather than shareholder distributions.
Oddity Tech Ltd.
Oddity Tech Ltd. has a higher proportion of favorable ratios at 64%, showing robust profitability and efficient asset use, especially in return on equity and invested capital. However, its price-to-book ratio and WACC are unfavorable, suggesting valuation and cost of capital challenges. Like Block, it pays no dividends, possibly due to reinvestment priorities or growth phase considerations.
Which one has the best ratios?
Comparing both, Oddity Tech Ltd. presents a more favorable ratio profile with stronger profitability and asset efficiency metrics, despite some valuation concerns. Block, Inc. shows solid liquidity but weaker returns on invested capital and a more mixed ratio evaluation. Overall, Oddity Tech’s ratios suggest a stronger financial stance based on the available data.
Strategic Positioning
This section compares the strategic positioning of Block, Inc. and Oddity Tech Ltd., focusing on market position, key segments, and exposure to technological disruption:
Block, Inc.
- Large market cap of 40B with strong competitive pressure in payment software and hardware.
- Diverse revenue streams including software, cryptocurrency assets, hardware, and transaction services.
- Operating in established payment technologies with limited visible disruption risks.
Oddity Tech Ltd.
- Smaller market cap of 2B focusing on consumer-tech beauty and wellness sector.
- Concentrated on digital-first beauty and wellness brands leveraging PowerMatch technology.
- Innovating offline beauty market with digital-first approach, potential disruption in traditional retail.
Block, Inc. vs Oddity Tech Ltd. Positioning
Block shows a diversified business with multiple revenue sources across payments and crypto, contrasting Oddity’s concentrated focus on digital beauty and wellness brands. Block’s scale offers breadth, while Oddity targets niche market disruption.
Which has the best competitive advantage?
Oddity Tech Ltd. demonstrates a very favorable moat with growing ROIC well above WACC, indicating durable competitive advantage. Block, Inc. shows slightly unfavorable moat status, shedding value despite improving profitability.
Stock Comparison
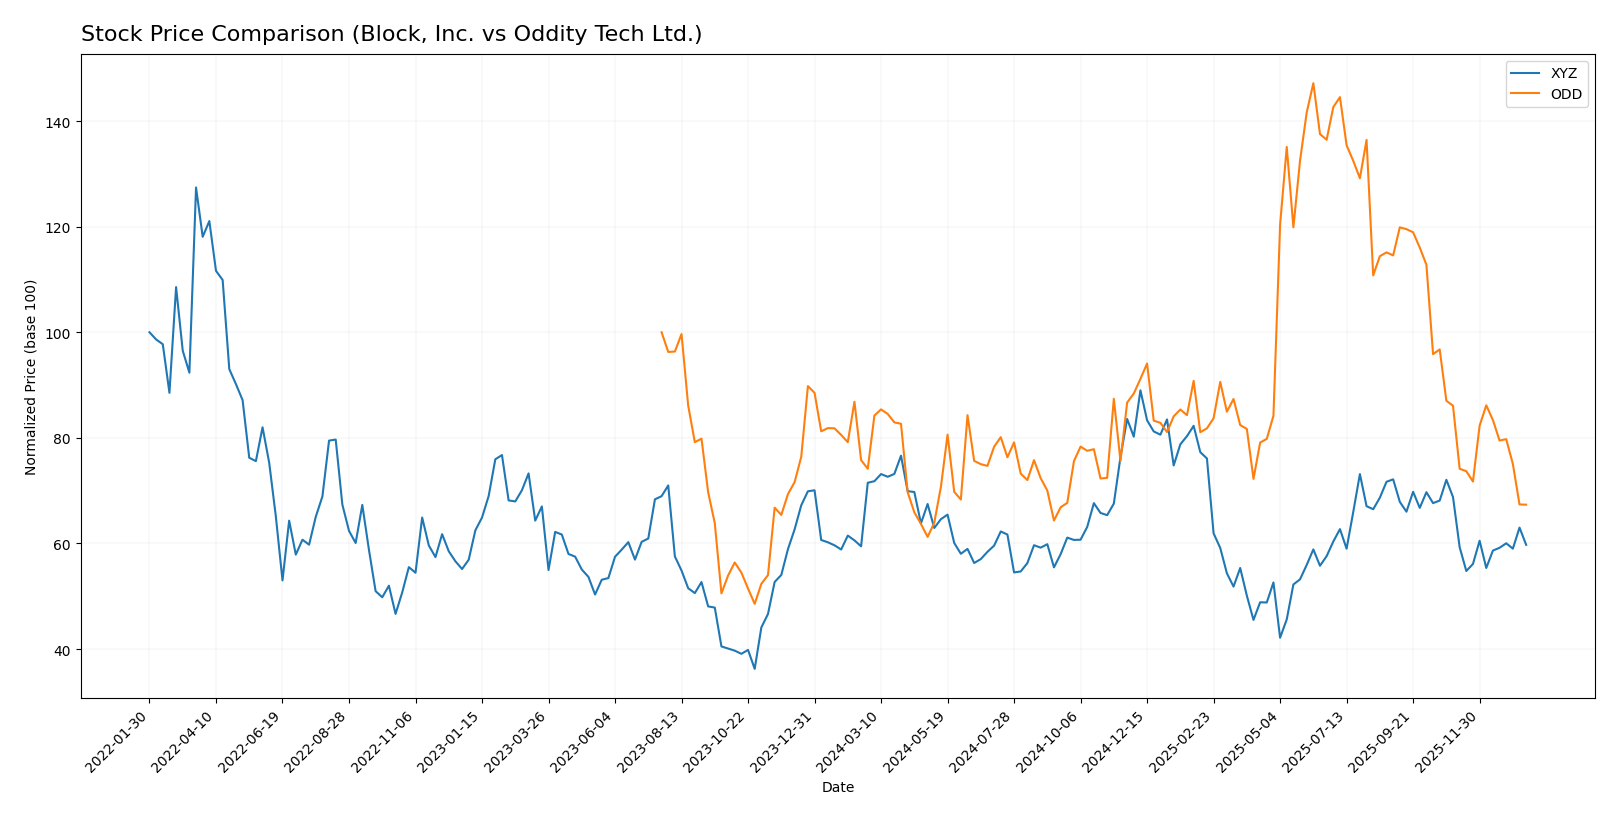
The past year reveals pronounced bearish trends for both Block, Inc. and Oddity Tech Ltd., with significant price declines and decelerating momentum, reflecting challenging trading dynamics and shifting investor sentiment.
Trend Analysis
Block, Inc. (XYZ) experienced a -16.43% price decline over the past 12 months, marking a bearish trend with decelerating losses and notable volatility (std deviation 10.43), with prices ranging from 98.25 to 46.53.
Oddity Tech Ltd. (ODD) showed a -9.16% price decrease over the same period, also bearish with deceleration and slightly higher volatility (std deviation 11.75), with highs at 77.35 and lows at 32.19.
Comparing both stocks, Block, Inc. delivered the steeper market decline over the year, indicating poorer relative performance versus Oddity Tech Ltd.
Target Prices
The target price consensus for Block, Inc. and Oddity Tech Ltd. reflects moderate upside potential based on current analyst estimates.
| Company | Target High | Target Low | Consensus |
|---|---|---|---|
| Block, Inc. | 100 | 65 | 84.91 |
| Oddity Tech Ltd. | 80 | 40 | 66.33 |
Analysts expect Block, Inc. to trade significantly above its current price of 65.95 USD, while Oddity Tech Ltd.’s consensus target of 66.33 USD suggests strong upside from its current 35.40 USD price.
Analyst Opinions Comparison
This section compares analysts’ ratings and grades for Block, Inc. and Oddity Tech Ltd.:
Rating Comparison
Block, Inc. Rating
- Rating: B+, classified as Very Favorable overall.
- Discounted Cash Flow Score: 3, Moderate status.
- ROE Score: 4, Favorable status indicating strong efficiency.
- ROA Score: 4, Favorable status showing effective asset use.
- Debt To Equity Score: 2, Moderate status, lower risk.
- Overall Score: 3, Moderate status summarizing financial standing.
Oddity Tech Ltd. Rating
- Rating: B+, classified as Very Favorable overall.
- Discounted Cash Flow Score: 4, Favorable status.
- ROE Score: 5, Very Favorable status, highest efficiency.
- ROA Score: 4, Favorable status showing effective asset use.
- Debt To Equity Score: 3, Moderate status, slightly higher risk.
- Overall Score: 3, Moderate status summarizing financial standing.
Which one is the best rated?
Both companies share the same overall rating of B+ with a Moderate overall score. Oddity Tech Ltd. outperforms Block, Inc. in Discounted Cash Flow and Return on Equity scores, while Block has a better Debt To Equity score.
Scores Comparison
The comparison below summarizes the Altman Z-Score and Piotroski Score for Block, Inc. and Oddity Tech Ltd.:
Block, Inc. Scores
- Altman Z-Score: 2.70, in the grey zone indicating moderate bankruptcy risk.
- Piotroski Score: 6, classified as average financial strength.
Oddity Tech Ltd. Scores
- Altman Z-Score: 3.78, in the safe zone indicating low bankruptcy risk.
- Piotroski Score: 6, classified as average financial strength.
Which company has the best scores?
Oddity Tech Ltd. has a higher Altman Z-Score in the safe zone, suggesting lower bankruptcy risk than Block, Inc., although both have the same average Piotroski Score.
Grades Comparison
Here is the detailed grades comparison for Block, Inc. and Oddity Tech Ltd.:
Block, Inc. Grades
This table summarizes recent grades from reputable financial firms for Block, Inc.:
| Grading Company | Action | New Grade | Date |
|---|---|---|---|
| Piper Sandler | Maintain | Underweight | 2026-01-14 |
| Keefe, Bruyette & Woods | Maintain | Outperform | 2026-01-02 |
| Needham | Maintain | Buy | 2025-11-24 |
| B of A Securities | Maintain | Buy | 2025-11-21 |
| Morgan Stanley | Maintain | Equal Weight | 2025-11-21 |
| BTIG | Maintain | Buy | 2025-11-20 |
| RBC Capital | Maintain | Outperform | 2025-11-20 |
| Stephens & Co. | Maintain | Overweight | 2025-11-20 |
| Mizuho | Maintain | Outperform | 2025-11-20 |
| BTIG | Maintain | Buy | 2025-11-14 |
Block, Inc. shows a majority of buy and outperform ratings, with a few equal weight and underweight grades, indicating mixed but mostly positive sentiment.
Oddity Tech Ltd. Grades
Below is a summary of recent grades from established grading companies for Oddity Tech Ltd.:
| Grading Company | Action | New Grade | Date |
|---|---|---|---|
| Keybanc | Maintain | Overweight | 2026-01-08 |
| JP Morgan | Maintain | Overweight | 2025-12-12 |
| JP Morgan | Maintain | Overweight | 2025-11-21 |
| Barclays | Maintain | Equal Weight | 2025-11-21 |
| Morgan Stanley | Maintain | Equal Weight | 2025-11-21 |
| Needham | Maintain | Buy | 2025-11-20 |
| Keybanc | Maintain | Overweight | 2025-10-08 |
| JMP Securities | Maintain | Market Outperform | 2025-09-23 |
| Morgan Stanley | Maintain | Equal Weight | 2025-08-06 |
| JMP Securities | Maintain | Market Outperform | 2025-08-05 |
Oddity Tech Ltd. generally receives overweight and market outperform ratings, supported by some buy and equal weight grades, reflecting predominantly positive analyst views.
Which company has the best grades?
Both companies carry a consensus “Buy” rating, but Block, Inc. has a higher number of buy and outperform grades, while Oddity Tech Ltd. more frequently receives overweight and market outperform ratings. This suggests Block, Inc. may be viewed with slightly stronger conviction by analysts, potentially influencing investor confidence and portfolio positioning.
Strengths and Weaknesses
Below is a comparative table highlighting key strengths and weaknesses of Block, Inc. and Oddity Tech Ltd. based on recent financial and strategic data.
| Criterion | Block, Inc. (XYZ) | Oddity Tech Ltd. (ODD) |
|---|---|---|
| Diversification | Moderate: Revenue split among software (7.16B), crypto assets (10.2B), hardware (143M), and transactions (6.61B) | Limited public data; presumed focused tech firm |
| Profitability | Moderate profitability; net margin 12.0%, ROE 13.6%, but ROIC (3.03%) below WACC (14.3%) indicating value erosion | Strong profitability; net margin 15.7%, ROE 36.0%, ROIC 28.6% well above WACC (18.7%) |
| Innovation | Growing ROIC trend (+13.7%) suggests improving efficiency and innovation efforts | Very favorable ROIC trend (+34.2%) indicates strong innovation and competitive advantage |
| Global presence | Significant, given diverse product lines including cryptocurrency services | Assumed expanding, supported by strong financials but less disclosed |
| Market Share | Solid in cryptocurrency and software sectors but facing value destruction overall | Likely strong in niche markets, supported by durable competitive advantage |
Block, Inc. shows improving profitability trends but currently struggles with capital efficiency, reflecting a cautious investment stance. Oddity Tech Ltd. demonstrates robust value creation and innovation, making it an attractive option for investors seeking growth and durability.
Risk Analysis
Below is a comparative overview of key risks for Block, Inc. (XYZ) and Oddity Tech Ltd. (ODD) based on their latest 2024 data.
| Metric | Block, Inc. (XYZ) | Oddity Tech Ltd. (ODD) |
|---|---|---|
| Market Risk | High beta of 2.67 indicates elevated volatility | Very high beta of 3.18 implies higher sensitivity to market swings |
| Debt Level | Moderate debt/equity ratio of 0.37, favorable leverage | Low debt/equity ratio of 0.08, very favorable financial stability |
| Regulatory Risk | Moderate, US-based with some exposure to financial regulations | Moderate, Israeli company with evolving regulatory environment |
| Operational Risk | Medium, with complex payment and software infrastructure | Medium, reliant on technology innovation and brand performance |
| Environmental Risk | Low, no direct exposure highlighted | Low, consumer tech with limited environmental footprint |
| Geopolitical Risk | Moderate, operates in multiple countries including US, Japan, Europe | Higher, headquartered in Israel with regional geopolitical tensions |
In synthesis, Oddity Tech Ltd. presents stronger financial health with lower debt and a safer Altman Z-Score, but carries higher geopolitical risk due to its location. Block, Inc. faces notable market volatility and moderate regulatory risks but benefits from diversified geographic presence. Market risk and geopolitical concerns are the most impactful for investors to monitor in 2026.
Which Stock to Choose?
Block, Inc. (XYZ) shows a favorable income evolution with a 10.06% revenue growth in 2024 and strong net margin improvement at 12.01%. Its financial ratios are slightly favorable overall, supported by low debt (debt-to-assets 21.53%) and high interest coverage. However, ROIC is below WACC, indicating value destruction despite growing profitability. The company holds a very favorable B+ rating and is in the Altman Z-score grey zone.
Oddity Tech Ltd. (ODD) displays robust income growth, with 27.2% revenue increase and consistently favorable margins, including a 15.69% net margin. Its financials are overall favorable, showing low debt (debt-to-assets 5.17%) and high returns (ROE 35.95%, ROIC 28.56%) exceeding WACC, signaling strong value creation. The rating is also B+ with a very favorable outlook, and Altman Z-score places it in the safe zone.
For investors prioritizing growth and high profitability, Oddity Tech’s strong income growth and favorable financial ratios may appear more attractive. Conversely, risk-averse investors or those valuing stability might see Block, Inc.’s improving profitability and moderate leverage as a more cautious profile. Both stocks face bearish price trends recently, indicating potential market uncertainties.
Disclaimer: Investment carries a risk of loss of initial capital. The past performance is not a reliable indicator of future results. Be sure to understand risks before making an investment decision.
Go Further
I encourage you to read the complete analyses of Block, Inc. and Oddity Tech Ltd. to enhance your investment decisions: