In today’s rapidly evolving technology landscape, Block, Inc. and Nutanix, Inc. stand out as key players in the software infrastructure sector. Both companies innovate to address complex digital transformation challenges, yet they target overlapping markets with distinct approaches—Block with its payment and commerce solutions, Nutanix with its enterprise cloud platform. In this article, I will analyze their strategies and performance to help you decide which company deserves a place in your investment portfolio.

Table of contents
Companies Overview
I will begin the comparison between Block, Inc. and Nutanix, Inc. by providing an overview of these two companies and their main differences.
Block, Inc. Overview
Block, Inc. develops tools that enable sellers to accept card payments and offers hardware and software solutions for point-of-sale systems. Its products include card readers, payment terminals, and software such as Square Point of Sale and Cash App. The company operates in several countries including the US, Canada, and the UK, positioning itself as an innovator in payment infrastructure since its 2009 founding.
Nutanix, Inc. Overview
Nutanix, Inc. provides an enterprise cloud platform with products spanning virtualization, storage, security, and cloud management. Its offerings include Acropolis, Nutanix Karbon, and desktop-as-a-service solutions aimed at simplifying hybrid cloud operations. Founded in 2009 and headquartered in San Jose, Nutanix serves a global customer base across multiple industries, focusing on software infrastructure for enterprise cloud environments.
Key similarities and differences
Both companies operate within the software infrastructure industry and were founded in 2009, but their business models diverge significantly. Block focuses on payment processing hardware and software for merchants and consumers, while Nutanix specializes in enterprise cloud platforms and hybrid cloud management software. Block’s solutions cater primarily to retail and payment sectors, whereas Nutanix targets enterprise IT environments with virtualization and cloud orchestration services.
Income Statement Comparison
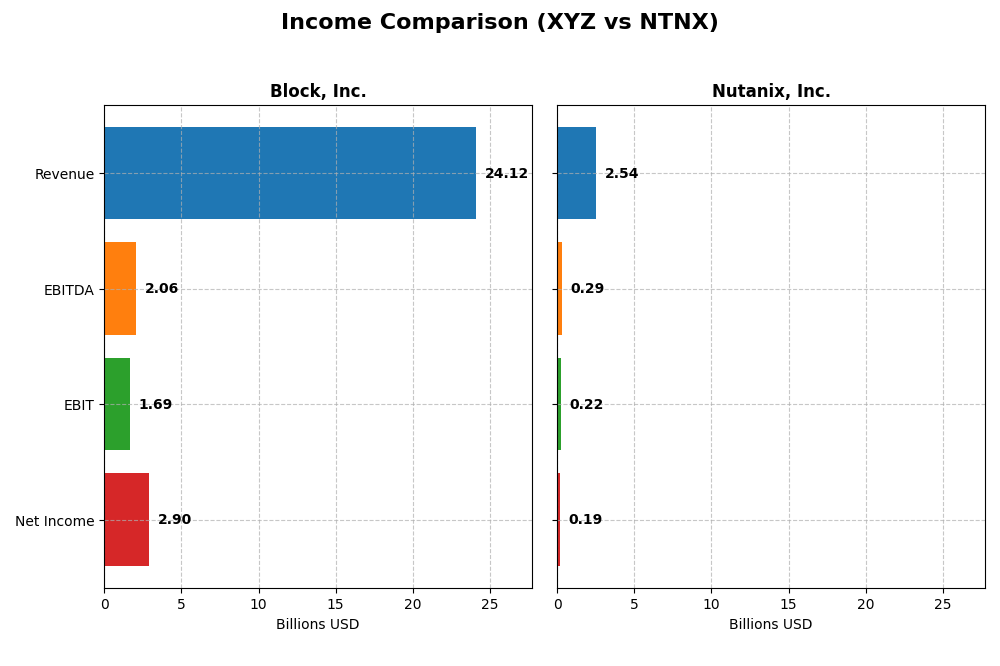
Below is a comparison of key income statement metrics for Block, Inc. and Nutanix, Inc. for their most recent fiscal years, providing a snapshot of their financial performance.
| Metric | Block, Inc. (XYZ) | Nutanix, Inc. (NTNX) |
|---|---|---|
| Market Cap | 40.2B | 12.4B |
| Revenue | 24.1B | 2.5B |
| EBITDA | 2.1B | 293M |
| EBIT | 1.7B | 220M |
| Net Income | 2.9B | 188M |
| EPS | 4.7 | 0.7 |
| Fiscal Year | 2024 | 2025 |
Income Statement Interpretations
Block, Inc.
Block, Inc. demonstrated strong growth in revenue and net income from 2020 to 2024, with revenue rising from 9.5B to 24.1B and net income turning positive after losses in prior years. Margins improved notably, with gross margin favorable at 36.85% and net margin reaching 12.01% in 2024. The latest year showed robust revenue growth of 10.06% and a sharp net margin expansion, signaling improving profitability.
Nutanix, Inc.
Nutanix, Inc. experienced steady revenue growth from 1.39B in 2021 to 2.54B in 2025, with net income recovering from heavy losses to 188M in 2025. Its gross margin remained very strong at 86.81%, with an improving net margin of 7.42%. The latest fiscal year posted favorable growth across revenue (18.11%) and profitability metrics, reflecting a positive earnings turnaround and operational efficiency gains.
Which one has the stronger fundamentals?
Both companies show favorable income statement trends with improving revenue and profitability. Block, Inc. has achieved higher absolute revenue and net income, with significant margin expansion and EPS growth, but with a higher beta indicating more volatility. Nutanix benefits from a stronger gross margin and consistent operating improvements. Fundamentally, both exhibit strengths, with Nutanix showing steadier margin control and Block delivering greater scale and rapid profit growth.
Financial Ratios Comparison
The table below presents a side-by-side comparison of the key financial ratios for Block, Inc. (XYZ) and Nutanix, Inc. (NTNX) based on their most recent fiscal year data.
| Ratios | Block, Inc. (XYZ) 2024 | Nutanix, Inc. (NTNX) 2025 |
|---|---|---|
| ROE | 13.62% | -27.12% |
| ROIC | 3.03% | 8.11% |
| P/E | 18.1 | 106.74 |
| P/B | 2.47 | -28.95 |
| Current Ratio | 2.33 | 1.72 |
| Quick Ratio | 2.31 | 1.72 |
| D/E | 0.37 | -2.14 |
| Debt-to-Assets | 21.53% | 45.16% |
| Interest Coverage | 95.93 | 8.75 |
| Asset Turnover | 0.66 | 0.77 |
| Fixed Asset Turnover | 45.14 | 9.15 |
| Payout ratio | 0 | 0 |
| Dividend yield | 0 | 0 |
Interpretation of the Ratios
Block, Inc.
Block, Inc. presents a balanced ratio profile with 50% favorable and 21.43% unfavorable indicators. Strong points include a solid current ratio of 2.33, favorable debt management, and excellent interest coverage at 181.31. However, its return on invested capital (3.03%) and WACC (14.27%) are less encouraging. The company does not pay dividends, likely focusing on reinvestment and growth.
Nutanix, Inc.
Nutanix, Inc. also shows a slightly favorable overall ratio profile, with half the ratios favorable and around 21% unfavorable. It benefits from a low WACC of 5.89%, good liquidity ratios near 1.72, and strong interest coverage at 11.15. However, a negative return on equity (-27.12%) and very high P/E ratio reflect concerns. Nutanix does not pay dividends, likely prioritizing R&D and expansion.
Which one has the best ratios?
Both companies share a slightly favorable overall ratio assessment, with strengths in liquidity and interest coverage. Block, Inc. offers better return stability and debt metrics, while Nutanix has a more favorable cost of capital but weaker profitability. Neither pays dividends, reflecting reinvestment strategies aligned with their growth phases.
Strategic Positioning
This section compares the strategic positioning of Block, Inc. and Nutanix, Inc., focusing on market position, key segments, and exposure to technological disruption:
Block, Inc.
- Market leader in payment processing with strong competitive pressure in software and hardware sectors
- Diverse revenue streams: payments, software, hardware, and cryptocurrency denominated assets
- Faces disruption from evolving payment technologies and cryptocurrency market volatility
Nutanix, Inc.
- Competes in enterprise cloud platform with moderate pressure in software infrastructure sector
- Focused on subscription, professional services, and cloud platform products
- Exposed to cloud computing and virtualization technology shifts
Block, Inc. vs Nutanix, Inc. Positioning
Block adopts a diversified strategy across payments, software, hardware, and crypto assets, providing multiple business drivers. Nutanix concentrates on enterprise cloud and subscription services, which may offer focused innovation but less revenue diversification.
Which has the best competitive advantage?
Nutanix shows a very favorable moat with growing ROIC above WACC, indicating durable competitive advantage and increasing profitability. Block’s moat is slightly unfavorable despite growing ROIC, signaling value destruction but improving profitability trends.
Stock Comparison
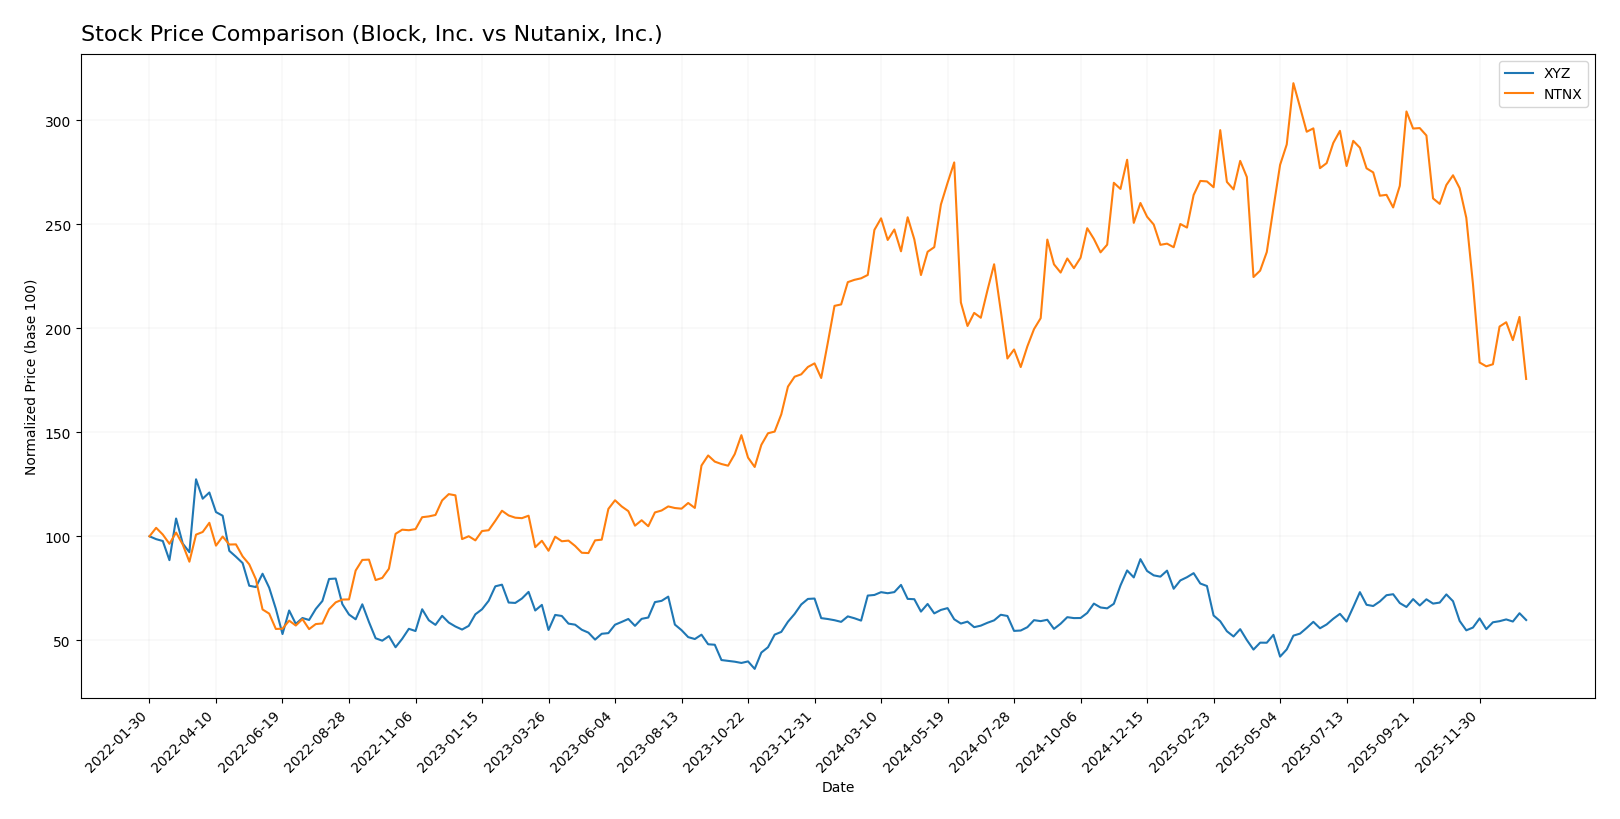
The stock price movements of Block, Inc. and Nutanix, Inc. over the past year reveal clear bearish trends with varying degrees of decline and recent deceleration in price drops.
Trend Analysis
Block, Inc. experienced a -16.43% price decrease over the past 12 months, indicating a bearish trend with deceleration. The stock showed high volatility with a 10.43 std deviation and a range from 98.25 to 46.53.
Nutanix, Inc. showed a steeper bearish trend with a -22.16% decline over the same period and deceleration in losses. Volatility was slightly lower at 8.67 std deviation, with prices between 82.77 and 45.74.
Comparing the two, Block, Inc. delivered comparatively better market performance than Nutanix, Inc., due to a smaller overall price decline over the analyzed period.
Target Prices
The current analyst consensus provides insightful target price ranges for Block, Inc. and Nutanix, Inc.
| Company | Target High | Target Low | Consensus |
|---|---|---|---|
| Block, Inc. | 100 | 65 | 84.91 |
| Nutanix, Inc. | 90 | 53 | 64.67 |
Analysts expect Block, Inc.’s stock to appreciate from its current price of $65.95 toward a consensus target near $85, while Nutanix, Inc. shows upside potential from $45.74 to roughly $65. These targets suggest moderate bullish sentiment relative to current market prices.
Analyst Opinions Comparison
This section compares analysts’ ratings and grades for Block, Inc. and Nutanix, Inc.:
Rating Comparison
Block, Inc. Rating
- Rating: B+ indicating a very favorable overall financial standing.
- Discounted Cash Flow Score: Moderate score of 3, reflecting balanced valuation.
- ROE Score: Favorable score of 4, showing efficient profit generation from equity.
- ROA Score: Favorable score of 4, demonstrating effective asset utilization.
- Debt To Equity Score: Moderate score of 2, reflecting moderate financial risk.
- Overall Score: Moderate score of 3, summarizing a balanced financial profile.
Nutanix, Inc. Rating
- Rating: C+ with a very favorable overall financial standing.
- Discounted Cash Flow Score: Favorable score of 4, suggesting undervaluation potential.
- ROE Score: Very unfavorable score of 1, indicating weak efficiency in equity returns.
- ROA Score: Favorable score of 4, also indicating good asset utilization.
- Debt To Equity Score: Very unfavorable score of 1, implying higher financial risk.
- Overall Score: Moderate score of 2, indicating a lower overall financial standing.
Which one is the best rated?
Block, Inc. holds a higher overall rating (B+) with stronger ROE and debt-to-equity scores, while Nutanix, Inc. has a lower overall score and weaker financial risk metrics. Based strictly on these ratings, Block, Inc. is better rated.
Scores Comparison
Here is a comparison of the Altman Z-Score and Piotroski Score for Block, Inc. and Nutanix, Inc.:
Block, Inc. Scores
- Altman Z-Score: 2.70, in the grey zone indicating moderate bankruptcy risk.
- Piotroski Score: 6, classified as average financial strength.
Nutanix, Inc. Scores
- Altman Z-Score: 1.48, in the distress zone indicating high bankruptcy risk.
- Piotroski Score: 6, classified as average financial strength.
Which company has the best scores?
Block, Inc. has a higher Altman Z-Score in the grey zone, suggesting lower bankruptcy risk than Nutanix, Inc., which is in the distress zone. Both companies share the same average Piotroski Score of 6.
Grades Comparison
Here is a comparison of recent grades assigned by reputable grading companies for Block, Inc. and Nutanix, Inc.:
Block, Inc. Grades
The following table summarizes recent ratings from recognized financial institutions for Block, Inc.:
| Grading Company | Action | New Grade | Date |
|---|---|---|---|
| Piper Sandler | Maintain | Underweight | 2026-01-14 |
| Keefe, Bruyette & Woods | Maintain | Outperform | 2026-01-02 |
| Needham | Maintain | Buy | 2025-11-24 |
| B of A Securities | Maintain | Buy | 2025-11-21 |
| Morgan Stanley | Maintain | Equal Weight | 2025-11-21 |
| BTIG | Maintain | Buy | 2025-11-20 |
| RBC Capital | Maintain | Outperform | 2025-11-20 |
| Stephens & Co. | Maintain | Overweight | 2025-11-20 |
| Mizuho | Maintain | Outperform | 2025-11-20 |
| BTIG | Maintain | Buy | 2025-11-14 |
The majority of grades for Block, Inc. reflect positive ratings, predominantly Buy and Outperform, with a few Hold and Underweight opinions.
Nutanix, Inc. Grades
Below is the table of recent grades for Nutanix, Inc. from established grading firms:
| Grading Company | Action | New Grade | Date |
|---|---|---|---|
| Barclays | Downgrade | Equal Weight | 2026-01-15 |
| Morgan Stanley | Downgrade | Equal Weight | 2026-01-12 |
| RBC Capital | Maintain | Outperform | 2026-01-05 |
| Goldman Sachs | Maintain | Buy | 2025-11-28 |
| JP Morgan | Maintain | Overweight | 2025-11-26 |
| Needham | Maintain | Buy | 2025-11-26 |
| Wells Fargo | Maintain | Equal Weight | 2025-11-26 |
| Morgan Stanley | Maintain | Overweight | 2025-11-26 |
| Keybanc | Maintain | Overweight | 2025-11-26 |
| Piper Sandler | Maintain | Overweight | 2025-11-26 |
Nutanix, Inc. shows a range of ratings from Buy and Overweight to recent downgrades to Equal Weight by some firms.
Which company has the best grades?
Both companies have a consensus “Buy” rating, but Block, Inc. has more consistent Buy and Outperform grades, while Nutanix, Inc. has several recent downgrades to Equal Weight. This difference may influence investor sentiment regarding risk and growth potential.
Strengths and Weaknesses
The table below compares Block, Inc. and Nutanix, Inc. across key criteria to help you understand their current competitive positions and financial health.
| Criterion | Block, Inc. | Nutanix, Inc. |
|---|---|---|
| Diversification | High revenue from software, cryptocurrency assets, transactions, and hardware | Primarily subscription and professional services with growing product sales |
| Profitability | Net margin favorable at 12.01%, but ROIC (3.03%) below WACC (14.27%) indicates value destruction | Neutral net margin (7.42%), ROIC (8.11%) above WACC (5.89%), showing value creation |
| Innovation | Moderate, with growth in software and crypto assets segments | Strong innovation reflected by very favorable ROIC trend and durable competitive advantage |
| Global presence | Significant presence in financial tech and crypto markets | Global cloud infrastructure and subscription services expanding steadily |
| Market Share | Strong in payment processing and crypto asset management | Growing market share in hybrid cloud and enterprise software |
Block, Inc. shows strong revenue diversification and decent profitability but struggles with efficient capital use, indicating caution. Nutanix, Inc. exhibits a durable competitive advantage with improving profitability and strong innovation, making it a more favorable investment choice in terms of value creation.
Risk Analysis
Below is a comparative overview of key risks facing Block, Inc. (XYZ) and Nutanix, Inc. (NTNX) based on the most recent data available.
| Metric | Block, Inc. (XYZ) | Nutanix, Inc. (NTNX) |
|---|---|---|
| Market Risk | High beta (2.67), volatile market exposure | Low beta (0.49), less volatile |
| Debt level | Moderate debt-to-assets (21.5%), low debt/equity (0.37) | Higher debt-to-assets (45.2%), negative debt/equity ratio |
| Regulatory Risk | Moderate, due to fintech and payments regulations | Moderate, cloud service regulations globally |
| Operational Risk | Medium, reliant on hardware/software integration | Medium-high, complex cloud platform deployments |
| Environmental Risk | Low, primarily software and payment hardware | Low, primarily software infrastructure |
| Geopolitical Risk | Moderate, operates in multiple countries with regulatory variance | Moderate, global presence with diverse markets |
Block, Inc. faces higher market risk due to its significant beta, reflecting sensitivity to market swings. Nutanix’s financial distress signals, including a low Altman Z-score, highlight bankruptcy risk. Both companies must navigate regulatory environments, but Nutanix’s elevated debt and negative debt-to-equity ratio increase financial vulnerability, making it a higher risk for cautious investors.
Which Stock to Choose?
Block, Inc. (XYZ) has demonstrated a favorable income evolution with a 10.06% revenue growth in 2024 and strong profitability, reflected in a 12.01% net margin. Its financial ratios show 50% favorable and 21% unfavorable metrics, with low debt (DE 0.37) and a very favorable rating of B+. However, its ROIC is below WACC, indicating slight value destruction despite growing profitability.
Nutanix, Inc. (NTNX) shows a robust income growth of 18.11% in 2025 and a solid gross margin of 86.81%. Its financial ratios are similarly 50% favorable, but it carries higher debt levels (debt-to-assets 45.16%) and a mixed rating of C+ with strengths in discounted cash flow but weaknesses in ROE and valuation metrics. The company’s ROIC exceeds WACC, suggesting value creation and a very favorable moat.
Investors focused on growth and value creation might find Nutanix’s improving profitability and competitive advantage appealing, while those prioritizing financial stability and a stronger rating could lean toward Block, Inc., which offers more balanced ratios and less financial risk. The choice could depend on the investor’s risk tolerance and strategic preferences.
Disclaimer: Investment carries a risk of loss of initial capital. The past performance is not a reliable indicator of future results. Be sure to understand risks before making an investment decision.
Go Further
I encourage you to read the complete analyses of Block, Inc. and Nutanix, Inc. to enhance your investment decisions: