In the evolving landscape of software infrastructure, Block, Inc. and MongoDB, Inc. stand out as influential innovators. Block, known for its comprehensive payment solutions and developer tools, competes closely with MongoDB’s cutting-edge database platforms, both driving technological advancement. Their overlapping markets and distinct innovation strategies make this comparison compelling. Join me as we explore which company offers the most promising opportunity for investors in 2026.
Table of contents
Companies Overview
I will begin the comparison between Block, Inc. and MongoDB, Inc. by providing an overview of these two companies and their main differences.
Block, Inc. Overview
Block, Inc. develops software and hardware tools enabling sellers to accept card payments and manage business operations. Its offerings include payment readers, point-of-sale solutions, and software for retail, restaurants, and online commerce. The company also provides the Cash App for money management and Weebly for website hosting. Based in Oakland, CA, Block serves multiple countries and operates in the software infrastructure sector.
MongoDB, Inc. Overview
MongoDB, Inc. delivers a general-purpose database platform globally, offering commercial and free versions of its database server. Its flagship product, MongoDB Atlas, is a hosted multi-cloud database-as-a-service. The company also provides consulting and training services. Headquartered in New York City, MongoDB focuses on software infrastructure, servicing enterprise customers with on-premise, cloud, and hybrid database solutions.
Key similarities and differences
Both Block and MongoDB operate in the software infrastructure industry, serving enterprise and developer customers with technology solutions. Block focuses on payment systems and business management tools, while MongoDB specializes in database platforms and cloud services. Block has a larger workforce and broader product range including hardware, whereas MongoDB’s core strength lies in software databases and professional services.
Income Statement Comparison
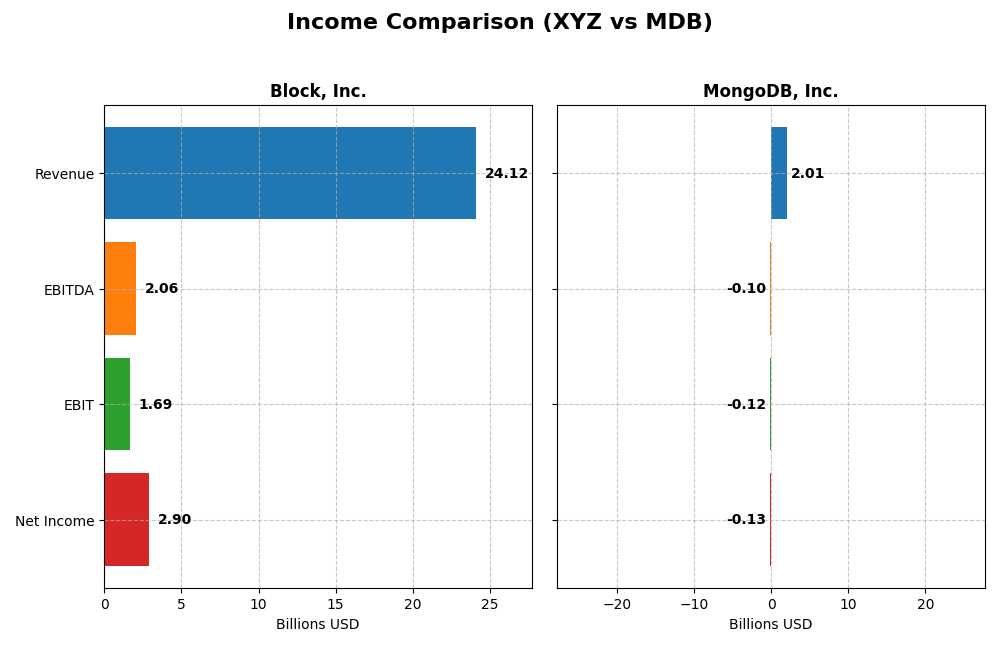
The table below presents a side-by-side comparison of key income statement metrics for Block, Inc. and MongoDB, Inc. based on their most recent fiscal year data.
| Metric | Block, Inc. (XYZ) | MongoDB, Inc. (MDB) |
|---|---|---|
| Market Cap | 40.2B | 32.5B |
| Revenue | 24.1B | 2.01B |
| EBITDA | 2.06B | -97M |
| EBIT | 1.69B | -124M |
| Net Income | 2.90B | -129M |
| EPS | 4.7 | -1.73 |
| Fiscal Year | 2024 | 2025 |
Income Statement Interpretations
Block, Inc.
Block, Inc. showed strong revenue growth from 2020 to 2024, rising from $9.5B to $24.1B, with net income turning significantly positive in 2024 at $2.9B after years of losses or marginal profits. Gross margin remained favorable at 36.85%, while net margin improved to 12.01%, reflecting solid profitability gains. The latest fiscal year saw a 10% revenue increase and a dramatic rise in net income and EPS, indicating robust operational recovery.
MongoDB, Inc.
MongoDB, Inc. experienced notable revenue growth, more than tripling from $590M in 2021 to $2.0B in 2025, with gross margin consistently high around 73%. However, EBIT and net margins remained negative, at -6.16% and -6.43% respectively, though showing improvement. The 2025 fiscal year posted a 19% revenue increase alongside positive growth in net margin and EPS, signaling ongoing progress in reducing losses.
Which one has the stronger fundamentals?
Block, Inc. demonstrates stronger fundamentals through higher absolute profitability, positive net margins, and significant net income growth. MongoDB, Inc. excels in gross margin and revenue growth but still operates at a loss, with negative net and EBIT margins. Both companies show favorable income statement trends overall, but Block’s consistent profitability and margin expansion provide a more solid income foundation.
Financial Ratios Comparison
Below is a comparative table of key financial ratios for Block, Inc. and MongoDB, Inc. based on the most recent fiscal year data available.
| Ratios | Block, Inc. (XYZ) 2024 | MongoDB, Inc. (MDB) 2025 |
|---|---|---|
| ROE | 13.62% | -4.64% |
| ROIC | 3.03% | -7.36% |
| P/E | 18.1 | -157.88 |
| P/B | 2.47 | 7.32 |
| Current Ratio | 2.33 | 5.20 |
| Quick Ratio | 2.31 | 5.20 |
| D/E | 0.37 | 0.01 |
| Debt-to-Assets | 21.53% | 1.06% |
| Interest Coverage | 95.93 | -26.7 |
| Asset Turnover | 0.66 | 0.58 |
| Fixed Asset Turnover | 45.14 | 24.78 |
| Payout ratio | 0 | 0 |
| Dividend yield | 0 | 0 |
Interpretation of the Ratios
Block, Inc.
Block, Inc. shows a mixed ratio profile with 50% favorable and 21.4% unfavorable metrics. The company has strong liquidity with a current ratio of 2.33 and favorable debt metrics, but faces challenges with a below WACC return on invested capital (3.03% vs 14.27%). Its zero dividend yield reflects no dividend payments, likely prioritizing growth and reinvestment.
MongoDB, Inc.
MongoDB, Inc. presents predominantly unfavorable ratios, with 57.1% negative and only 35.7% favorable. The firm struggles with negative margins, returns, and interest coverage, despite low debt levels and a high quick ratio. The company does not pay dividends, consistent with its negative earnings and focus on R&D and expansion in a high growth phase.
Which one has the best ratios?
Block, Inc. holds a more balanced and slightly favorable ratio profile compared to MongoDB, Inc., which faces broad financial challenges and an unfavorable overall evaluation. Block’s stronger liquidity, manageable debt, and positive net margin contrast with MongoDB’s negative profitability and coverage ratios, indicating comparatively better financial stability.
Strategic Positioning
This section compares the strategic positioning of Block, Inc. and MongoDB, Inc. across Market position, Key segments, and Exposure to technological disruption:
Block, Inc.
- Large market cap of 40B, faces competitive pressure in software infrastructure and payments markets.
- Diversified revenue from software, cryptocurrency assets, hardware, and transactions driving growth.
- Exposure to disruption through evolving payment technologies and cryptocurrency market fluctuations.
MongoDB, Inc.
- Market cap of 32.5B, competes in cloud database and enterprise software sectors.
- Concentrated revenue mainly from MongoDB Atlas cloud services and subscription products.
- Faces disruption risks from cloud technology evolution and database innovation demands.
Block, Inc. vs MongoDB, Inc. Positioning
Block maintains a diversified strategic approach with multiple revenue streams including hardware and cryptocurrency, while MongoDB focuses on cloud database services and subscriptions, offering a more concentrated business model with specialized growth drivers.
Which has the best competitive advantage?
Both companies show a slightly unfavorable MOAT, shedding value despite growing ROIC trends; neither currently demonstrates a strong competitive advantage based on ROIC versus WACC evaluation.
Stock Comparison
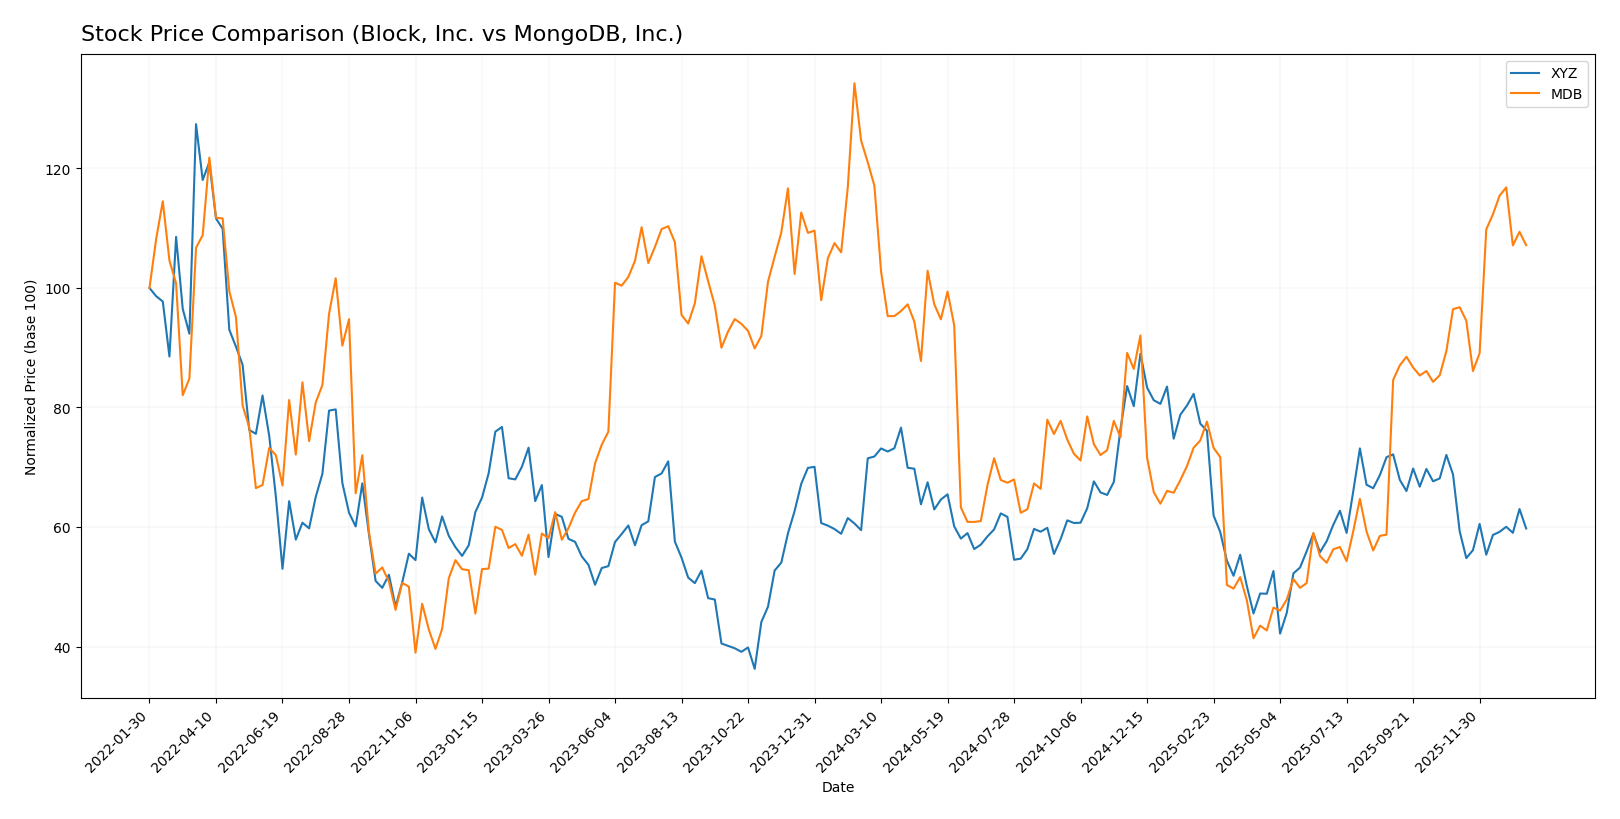
The stock price chart highlights distinct price dynamics over the past 12 months, with both Block, Inc. and MongoDB, Inc. showing notable bearish trends overall, yet differing in recent momentum and trading volume behavior.
Trend Analysis
Block, Inc. experienced a bearish trend over the past year with a price decline of 16.43%, showing deceleration and a standard deviation of 10.43. The stock moved between a high of 98.25 and a low of 46.53.
MongoDB, Inc. also showed a bearish trend with an 11.46% price decrease over the same period but displayed acceleration and a much higher volatility, reflected by a standard deviation of 72.49. Its price ranged from 451.52 to 154.39.
Comparing recent trends, MongoDB, Inc. outperformed Block, Inc. with an 11.1% price increase versus Block’s -13.16%, delivering higher market performance despite both companies’ overall negative yearly returns.
Target Prices
The consensus target prices for Block, Inc. and MongoDB, Inc. reflect analysts’ optimistic outlooks.
| Company | Target High | Target Low | Consensus |
|---|---|---|---|
| Block, Inc. | 100 | 65 | 84.91 |
| MongoDB, Inc. | 500 | 375 | 445.2 |
Analysts expect Block, Inc. shares to rise significantly from the current price of $65.95, while MongoDB, Inc. is projected to increase from $399.76, indicating strong growth potential for both stocks.
Analyst Opinions Comparison
This section compares analysts’ ratings and grades for Block, Inc. and MongoDB, Inc.:
Rating Comparison
Block, Inc. Rating
- Rating: B+, categorized as Very Favorable by analysts.
- Discounted Cash Flow Score: 3, indicating a moderate valuation.
- ROE Score: 4, a favorable indicator of profit generation efficiency.
- ROA Score: 4, favorable, showing effective asset utilization.
- Debt To Equity Score: 2, moderate financial risk.
- Overall Score: 3, moderate overall financial standing.
MongoDB, Inc. Rating
- Rating: C, categorized as Very Favorable by analysts.
- Discounted Cash Flow Score: 2, indicating moderate valuation.
- ROE Score: 1, very unfavorable, showing weak profit generation.
- ROA Score: 1, very unfavorable, indicating poor asset use.
- Debt To Equity Score: 4, favorable, indicating low financial risk.
- Overall Score: 2, moderate overall financial standing.
Which one is the best rated?
Block, Inc. holds a stronger overall profile with a higher rating (B+) and better ROE and ROA scores, despite moderate debt risk. MongoDB, Inc. has a lower rating (C) and weaker profitability metrics but shows favorable debt management.
Scores Comparison
Here is a comparison of the key financial scores for Block, Inc. and MongoDB, Inc.:
Block Scores
- Altman Z-Score: 2.70, in the grey zone indicating moderate bankruptcy risk.
- Piotroski Score: 6, categorized as average financial strength.
MongoDB Scores
- Altman Z-Score: 30.24, in the safe zone indicating low bankruptcy risk.
- Piotroski Score: 4, categorized as average financial strength.
Which company has the best scores?
MongoDB has a significantly higher Altman Z-Score, placing it in the safe zone, while Block remains in the grey zone. Both have average Piotroski scores, with Block’s score slightly higher at 6 versus 4 for MongoDB.
Grades Comparison
Here is a detailed comparison of the latest grades assigned to Block, Inc. and MongoDB, Inc.:
Block, Inc. Grades
The following table summarizes recent grades from reliable financial firms for Block, Inc.:
| Grading Company | Action | New Grade | Date |
|---|---|---|---|
| Piper Sandler | Maintain | Underweight | 2026-01-14 |
| Keefe, Bruyette & Woods | Maintain | Outperform | 2026-01-02 |
| Needham | Maintain | Buy | 2025-11-24 |
| B of A Securities | Maintain | Buy | 2025-11-21 |
| Morgan Stanley | Maintain | Equal Weight | 2025-11-21 |
| BTIG | Maintain | Buy | 2025-11-20 |
| RBC Capital | Maintain | Outperform | 2025-11-20 |
| Stephens & Co. | Maintain | Overweight | 2025-11-20 |
| Mizuho | Maintain | Outperform | 2025-11-20 |
| BTIG | Maintain | Buy | 2025-11-14 |
Block, Inc. shows a mix of Buy, Outperform, and Overweight ratings, with a recent Underweight rating from Piper Sandler, indicating some divergence in analyst views.
MongoDB, Inc. Grades
Below is a summary of recent grade actions from reputable analysts for MongoDB, Inc.:
| Grading Company | Action | New Grade | Date |
|---|---|---|---|
| Needham | Maintain | Buy | 2026-01-12 |
| Barclays | Maintain | Overweight | 2026-01-12 |
| Truist Securities | Maintain | Buy | 2026-01-07 |
| Needham | Maintain | Buy | 2026-01-06 |
| RBC Capital | Maintain | Outperform | 2026-01-05 |
| Argus Research | Maintain | Buy | 2025-12-04 |
| Citigroup | Maintain | Buy | 2025-12-03 |
| Goldman Sachs | Maintain | Buy | 2025-12-03 |
| Canaccord Genuity | Maintain | Buy | 2025-12-02 |
| Morgan Stanley | Maintain | Overweight | 2025-12-02 |
MongoDB, Inc. consistently receives Buy and Overweight ratings, demonstrating strong analyst support without any recent negative outlooks.
Which company has the best grades?
MongoDB, Inc. has received predominantly Buy and Overweight ratings from multiple well-known firms, compared to Block, Inc.’s more mixed grades including an Underweight. This suggests MongoDB is viewed more favorably by analysts, potentially reflecting higher confidence or stronger expected performance, which may influence investor sentiment accordingly.
Strengths and Weaknesses
Below is a comparison table highlighting the key strengths and weaknesses of Block, Inc. (XYZ) and MongoDB, Inc. (MDB) based on their recent financial and operational data.
| Criterion | Block, Inc. (XYZ) | MongoDB, Inc. (MDB) |
|---|---|---|
| Diversification | Highly diversified with strong revenue from Software/Data Products ($7.16B), Cryptocurrency Assets ($10.2B), Transactions ($6.61B), and Hardware ($143M). | Less diversified; revenue concentrated in MongoDB Atlas ($1.41B) and Other Subscription ($539M). |
| Profitability | Moderate net margin (12.01%) and neutral ROE (13.62%); ROIC low (3.03%) and below WACC (14.27%), indicating value destruction but improving profitability. | Negative net margin (-6.43%) and negative ROE (-4.64%); ROIC (-7.36%) below WACC (10.35%), showing value destruction despite strong ROIC growth. |
| Innovation | Consistent investment in software and data services; growing ROIC trend (+13.7%) suggests improving efficiency. | High innovation focus on cloud database services (MongoDB Atlas); very strong ROIC growth (+62.9%) despite current profitability challenges. |
| Global presence | Strong global reach supported by diverse product lines and cryptocurrency exposure. | Expanding global footprint mainly through cloud services, but less diversified internationally. |
| Market Share | Significant presence in financial technology and cryptocurrency transaction markets. | Leading position in cloud database market with growing subscription base. |
Key takeaways: Block, Inc. shows a well-diversified business with improving profitability despite current value destruction, making it more stable. MongoDB, Inc. is highly innovative with rapid growth in its core cloud services but faces profitability and value creation challenges, indicating higher risk and potential reward. Investors should weigh diversification and current profitability against growth prospects and innovation when deciding.
Risk Analysis
Below is a comparative table of key risks for Block, Inc. (XYZ) and MongoDB, Inc. (MDB) based on the most recent data available from 2025-2026.
| Metric | Block, Inc. (XYZ) | MongoDB, Inc. (MDB) |
|---|---|---|
| Market Risk | High beta (2.67) indicates elevated market volatility risk | Moderate beta (1.38) shows moderate market sensitivity |
| Debt Level | Moderate debt-to-equity (0.37), manageable leverage | Very low debt-to-equity (0.01), minimal leverage risk |
| Regulatory Risk | Operating in multiple countries with payment processing regulations | Cloud and data services subject to evolving privacy laws |
| Operational Risk | Complexity in hardware and software integration | Dependence on cloud infrastructure and software updates |
| Environmental Risk | Moderate, with growing focus on sustainable practices | Low, primarily software-based with limited physical footprint |
| Geopolitical Risk | Exposure in US, Canada, Japan, EU markets amid trade tensions | Concentrated in US, some international exposure, less diversified |
The most significant risks are market volatility for Block, Inc., driven by its high beta, and persistent negative profitability for MongoDB, which faces operational challenges reflected in unfavorable financial ratios. Block’s moderate leverage and diversified markets somewhat mitigate debt and geopolitical risks. MongoDB’s low debt reduces financial risk, but its ongoing losses and regulatory environment pose notable investment risks.
Which Stock to Choose?
Block, Inc. (XYZ) shows a favorable income evolution with a 10.06% revenue growth in 2024 and strong profitability, including a 12.01% net margin. Its financial ratios are slightly favorable overall, with good liquidity and manageable debt, supported by a very favorable B+ rating. However, its ROIC is below WACC, indicating value destruction despite improving profitability.
MongoDB, Inc. (MDB) has a higher revenue growth of 19.22% in 2025 but reports negative profitability metrics, including a -6.43% net margin and unfavorable financial ratios overall. It maintains low debt levels and a very favorable C rating but also shows ROIC below WACC, signaling value destruction despite a growing ROIC trend.
For investors focused on balanced profitability and financial stability, Block, Inc. might appear more favorable given its stronger income statement and financial ratios. Conversely, those prioritizing growth potential in a company with improving profitability trends but facing profitability challenges may find MongoDB’s profile more aligned with their risk tolerance.
Disclaimer: Investment carries a risk of loss of initial capital. The past performance is not a reliable indicator of future results. Be sure to understand risks before making an investment decision.
Go Further
I encourage you to read the complete analyses of Block, Inc. and MongoDB, Inc. to enhance your investment decisions: