Home > Comparison > Technology > FTNT vs XYZ
The strategic rivalry between Fortinet, Inc. and Block, Inc. shapes the future of the technology sector. Fortinet operates as a capital-intensive cybersecurity infrastructure provider, while Block excels as an innovative software-driven payments and commerce platform. This head-to-head contrasts Fortinet’s enterprise security focus with Block’s growth-oriented fintech model. This analysis aims to determine which company offers the superior risk-adjusted return profile for a diversified portfolio in today’s dynamic tech landscape.
Table of contents
Companies Overview
Fortinet and Block stand as pivotal players in the software infrastructure landscape, shaping cybersecurity and payment solutions globally.
Fortinet, Inc.: Cybersecurity Powerhouse
Fortinet commands the cybersecurity market with its broad, integrated security solutions. Its revenue stems from selling FortiGate hardware and software licenses that secure networks across multiple industries. In 2026, Fortinet intensifies focus on automated threat detection and scalable network management to capture enterprise demand for robust cyber defense.
Block, Inc.: Payment Innovation Leader
Block thrives as a leading provider of payment processing hardware and software for merchants worldwide. It generates revenue through point-of-sale devices and subscription-based software services. Block’s 2026 strategy centers on expanding its Cash App ecosystem and enhancing developer tools to deepen merchant and consumer engagement.
Strategic Collision: Similarities & Divergences
Both companies excel in technology infrastructure but diverge in business philosophy: Fortinet pursues a closed, security-driven ecosystem, while Block champions an open platform for payments and commerce. Their key battleground is the evolving digital transaction space, where security and seamless payment converge. Fortinet offers a defensive moat in cybersecurity; Block presents high growth potential with a volatile beta profile.
Income Statement Comparison
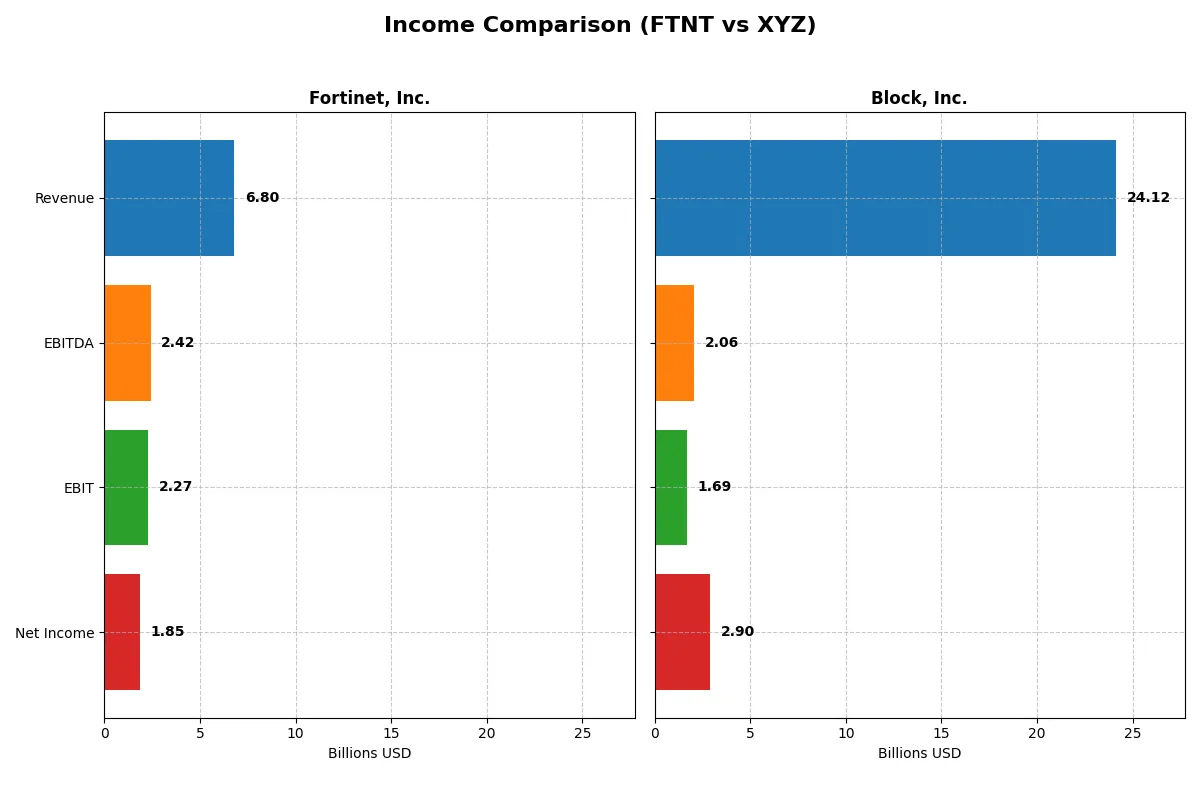
This data dissects the core profitability and scalability of both corporate engines to reveal who dominates the bottom line:
| Metric | Fortinet, Inc. (FTNT) | Block, Inc. (XYZ) |
|---|---|---|
| Revenue | 6.8B | 24.1B |
| Cost of Revenue | 1.3B | 15.2B |
| Operating Expenses | 3.4B | 8.0B |
| Gross Profit | 5.5B | 8.9B |
| EBITDA | 2.4B | 2.1B |
| EBIT | 2.3B | 1.7B |
| Interest Expense | 20M | 9.3M |
| Net Income | 1.9B | 2.9B |
| EPS | 2.44 | 4.70 |
| Fiscal Year | 2025 | 2024 |
Income Statement Analysis: The Bottom-Line Duel
This income statement comparison reveals which company runs a more efficient and profitable corporate engine over recent years.
Fortinet, Inc. Analysis
Fortinet’s revenue surged from 3.3B in 2021 to nearly 6.8B in 2025, more than doubling its scale. Net income followed suit, nearly tripling to 1.85B. The company sustains strong gross margins above 80%, with a healthy net margin of 27.3%. Despite a slight dip in net margin growth last year, Fortinet’s operational momentum remains robust and efficient.
Block, Inc. Analysis
Block’s revenue climbed from 9.5B in 2020 to 24.1B in 2024, an impressive 154% growth. Net income swung from a loss of -540M in 2022 to a profit of 2.9B in 2024. Its gross margin sits at a modest 36.9%, with a net margin of 12%. The latest year shows remarkable EBIT and net margin expansion, signaling a strong operational turnaround.
Margin Strength vs. Revenue Expansion
Fortinet leads in profitability with a superior gross and net margin profile, reflecting operational efficiency. Block excels in revenue scale and rapid margin recovery but remains less efficient. For investors prioritizing consistent margin power, Fortinet’s profile offers greater fundamental strength. Block appeals more to those seeking high growth momentum with improving profitability.
Financial Ratios Comparison
These vital ratios act as a diagnostic tool to expose the underlying fiscal health, valuation premiums, and capital efficiency of the companies compared below:
| Ratios | Fortinet, Inc. (FTNT) | Block, Inc. (XYZ) |
|---|---|---|
| ROE | 1.50 | 0.14 |
| ROIC | 0.29 | 0.03 |
| P/E | 32.48 | 18.10 |
| P/B | 48.64 | 2.47 |
| Current Ratio | 1.17 | 2.33 |
| Quick Ratio | 1.09 | 2.31 |
| D/E | 0.81 | 0.37 |
| Debt-to-Assets | 0.10 | 0.22 |
| Interest Coverage | 103.72 | 95.93 |
| Asset Turnover | 0.65 | 0.66 |
| Fixed Asset Turnover | 4.20 | 45.14 |
| Payout ratio | 0 | 0 |
| Dividend yield | 0 | 0 |
| Fiscal Year | 2025 | 2024 |
Efficiency & Valuation Duel: The Vital Signs
Financial ratios act as the company’s DNA, uncovering hidden risks and revealing operational excellence critical to investor decisions.
Fortinet, Inc.
Fortinet delivers exceptional profitability with a 150% ROE and a strong 27.3% net margin, signaling operational efficiency. However, its valuation looks stretched, trading at a P/E of 32.5 and a P/B of 48.6. The absence of dividends suggests reinvestment priorities in growth and R&D, fueling future expansion.
Block, Inc.
Block shows moderate profitability, with a 13.6% ROE and a 12% net margin reflecting stable but less robust returns. Its valuation is more balanced at a P/E of 18.1 and P/B of 2.5, indicating fair pricing. Like Fortinet, it pays no dividend, focusing capital on innovation and scaling its business.
Premium Valuation vs. Operational Safety
Fortinet’s high profitability comes with a premium valuation, implying higher risk for stretched multiples. Block offers a steadier valuation but with lower returns. Investors seeking growth may lean toward Fortinet’s operational strength, while those valuing stability might prefer Block’s more conservative profile.
Which one offers the Superior Shareholder Reward?
Fortinet, Inc. (FTNT) and Block, Inc. (XYZ) both eschew dividends, focusing instead on reinvestment and buybacks. FTNT’s free cash flow per share stands at 2.46–2.94 with no dividend payout, signaling reinvestment in growth and buybacks. XYZ also pays no dividends but has a slightly lower free cash flow per share (~2.52) and a modest buyback program. FTNT’s payout strategy is more sustainable, supported by robust operating margins (~30%), strong free cash flow coverage (~83–86%), and disciplined capital allocation. XYZ’s lower operating margins (~7%) and weaker cash flow ratios raise concerns on buyback sustainability. I conclude FTNT offers a superior total shareholder return profile in 2026 due to stronger cash flow generation and a more durable buyback strategy.
Comparative Score Analysis: The Strategic Profile
The radar chart reveals the core financial DNA and trade-offs shaping Fortinet, Inc. and Block, Inc.’s competitive positioning:
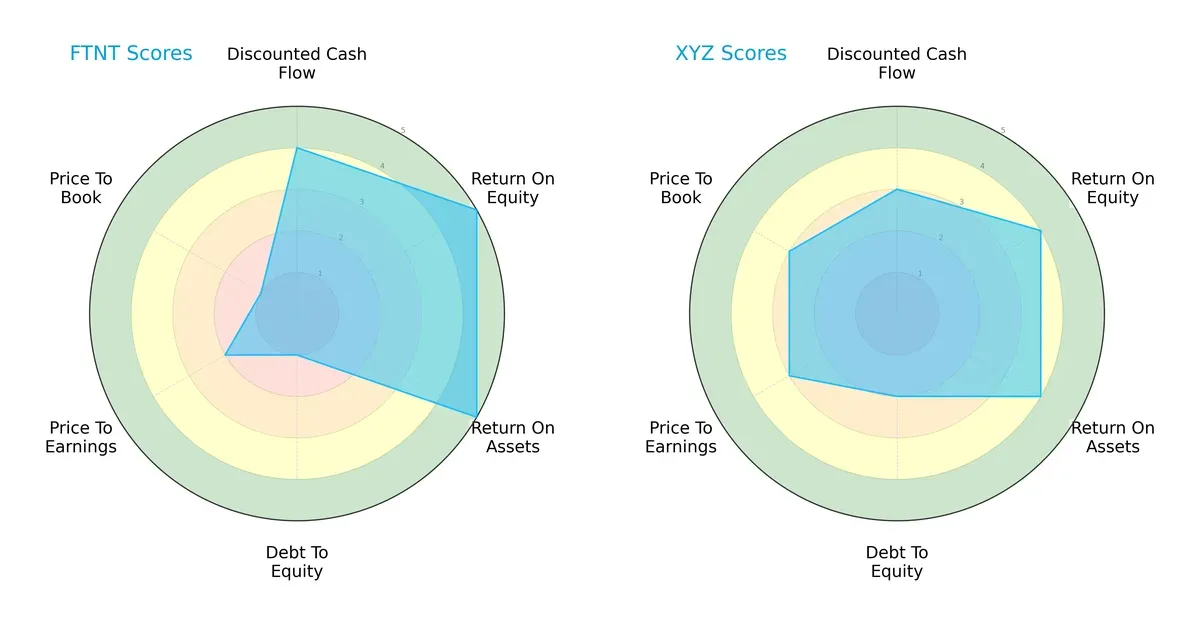
Fortinet excels with very favorable ROE and ROA scores (5 each), signaling superior profit generation and asset efficiency. However, its debt-to-equity and valuation metrics lag severely, with very unfavorable scores (1), indicating high leverage risk and potential overvaluation. Block presents a more balanced profile, with moderate to favorable scores across DCF (3), ROE (4), ROA (4), and valuation metrics (P/E 3, P/B 3). Its moderate debt score (2) suggests less financial stress than Fortinet. I see Fortinet relying heavily on operational excellence while Block maintains steadier financial stability and valuation discipline.
Bankruptcy Risk: Solvency Showdown
Fortinet’s Altman Z-Score of 5.49 places it securely in the safe zone, whereas Block’s 2.51 sits in the grey zone, signaling elevated bankruptcy risk in uncertain markets:
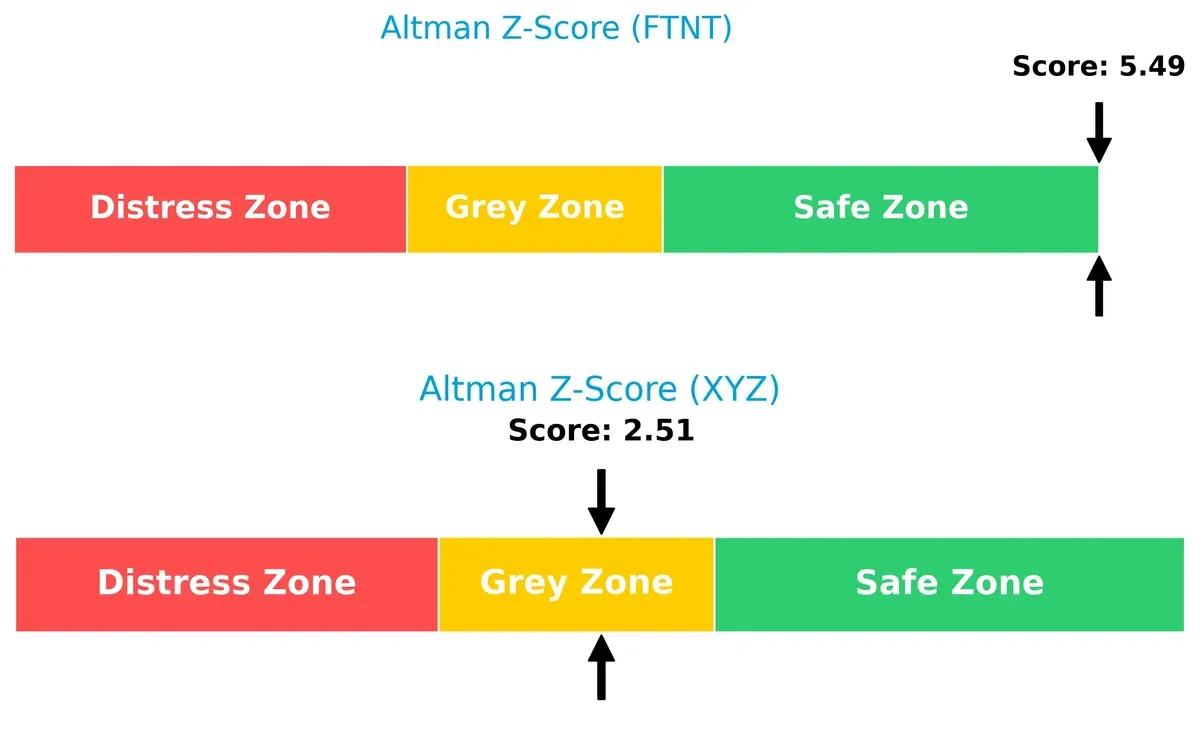
Fortinet’s superior solvency suggests resilience through economic cycles. Block’s moderate score warns investors to watch for potential distress if market conditions deteriorate.
Financial Health: Quality of Operations
Both companies share an identical Piotroski F-Score of 6, reflecting average financial health without glaring red flags:
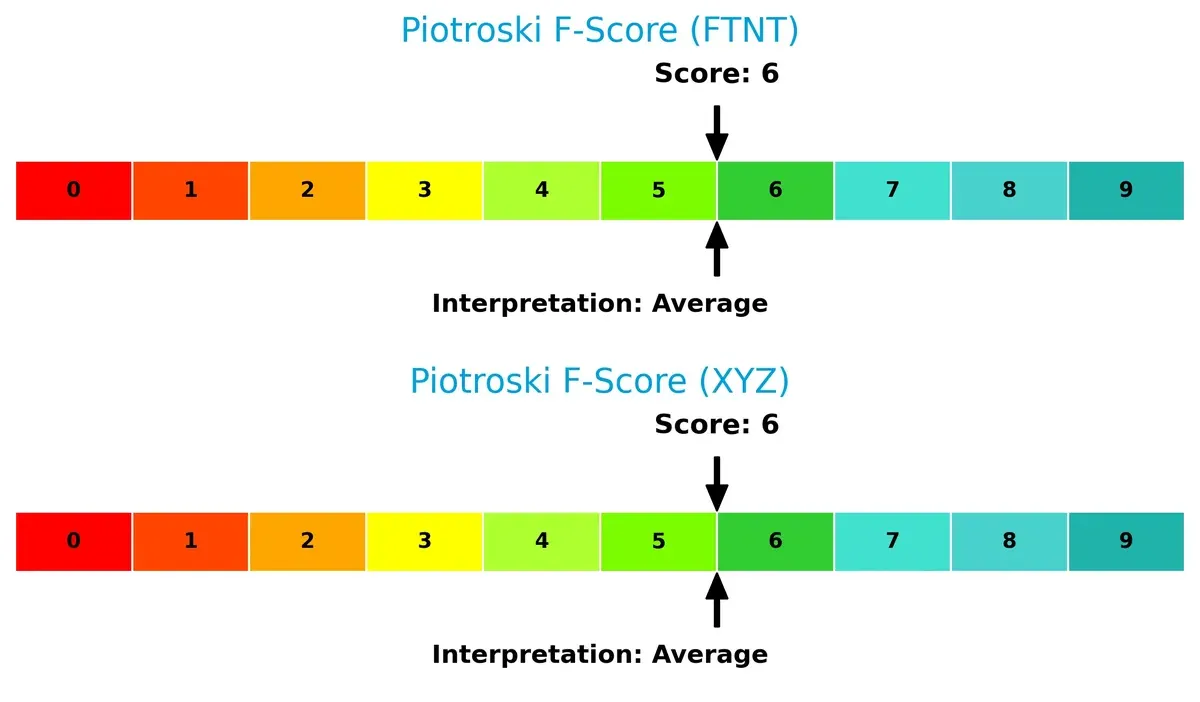
This parity indicates neither firm currently signals significant internal weaknesses, but neither stands out as a peak performer. Investors should monitor operational efficiency improvements to differentiate future prospects.
How are the two companies positioned?
This section dissects Fortinet and Block’s operational DNA by comparing revenue distribution and internal strengths and weaknesses. The goal is to confront their economic moats and reveal which business model sustains a more resilient competitive advantage today.
Revenue Segmentation: The Strategic Mix
This comparison dissects how Fortinet, Inc. and Block, Inc. diversify income streams and where their primary sector bets lie:
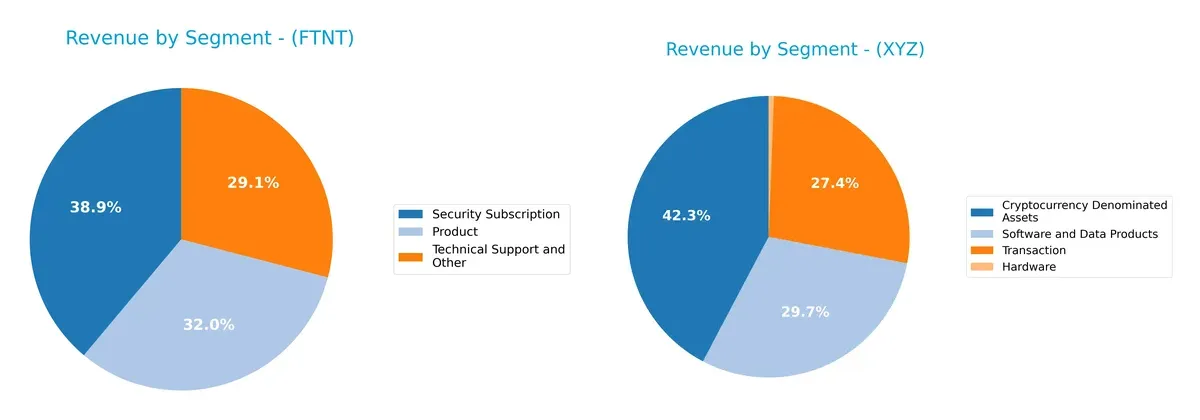
Fortinet balances revenue across Security Subscription ($2.3B), Product ($1.9B), and Technical Support ($1.7B), showing strong diversification. Block leans heavily on Cryptocurrency Denominated Assets ($10.2B) and Transaction services ($6.6B), with smaller Hardware ($143M) and Software ($7.2B). Fortinet’s mix mitigates concentration risk, while Block pivots on crypto exposure, indicating higher volatility but potential ecosystem lock-in.
Strengths and Weaknesses Comparison
This table compares the Strengths and Weaknesses of Fortinet, Inc. and Block, Inc.:
Fortinet Strengths
- Diversified revenue streams across products, subscriptions, and support
- Strong profitability with 27.26% net margin and 149.77% ROE
- Favorable liquidity ratios with quick ratio at 1.09
- Low debt-to-assets ratio at 9.59% supports financial stability
- Solid global presence with balanced revenues in Americas, EMEA, and Asia Pacific
- Consistent asset turnover and fixed asset efficiency
Block Strengths
- Large revenue scale in software, crypto assets, hardware, and transactions
- Favorable liquidity with current and quick ratios above 2
- Very high fixed asset turnover at 45.14 indicates efficient use of assets
- Strong interest coverage at 181.31 bolsters debt service capacity
- Geographic concentration in the US with substantial revenue base
- Moderate profitability with 12.01% net margin and neutral ROE
Fortinet Weaknesses
- High price-to-book ratio at 48.64 and PE of 32.48 suggest overvaluation risk
- No dividend yield limits income appeal
- Moderate current ratio at 1.17 may constrain short-term flexibility
- Asset turnover is neutral at 0.65, indicating room for improvement
- WACC slightly below ROIC but neutral status signals cautious capital cost management
- Limited growth signals in debt-to-equity ratio at 0.81
Block Weaknesses
- Low ROIC at 3.03% well below WACC of 13.92% indicates value destruction
- No dividend yield affects income investors
- Higher debt-to-assets ratio at 21.53% raises leverage concerns
- PE and PB ratios are neutral, reflecting market uncertainty
- Geographic concentration in the US limits global diversification
- Moderate ROE at 13.62% signals weaker profitability
Fortinet exhibits strong profitability and balanced global diversification but faces valuation concerns and limited dividend appeal. Block shows scale and liquidity strengths but struggles with low capital returns and geographic concentration. These contrasts shape their strategic priorities toward value creation and market expansion respectively.
The Moat Duel: Analyzing Competitive Defensibility
A structural moat is the sole fortress defending long-term profits from relentless competition erosion. Let’s dissect each company’s fortress:
Fortinet, Inc.: Intangible Assets and Integration Moat
Fortinet’s moat springs from its broad, integrated cybersecurity platform, driving high ROIC (~20% above WACC) and margin resilience. Expanding AI-driven security tools in 2026 should deepen this moat.
Block, Inc.: Network Effects and Ecosystem Moat
Block leverages network effects via its payment hardware and Cash App ecosystem, but its negative ROIC vs. WACC signals value destruction despite rising profitability. Scaling fintech services globally offers growth but heightens competitive risks.
Verdict: Integration Moat vs. Network Effect Moat
Fortinet’s wider, value-creating moat outmatches Block’s struggling competitive edge. I see Fortinet better positioned to defend market share amid intensifying sector disruption.
Which stock offers better returns?
The past year shows Fortinet’s strong price rise contrasting with Block’s significant decline, marked by decelerating momentum in both stocks.
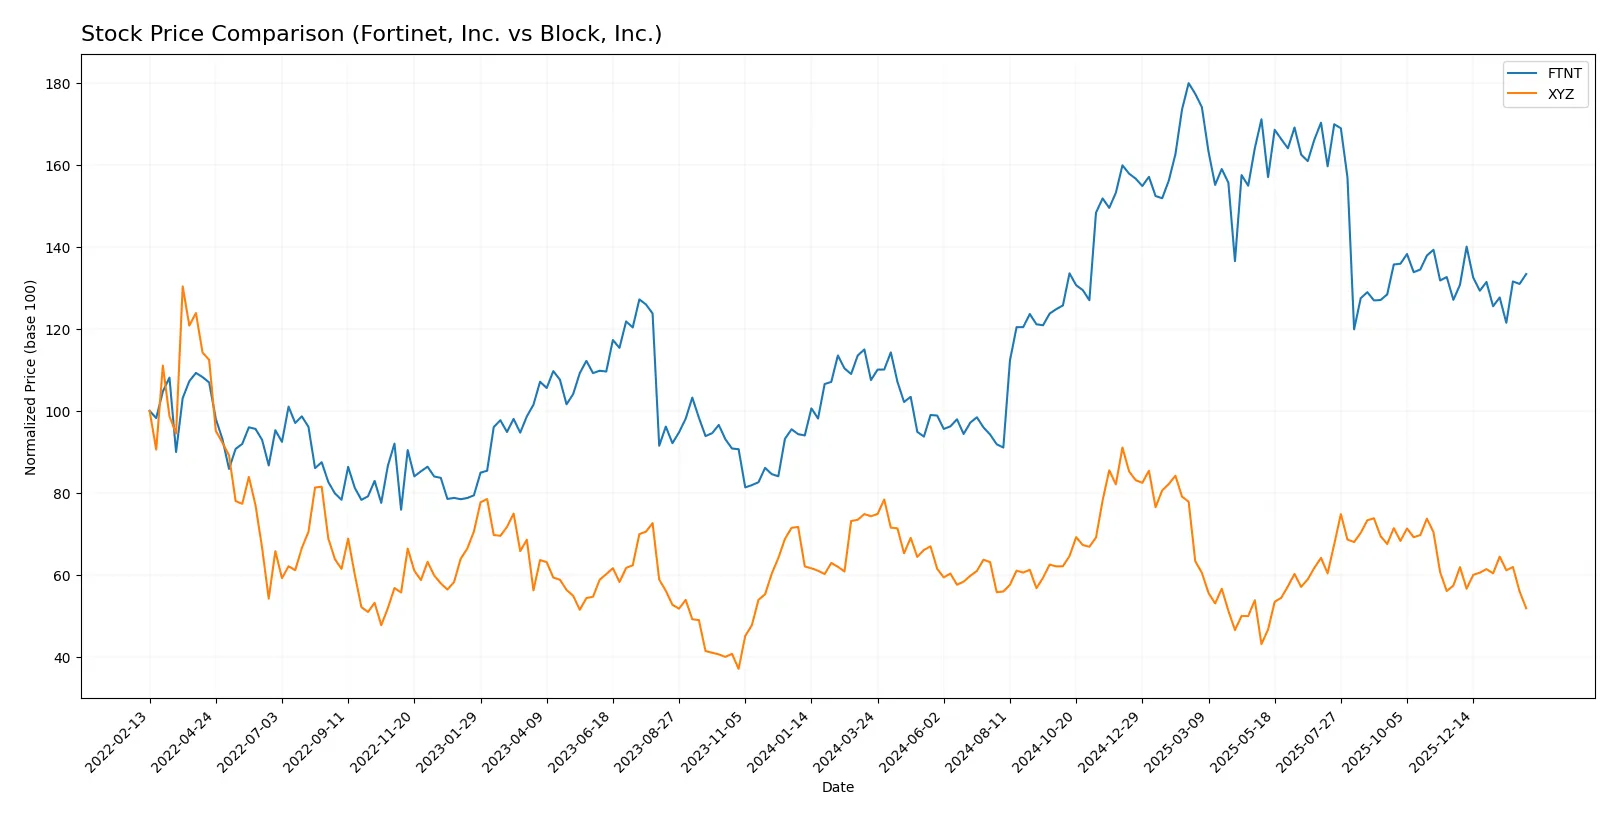
Trend Comparison
Fortinet, Inc. posted a 24.04% price increase over the last 12 months, signaling a bullish trend despite decelerating momentum and notable volatility (15.07 std deviation).
Block, Inc. experienced a 30.19% price drop over the same period, confirming a bearish trend with deceleration and moderate volatility (10.46 std deviation).
Fortinet’s bullish trend contrasts with Block’s bearish slide, delivering the highest market return among the two in the past year.
Target Prices
Analysts present a cautiously optimistic target consensus for Fortinet, Inc. and Block, Inc.
| Company | Target Low | Target High | Consensus |
|---|---|---|---|
| Fortinet, Inc. | 70 | 90 | 85 |
| Block, Inc. | 72 | 100 | 86.56 |
The target consensus for both companies exceeds current prices, signaling expected upside. Fortinet’s $85 target compares to $82.76 stock price, while Block’s $86.56 target is well above its $55.96 price.

Don’t Let Luck Decide Your Entry Point
Optimize your entry points with our advanced ProRealTime indicators. You’ll get efficient buy signals with precise price targets for maximum performance. Start outperforming now!
How do institutions grade them?
Fortinet, Inc. Grades
The table below summarizes recent institutional grades for Fortinet, Inc.:
| Grading Company | Action | New Grade | Date |
|---|---|---|---|
| Rosenblatt | maintain | Buy | 2026-02-06 |
| Mizuho | maintain | Underperform | 2026-02-06 |
| JP Morgan | maintain | Underweight | 2026-02-06 |
| RBC Capital | maintain | Sector Perform | 2026-02-06 |
| Wedbush | maintain | Outperform | 2026-02-06 |
| Scotiabank | downgrade | Sector Perform | 2026-02-02 |
| JP Morgan | maintain | Underweight | 2026-01-30 |
| Rosenblatt | upgrade | Buy | 2026-01-29 |
| TD Cowen | upgrade | Buy | 2026-01-23 |
| Citigroup | maintain | Neutral | 2026-01-13 |
Block, Inc. Grades
The table below summarizes recent institutional grades for Block, Inc.:
| Grading Company | Action | New Grade | Date |
|---|---|---|---|
| Citigroup | maintain | Buy | 2026-02-05 |
| Piper Sandler | maintain | Underweight | 2026-01-14 |
| Keefe, Bruyette & Woods | maintain | Outperform | 2026-01-02 |
| Needham | maintain | Buy | 2025-11-24 |
| B of A Securities | maintain | Buy | 2025-11-21 |
| Morgan Stanley | maintain | Equal Weight | 2025-11-21 |
| Mizuho | maintain | Outperform | 2025-11-20 |
| RBC Capital | maintain | Outperform | 2025-11-20 |
| Stephens & Co. | maintain | Overweight | 2025-11-20 |
| BTIG | maintain | Buy | 2025-11-20 |
Which company has the best grades?
Block, Inc. consistently receives more positive grades such as Buy and Outperform from multiple firms. Fortinet shows a mix of Buy and Underperform ratings. This divergence may influence investors’ perception of relative momentum and risk.
Risks specific to each company
The following categories identify critical pressure points and systemic threats facing Fortinet, Inc. and Block, Inc. in the 2026 market environment:
1. Market & Competition
Fortinet, Inc.
- Operates in a highly competitive cybersecurity market with rapid innovation, facing pressure from established firms and startups.
Block, Inc.
- Faces intense competition in payment solutions and fintech from global and niche players, requiring constant innovation.
2. Capital Structure & Debt
Fortinet, Inc.
- Moderate leverage (D/E 0.81) with strong interest coverage (113x), indicating manageable debt risk.
Block, Inc.
- Lower leverage (D/E 0.37) and very strong interest coverage (181x), reflecting a conservative capital structure.
3. Stock Volatility
Fortinet, Inc.
- Beta of 1.05 suggests volatility close to the market, indicating moderate stock price swings.
Block, Inc.
- Higher beta of 2.67 signals significant price volatility, increasing investment risk.
4. Regulatory & Legal
Fortinet, Inc.
- Cybersecurity regulations and data privacy laws globally may increase compliance costs and legal risks.
Block, Inc.
- Financial regulations and consumer data protection laws impose compliance burdens and legal exposure.
5. Supply Chain & Operations
Fortinet, Inc.
- Relies on hardware and software supply chains that face risks from geopolitical disruptions and component shortages.
Block, Inc.
- Depends on hardware manufacturing and software platforms vulnerable to supply chain delays and operational scaling challenges.
6. ESG & Climate Transition
Fortinet, Inc.
- Faces pressure to enhance ESG disclosures and reduce carbon footprint in data centers and manufacturing.
Block, Inc.
- ESG demands focus on sustainable fintech practices and data privacy, with growing investor scrutiny.
7. Geopolitical Exposure
Fortinet, Inc.
- Global footprint exposes it to geopolitical tensions affecting international sales and supply chains.
Block, Inc.
- International operations in multiple countries subject it to geopolitical risks impacting payments and regulatory environments.
Which company shows a better risk-adjusted profile?
Fortinet’s primary risk is market competition amid rapid cybersecurity innovation. Block’s greatest vulnerability lies in its elevated stock volatility and geopolitical exposure. Fortinet benefits from a stronger capital structure and lower beta, delivering a more balanced risk-return profile in 2026. Block’s higher beta and regulatory complexity increase risk despite solid liquidity. Fortinet’s Altman Z-score of 5.49 confirms financial safety, while Block’s 2.51 signals moderate distress risk. This contrast justifies caution toward Block’s stock volatility and leverage dynamics.
Final Verdict: Which stock to choose?
Fortinet’s superpower lies in its robust and growing economic moat, delivering high returns on invested capital well above its cost of capital. It efficiently converts revenue into profit with consistent operational strength. The point of vigilance remains its stretched valuation multiples, which could pressure returns if growth slows. Fortinet suits investors targeting aggressive growth with a tolerance for premium pricing.
Block, Inc. stands out for its strategic moat rooted in recurring revenue streams and strong liquidity, reflected in a solid current ratio and manageable debt. While its profitability metrics trail Fortinet’s, its valuation appears more reasonable, offering a safer investment profile. Block fits well in growth-at-a-reasonable-price (GARP) portfolios that favor stability alongside growth potential.
If you prioritize high-return growth driven by a sustainable competitive advantage, Fortinet is the compelling choice due to its superior capital efficiency and margin profile. However, if you seek a more conservative growth strategy with better liquidity and valuation safety, Block offers better stability despite lower profitability. Each scenario aligns with distinct risk tolerances and investment time horizons.
Disclaimer: Investment carries a risk of loss of initial capital. The past performance is not a reliable indicator of future results. Be sure to understand risks before making an investment decision.
Go Further
I encourage you to read the complete analyses of Fortinet, Inc. and Block, Inc. to enhance your investment decisions: