Home > Comparison > Technology > XYZ vs FFIV
The strategic rivalry between Block, Inc. and F5, Inc. shapes the evolving landscape of the technology sector. Block, a dynamic software infrastructure provider, focuses on integrated payment solutions and merchant tools. F5, a specialized software infrastructure firm, delivers advanced multi-cloud application security and delivery. This analysis pits Block’s growth-driven model against F5’s enterprise-focused approach to identify which offers a superior risk-adjusted return for a diversified portfolio.
Table of contents
Companies Overview
Block, Inc. and F5, Inc. are pivotal players shaping the software infrastructure landscape in 2026.
Block, Inc.: Payment Solutions Innovator
Block, Inc. stands as a leading software infrastructure provider specializing in payment acceptance tools and analytics. Its core revenue streams derive from hardware devices like Magstripe and Contactless readers, alongside integrated software solutions such as Square Point of Sale and Cash App. In 2026, Block focuses strategically on expanding its global footprint and enhancing seamless digital payments across multiple countries.
F5, Inc.: Multi-Cloud Security Specialist
F5, Inc. operates as a prominent multi-cloud application security and delivery vendor. It generates revenue by offering advanced hardware-software hybrid products like BIG-IP appliances and NGINX software, catering to enterprise and public sector clients. The company’s 2026 strategy emphasizes robust multi-cloud security solutions that ensure application performance and protection across diverse architectures.
Strategic Collision: Similarities & Divergences
Both companies anchor their strength in software infrastructure but diverge in focus—Block prioritizes payment ecosystems, while F5 centers on network and application security. Their primary battleground is enterprise digital transformation, where seamless payments meet secure cloud delivery. This contrast defines their distinct investment profiles: Block drives rapid consumer adoption, whereas F5 bets on technical enterprise resilience.
Income Statement Comparison
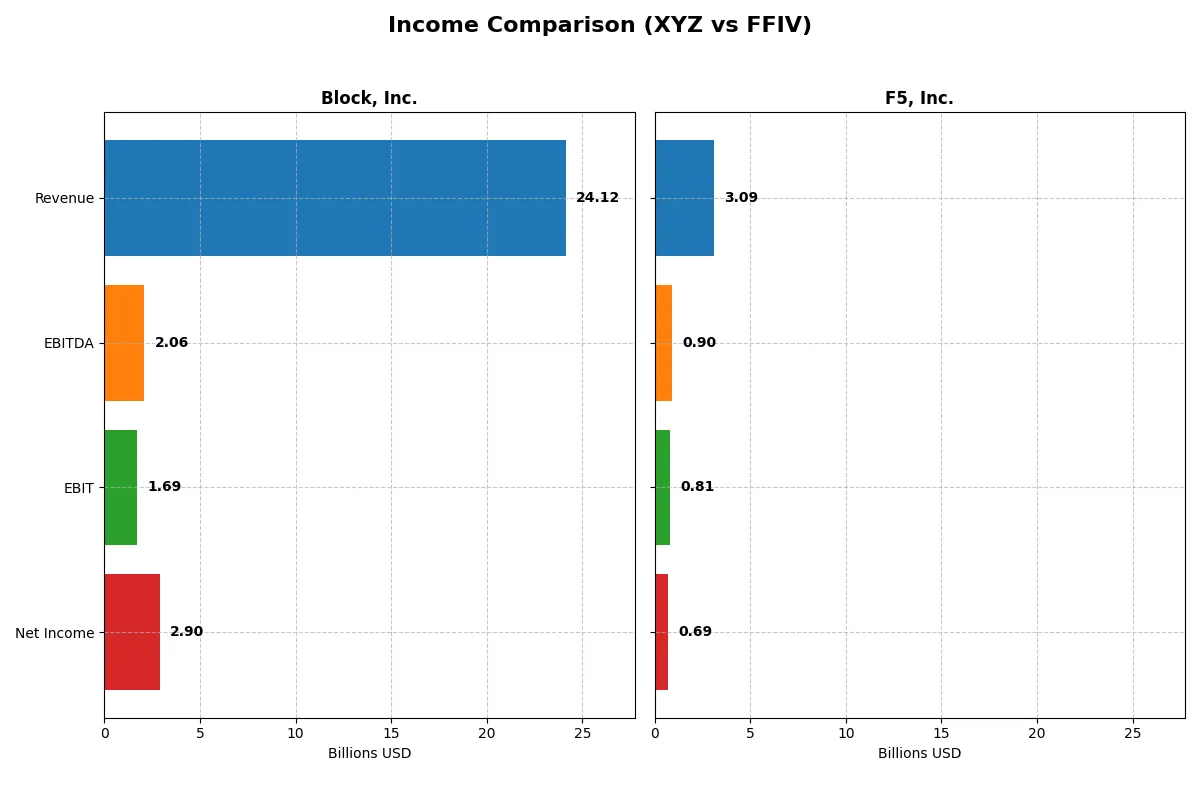
This data dissects the core profitability and scalability of both corporate engines to reveal who dominates the bottom line:
| Metric | Block, Inc. (XYZ) | F5, Inc. (FFIV) |
|---|---|---|
| Revenue | 24.1B | 3.1B |
| Cost of Revenue | 15.2B | 564M |
| Operating Expenses | 8.0B | 1.76B |
| Gross Profit | 8.9B | 2.52B |
| EBITDA | 2.06B | 901M |
| EBIT | 1.69B | 808M |
| Interest Expense | 9.3M | 0 |
| Net Income | 2.9B | 692M |
| EPS | 4.70 | 11.95 |
| Fiscal Year | 2024 | 2025 |
Income Statement Analysis: The Bottom-Line Duel
This income statement comparison reveals which company operates with superior efficiency and sustainable profitability in their respective markets.
Block, Inc. Analysis
Block, Inc. demonstrates a strong revenue growth from $9.5B in 2020 to $24.1B in 2024, paralleled by a net income surge from $213M to $2.9B. Its gross margin improves to 36.9%, reflecting enhanced cost control. The net margin at 12% in 2024 marks a robust profitability jump, driven by a 5,887% EBIT growth, signaling accelerating operational momentum despite rising operating expenses.
F5, Inc. Analysis
F5, Inc. steadily grows revenue from $2.6B in 2021 to $3.1B in 2025, with net income climbing from $331M to $692M. It commands a high gross margin of 81.7% and a strong net margin of 22.4%, indicating efficient cost management and premium pricing power. EBIT margin at 26.2% in 2025 underscores consistent operational strength, supported by steady EPS growth of 23.7% year-over-year.
Margin Excellence vs. Scale Momentum
F5, Inc. excels in margin quality, sustaining superior profitability ratios that reflect a solid moat and operational discipline. Block, Inc. drives remarkable revenue and net income growth fueled by rapid expansion, yet with thinner margins. Investors favoring robust margins and steady returns may prefer F5, while those focused on high growth potential might lean toward Block’s dynamic scale.
Financial Ratios Comparison
These vital ratios act as a diagnostic tool to expose the underlying fiscal health, valuation premiums, and capital efficiency of the companies compared below:
| Ratios | Block, Inc. (XYZ) | F5, Inc. (FFIV) |
|---|---|---|
| ROE | 13.62% | 19.28% |
| ROIC | 3.03% | 13.99% |
| P/E | 18.1 | 26.91 |
| P/B | 2.47 | 5.19 |
| Current Ratio | 2.33 | 1.56 |
| Quick Ratio | 2.31 | 1.51 |
| D/E | 0.37 | 0.06 |
| Debt-to-Assets | 21.53% | 3.65% |
| Interest Coverage | 95.93 | 0 (not reported) |
| Asset Turnover | 0.66 | 0.49 |
| Fixed Asset Turnover | 45.14 | 9.02 |
| Payout ratio | 0 | 0 |
| Dividend yield | 0 | 0 |
| Fiscal Year | 2024 | 2025 |
Efficiency & Valuation Duel: The Vital Signs
Financial ratios act as a company’s DNA, unveiling hidden risks and operational strengths essential for investment decisions.
Block, Inc.
Block displays a solid net margin of 12.01%, reflecting moderate profitability, while its ROE is neutral at 13.62%. The P/E ratio stands at 18.1, indicating a fairly valued stock. With no dividend yield, Block reinvests heavily in R&D, supporting future growth. The firm’s strong current ratio of 2.33 signals good liquidity and operational efficiency.
F5, Inc.
F5 boasts superior profitability metrics, with a net margin of 22.42% and a robust ROE of 19.28%. However, its valuation appears stretched, with a P/E of 26.91 and a high P/B of 5.19. Despite no dividend payouts, F5’s high R&D intensity drives growth. The current ratio of 1.56 remains favorable, though less conservative than Block’s liquidity.
Valuation Discipline vs. Profit Powerhouse
F5 offers stronger profitability and more favorable capital returns but at a stretched valuation and slightly lower liquidity. Block balances moderate profitability with prudent valuation and superior liquidity. Investors prioritizing growth and margins may prefer F5, while those favoring valuation discipline and operational safety find Block’s profile more fitting.
Which one offers the Superior Shareholder Reward?
Block, Inc. (XYZ) and F5, Inc. (FFIV) both forgo dividends, focusing on reinvestment and buybacks. XYZ has no dividend yield or payout, relying on R&D and growth, with a modest free cash flow per share of 2.52. FFIV also pays no dividends but boasts a strong free cash flow per share of 15.7, supported by robust operating margins (~26%) and a sustainable buyback capacity. Historically, FFIV’s capital allocation emphasizes buybacks and operational efficiency, delivering higher cash returns and margin stability. I see FFIV’s model as more sustainable and rewarding for 2026 investors, given its superior free cash flow, stronger margins, and disciplined capital deployment compared to XYZ’s riskier growth focus.
Comparative Score Analysis: The Strategic Profile
The radar chart exposes the core DNA and trade-offs of Block, Inc. and F5, Inc., highlighting their distinct financial strengths and vulnerabilities:
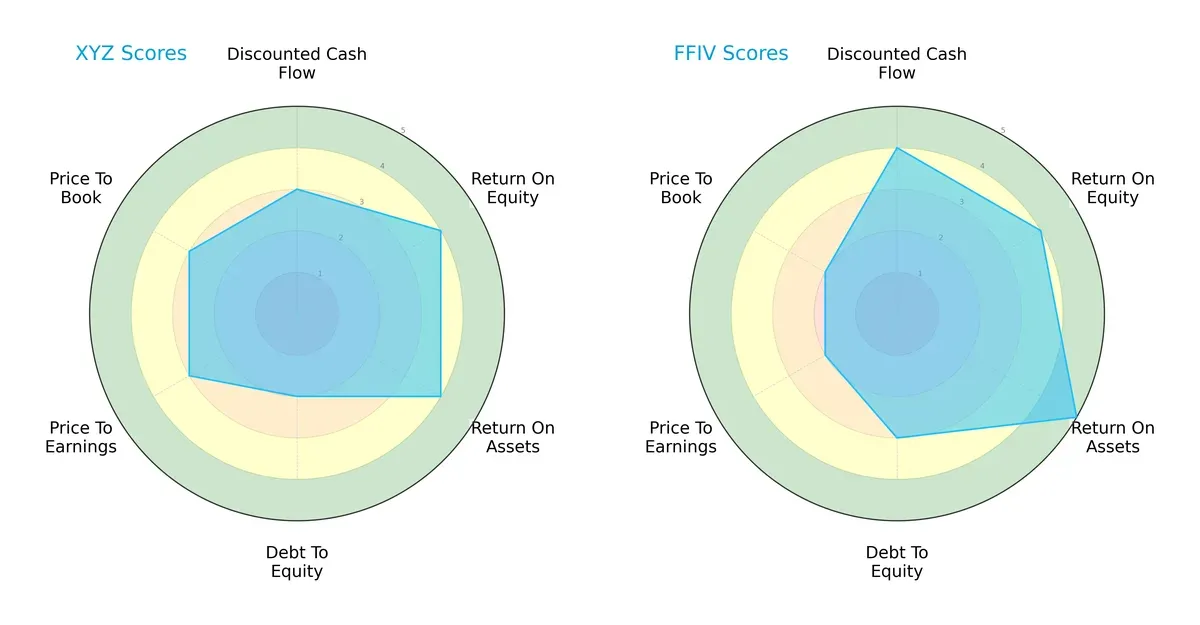
F5, Inc. outperforms with a more balanced profile, excelling in DCF (4 vs. 3), ROA (5 vs. 4), and Debt/Equity (3 vs. 2). Block, Inc. holds steady in ROE (4 each) but relies on moderate valuation scores (PE/PB both at 3) compared to F5’s slightly lower valuation appeal (2 each). F5’s stronger asset efficiency and financial leverage management give it a clear strategic edge.
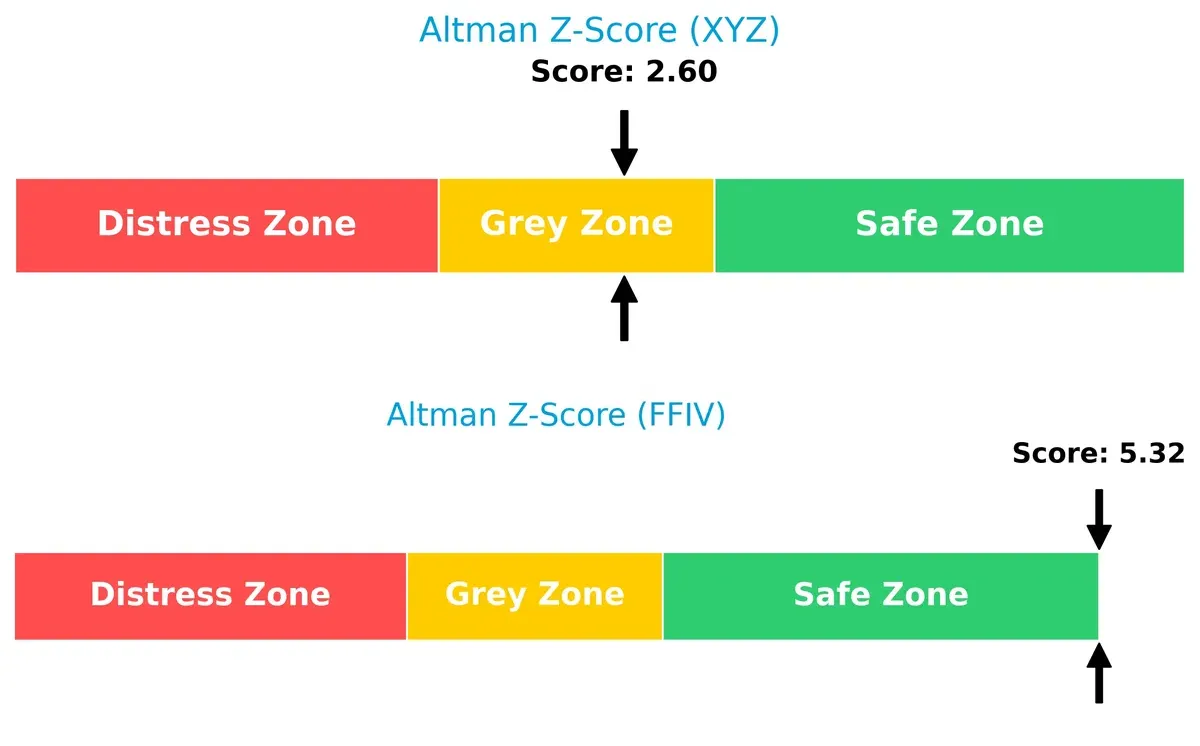
Bankruptcy Risk: Solvency Showdown
F5, Inc.’s Altman Z-Score of 5.3 firmly places it in the safe zone, signaling robust long-term solvency. Block, Inc.’s 2.6 score lands in the grey zone, implying moderate bankruptcy risk amid current market volatility:
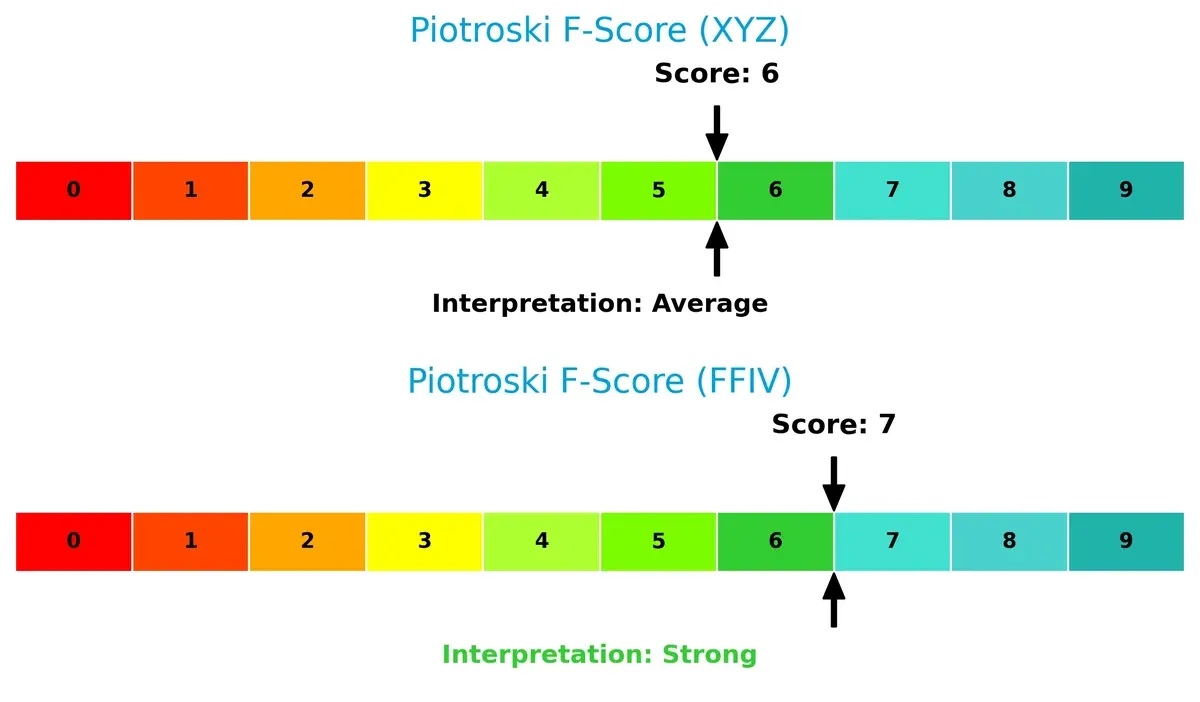
Financial Health: Quality of Operations
F5, Inc. scores a strong 7 on the Piotroski F-Score, indicating superior internal financial health. Block, Inc.’s 6, while average, suggests minor red flags in operational quality compared to F5’s more resilient metrics:
How are the two companies positioned?
This section dissects the operational DNA of Block and F5 by comparing their revenue distribution by segment alongside their internal strengths and weaknesses. The final objective is to confront their economic moats to identify which model delivers the most resilient, sustainable competitive advantage today.
Revenue Segmentation: The Strategic Mix
This visual comparison dissects how Block, Inc. and F5, Inc. diversify income streams and reveals where their primary sector bets lie:
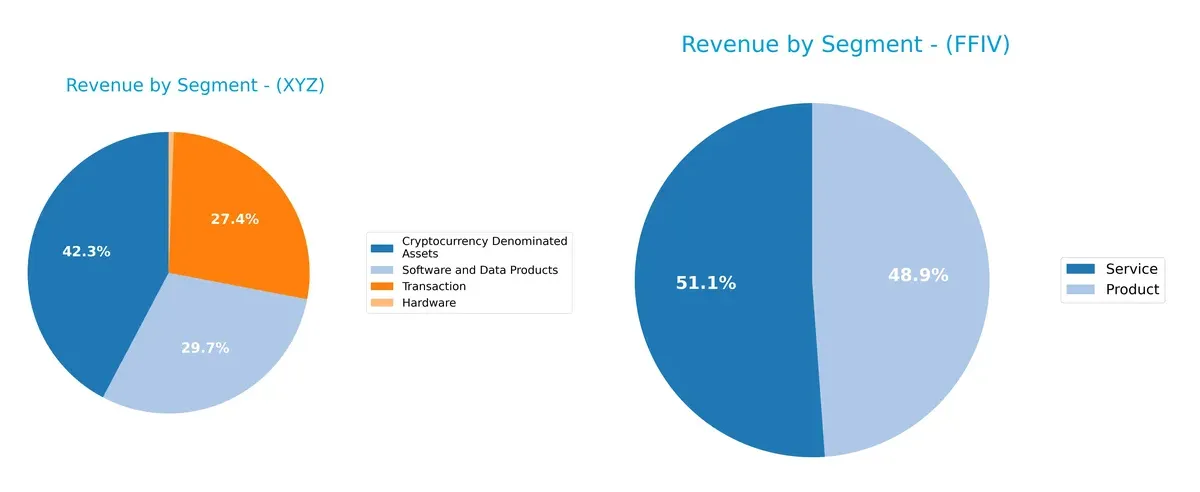
Block, Inc. anchors its revenue heavily in Cryptocurrency Denominated Assets at $10.2B, dwarfing its other segments like Software and Data Products ($7.2B) and Transactions ($6.6B). This concentration signals reliance on crypto market dynamics and potential volatility. F5, Inc. displays a balanced mix between Product ($1.5B) and Service ($1.6B) revenues, showcasing steady diversification. Block’s focus suggests ecosystem lock-in risks, while F5’s split indicates resilience through infrastructure and service integration.
Strengths and Weaknesses Comparison
This table compares the strengths and weaknesses of Block, Inc. and F5, Inc. based on diversification, profitability, financials, innovation, global presence, and market share:
Block, Inc. Strengths
- Diversified revenue across software, cryptocurrency, hardware, and transactions
- Favorable net margin at 12.01%
- Strong liquidity with current ratio 2.33
- Low debt-to-assets at 21.53%
- High interest coverage of 181.31
- Broad US market dominance with growing non-US sales
F5, Inc. Strengths
- Higher profitability with net margin 22.42% and ROE 19.28%
- Favorable ROIC at 13.99% exceeding WACC
- Low debt-to-assets at 3.65% and infinite interest coverage
- Balanced revenue from products and services
- Broad geographic diversification across Americas, Asia Pacific, and EMEA
Block, Inc. Weaknesses
- ROIC (3.03%) below WACC (14.08%) signals weak capital efficiency
- No dividend yield
- Neutral ROE and P/E valuations
- Heavy US market concentration limits global exposure
F5, Inc. Weaknesses
- Higher P/E (26.91) and P/B (5.19) ratios indicate valuation premium
- Lower asset turnover at 0.49 suggests less efficient asset use
- No dividend yield
- Slightly less liquidity with current ratio 1.56
Block, Inc. shows solid liquidity and diversification but struggles with capital returns and global reach. F5, Inc. delivers superior profitability and capital efficiency but trades at a premium valuation and has lower asset efficiency. Each company’s financial metrics reflect different strategic priorities and market positioning.
The Moat Duel: Analyzing Competitive Defensibility
A structural moat protects long-term profits from relentless competitive pressure. Without it, profits erode quickly. Let’s examine how Block, Inc. and F5, Inc. defend their profits:
Block, Inc.: Innovation-Driven Ecosystem Lock-in
Block’s primary moat stems from its integrated payment hardware and software ecosystem, creating high switching costs for sellers. Its financials show improving profitability but ROIC remains below WACC, signaling value destruction despite growth. New markets like international expansion could deepen its moat if executed well in 2026.
F5, Inc.: High-Margin Enterprise Security Advantage
F5 leverages a cost advantage through specialized multi-cloud application security with premium margins and an ROIC comfortably above WACC. Unlike Block, F5’s moat is rooted in durable value creation and rising profitability. Its expanding partnerships with top cloud providers position it well for growth and disruption in 2026.
Ecosystem Lock-in vs. Enterprise Security Dominance
F5 holds the wider and deeper moat with its consistent excess returns and robust margin profile. Block shows promise but currently destroys value. F5 is clearly better equipped to defend its market share against competitive threats.
Which stock offers better returns?
The stock price charts reveal divergent dynamics over the past 12 months, with one company showing sharp gains and the other enduring significant decline amid varying trading volumes.
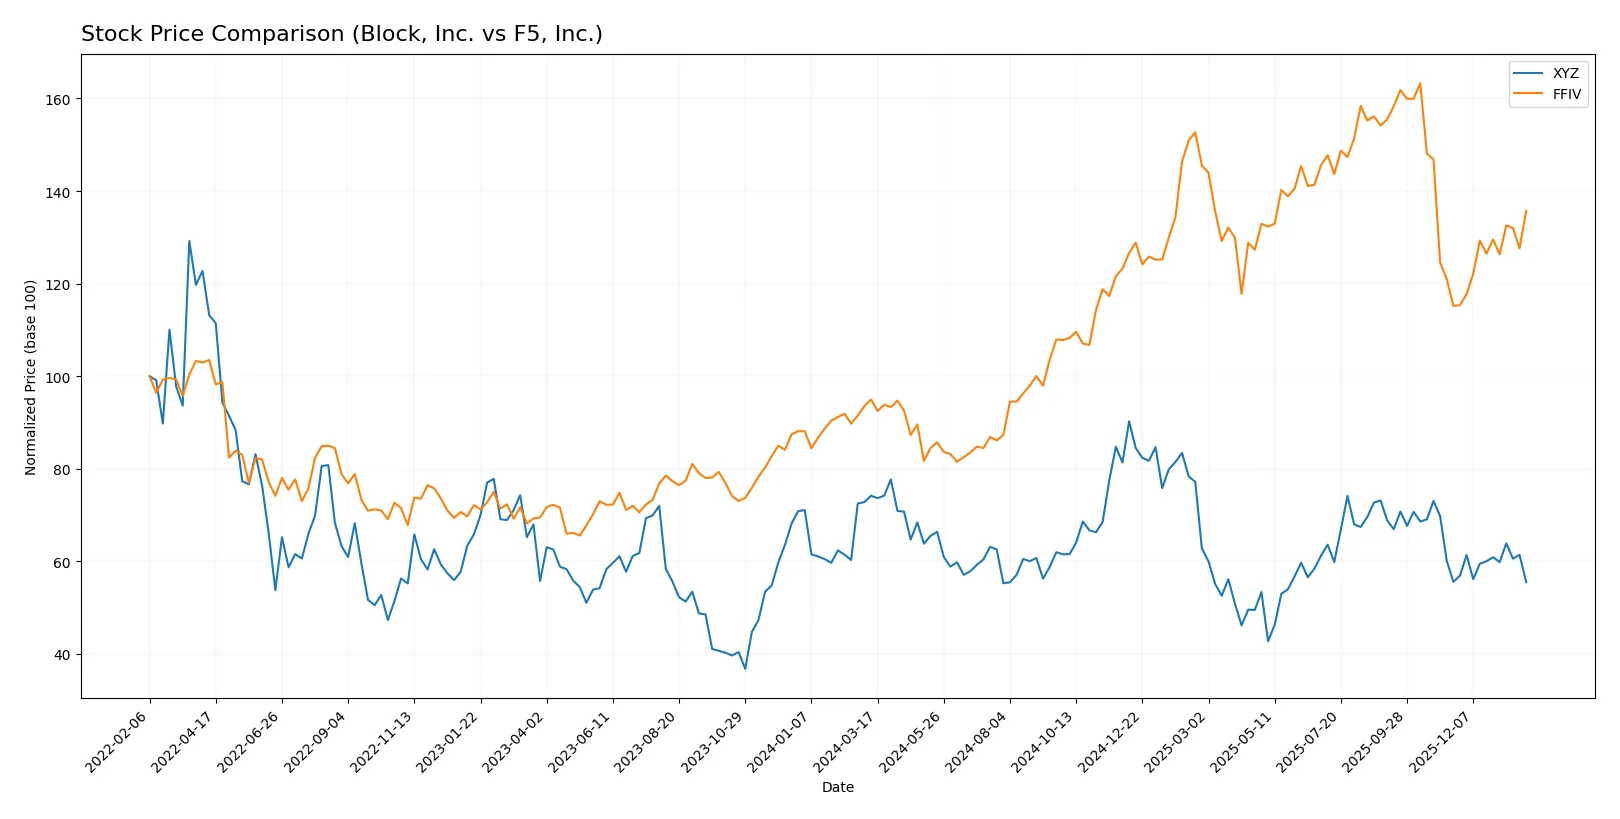
Trend Comparison
Block, Inc. (XYZ) exhibits a 25.15% decline over the past year, marking a bearish trend with accelerating downward momentum. The stock ranged between 98.25 and 46.53, showing notable volatility (std dev 10.41).
F5, Inc. (FFIV) recorded a 42.85% gain, signaling a bullish trend with accelerating upward movement. It traded between 165.57 and 331.75, but with high volatility (std dev 48.51) over the 12 months.
Comparing trends, F5, Inc. outperformed Block, Inc. substantially, delivering the highest market returns with sustained bullish acceleration and stronger buyer dominance.
Target Prices
Analysts show a bullish consensus for both Block, Inc. and F5, Inc., reflecting confidence in their growth prospects.
| Company | Target Low | Target High | Consensus |
|---|---|---|---|
| Block, Inc. | 65 | 100 | 84.92 |
| F5, Inc. | 295 | 352 | 330.67 |
Block, Inc.’s consensus target price of $84.92 suggests a 40% upside from its current $60.43 level. F5, Inc. shows a more substantial upside, with targets implying a nearly 20% gain over the current $275.61 price.

Don’t Let Luck Decide Your Entry Point
Optimize your entry points with our advanced ProRealTime indicators. You’ll get efficient buy signals with precise price targets for maximum performance. Start outperforming now!
How do institutions grade them?
Block, Inc. Grades
The table below shows recent institutional grades for Block, Inc.:
| Grading Company | Action | New Grade | Date |
|---|---|---|---|
| Piper Sandler | maintain | Underweight | 2026-01-14 |
| Keefe, Bruyette & Woods | maintain | Outperform | 2026-01-02 |
| Needham | maintain | Buy | 2025-11-24 |
| B of A Securities | maintain | Buy | 2025-11-21 |
| Morgan Stanley | maintain | Equal Weight | 2025-11-21 |
| RBC Capital | maintain | Outperform | 2025-11-20 |
| Mizuho | maintain | Outperform | 2025-11-20 |
| BTIG | maintain | Buy | 2025-11-20 |
| Stephens & Co. | maintain | Overweight | 2025-11-20 |
| BTIG | maintain | Buy | 2025-11-14 |
F5, Inc. Grades
Below are the latest institutional grades for F5, Inc.:
| Grading Company | Action | New Grade | Date |
|---|---|---|---|
| Needham | maintain | Hold | 2026-01-28 |
| Piper Sandler | maintain | Overweight | 2026-01-28 |
| Goldman Sachs | maintain | Neutral | 2026-01-28 |
| Barclays | maintain | Equal Weight | 2026-01-28 |
| RBC Capital | maintain | Outperform | 2026-01-28 |
| JP Morgan | upgrade | Overweight | 2026-01-15 |
| Piper Sandler | upgrade | Overweight | 2026-01-05 |
| RBC Capital | upgrade | Outperform | 2026-01-05 |
| Morgan Stanley | maintain | Equal Weight | 2025-12-17 |
| Morgan Stanley | maintain | Equal Weight | 2025-10-28 |
Which company has the best grades?
Block, Inc. has more consistent Buy and Outperform grades, while F5, Inc. shows a mix of Hold, Overweight, and Equal Weight ratings. Block’s stronger consensus could imply greater institutional confidence, impacting investor perception of growth potential and risk.
Risks specific to each company
The following categories identify the critical pressure points and systemic threats facing both firms in the 2026 market environment:
1. Market & Competition
Block, Inc.
- Faces intense competition in software infrastructure with a volatile market range (44.27-91.29). High beta (2.665) indicates sensitivity to market swings.
F5, Inc.
- Operates in a competitive multi-cloud security market with a narrower price range (223.76-346). Beta near 1 (0.975) suggests moderate market risk.
2. Capital Structure & Debt
Block, Inc.
- Debt-to-equity ratio of 0.37 and debt-to-assets 21.53% reflect moderate leverage with strong interest coverage (181x).
F5, Inc.
- Low leverage with debt-to-equity at 0.06 and debt-to-assets 3.65%. Interest coverage is effectively infinite, indicating solid debt management.
3. Stock Volatility
Block, Inc.
- High beta (2.665) signals significant stock price volatility. Price range wide, reflecting high investor uncertainty.
F5, Inc.
- Beta of 0.975 shows stock price moves closely with market. Price range tighter, indicating more stable trading.
4. Regulatory & Legal
Block, Inc.
- Exposed to regulatory scrutiny in payment processing and fintech compliance across multiple countries.
F5, Inc.
- Faces complex regulatory frameworks in cybersecurity and data protection globally, but with more established compliance protocols.
5. Supply Chain & Operations
Block, Inc.
- Reliant on hardware components and software integration; supply chain disruptions could impact product delivery and innovation pace.
F5, Inc.
- Focus on software and cloud services reduces physical supply chain risks but depends on cloud provider partnerships.
6. ESG & Climate Transition
Block, Inc.
- Moderate focus on ESG with no dividend yield, signaling reinvestment priorities but potential pressure on sustainable practices.
F5, Inc.
- ESG initiatives likely stronger given enterprise client demands; also no dividend yield but a stable financial position supports transition investments.
7. Geopolitical Exposure
Block, Inc.
- Operates in multiple regions including US, Canada, Europe, and Asia-Pacific, increasing geopolitical risk amid trade tensions.
F5, Inc.
- Global reach with exposure to Americas, EMEA, and Asia-Pacific; geopolitical risks mitigated by diversified client base and cloud partnerships.
Which company shows a better risk-adjusted profile?
F5, Inc. shows a better risk-adjusted profile due to its lower leverage, more stable stock volatility, and higher financial strength scores. Block, Inc.’s elevated beta and weaker ROIC versus WACC highlight greater risk. F5’s Altman Z-score in the safe zone (5.32) contrasts with Block’s grey zone (2.60), underscoring stronger financial resilience. The most pressing risk for Block is market volatility amplified by high beta. For F5, competitive pressure in a complex regulatory environment demands vigilance. Overall, F5’s conservative capital structure and superior profitability metrics justify confidence despite higher valuation multiples.
Final Verdict: Which stock to choose?
Block, Inc. excels as a cash-generating engine with solid liquidity and a strong market presence. Its main point of vigilance lies in its currently unfavorable ROIC versus WACC, signaling potential value destruction despite improving profitability. It suits portfolios aiming for aggressive growth amid cyclical recovery.
F5, Inc. boasts a durable competitive moat with robust ROIC well above its cost of capital, reflecting efficient capital use and rising profitability. Its strong margin profile and safer balance sheet position it as a more stable choice compared to Block. It fits well in GARP (Growth at a Reasonable Price) portfolios seeking a mix of growth and resilience.
If you prioritize high growth potential and are comfortable with cyclical risks, Block, Inc. could be compelling due to its improving profitability and cash flow strength. However, if you seek superior capital efficiency and better stability, F5, Inc. outshines as a more durable value creator with a proven economic moat. Both scenarios demand careful risk management aligned with investor tolerance.
Disclaimer: Investment carries a risk of loss of initial capital. The past performance is not a reliable indicator of future results. Be sure to understand risks before making an investment decision.
Go Further
I encourage you to read the complete analyses of Block, Inc. and F5, Inc. to enhance your investment decisions: