Block, Inc. and CyberArk Software Ltd. are two prominent players in the software infrastructure industry, each excelling in distinct yet overlapping domains—payment solutions and cybersecurity. Block drives innovation in digital payments and commerce, while CyberArk leads in privileged access security for enterprises. This comparison highlights their strategic approaches and market positions, helping you decide which company holds the most promise for your investment portfolio.

Table of contents
Companies Overview
I will begin the comparison between Block, Inc. and CyberArk Software Ltd. by providing an overview of these two companies and their main differences.
Block, Inc. Overview
Block, Inc. develops tools that enable sellers to accept card payments and offers a range of hardware and software products to facilitate point-of-sale solutions and next-day settlement. Operating primarily in the U.S., Canada, Japan, Australia, and Europe, it also provides Cash App for money transfer and Weebly for website hosting. Founded in 2009 and based in Oakland, CA, Block is a significant player in software infrastructure with a market cap of 40B USD.
CyberArk Software Ltd. Overview
CyberArk Software Ltd. specializes in software-based security solutions, focusing on privileged access management, identity, and access management services. Serving industries including financial services, healthcare, and government worldwide, CyberArk offers SaaS products to secure cloud environments and endpoints. Established in 1999 and headquartered in Petah Tikva, Israel, CyberArk has a market capitalization of approximately 23B USD.
Key similarities and differences
Both Block and CyberArk operate within the software infrastructure industry but focus on different niches: Block on payment processing and point-of-sale systems, while CyberArk concentrates on cybersecurity and identity management. Block has a larger workforce with 12,000 employees versus CyberArk’s 3,793. Geographically, Block is U.S.-based with a broader retail and consumer focus, whereas CyberArk is Israel-based, targeting enterprise security solutions globally.
Income Statement Comparison
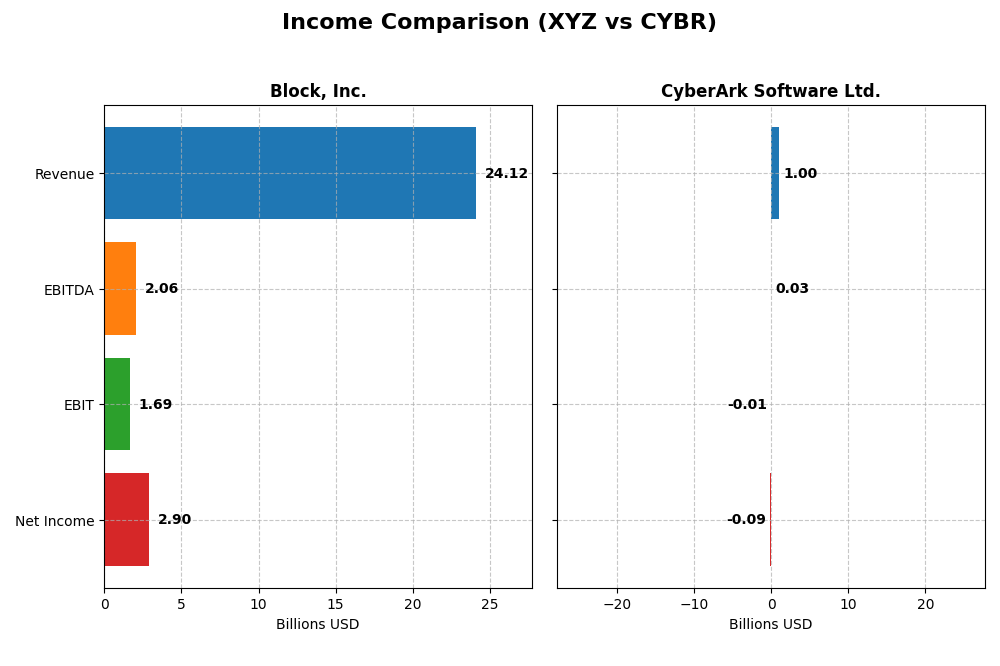
The table below presents a side-by-side comparison of key income statement metrics for Block, Inc. and CyberArk Software Ltd. for the fiscal year 2024.
| Metric | Block, Inc. (XYZ) | CyberArk Software Ltd. (CYBR) |
|---|---|---|
| Market Cap | 40.2B | 22.9B |
| Revenue | 24.1B | 1.0B |
| EBITDA | 2.1B | 29M |
| EBIT | 1.7B | -13M |
| Net Income | 2.9B | -93M |
| EPS | 4.7 | -2.12 |
| Fiscal Year | 2024 | 2024 |
Income Statement Interpretations
Block, Inc.
Block, Inc. has shown strong revenue growth from $9.5B in 2020 to $24.1B in 2024, with net income rebounding sharply from a loss in 2022 to $2.9B in 2024. Margins improved notably, with a gross margin near 37% and net margin at 12% in 2024. The latest year saw favorable earnings growth and margin expansion, despite a slight increase in operating expenses relative to revenue.
CyberArk Software Ltd.
CyberArk’s revenue increased steadily from $464M in 2020 to $1.0B in 2024, supported by a high gross margin above 79%. However, EBIT and net margins remained negative, with a net loss of $93M in 2024. While revenue and gross profit growth were favorable, net income and EPS declined overall, reflecting continuing pressure on profitability despite operational improvements.
Which one has the stronger fundamentals?
Block, Inc.’s income statement exhibits robust top-line growth, margin improvement, and a return to strong profitability, reflecting more favorable fundamentals. CyberArk, while growing revenue and maintaining high gross margins, struggles with persistent net losses and negative margins, resulting in a more neutral evaluation of its financial health.
Financial Ratios Comparison
Below is a comparative overview of the key financial ratios for Block, Inc. (XYZ) and CyberArk Software Ltd. (CYBR) based on their most recent fiscal year data ending in 2024.
| Ratios | Block, Inc. (XYZ) | CyberArk Software Ltd. (CYBR) |
|---|---|---|
| ROE | 13.6% | -3.94% |
| ROIC | 3.03% | -2.85% |
| P/E | 18.1 | -157.5 |
| P/B | 2.47 | 6.21 |
| Current Ratio | 2.33 | 1.48 |
| Quick Ratio | 2.31 | 1.48 |
| D/E (Debt-to-Equity) | 0.37 | 0.012 |
| Debt-to-Assets | 21.5% | 0.88% |
| Interest Coverage | 95.9 | -17.9 |
| Asset Turnover | 0.66 | 0.30 |
| Fixed Asset Turnover | 45.1 | 51.1 |
| Payout Ratio | 0 | 0 |
| Dividend Yield | 0 | 0 |
Interpretation of the Ratios
Block, Inc.
Block, Inc. shows a mix of strengths and weaknesses in its 2024 financial ratios. It has favorable liquidity ratios with a current ratio of 2.33 and quick ratio of 2.31, plus a strong interest coverage of 181.31, indicating solid short-term financial health and debt service capability. However, its return on invested capital (3.03%) and weighted average cost of capital (14.27%) are unfavorable, suggesting challenges in generating returns above its cost of capital. The company does not pay dividends, reflecting a reinvestment strategy likely focused on growth and innovation.
CyberArk Software Ltd.
CyberArk displays weaker profitability and efficiency ratios in 2024, with an unfavorable net margin of -9.34% and return on equity at -3.94%, signaling operating losses and negative shareholder returns. Liquidity is moderate, with a neutral current ratio of 1.48 but a favorable quick ratio of 1.48. Its debt levels are low and well-covered, but negative interest coverage raises concerns over debt servicing. CyberArk also does not pay dividends, likely prioritizing reinvestment in R&D and acquisitions amid ongoing losses.
Which one has the best ratios?
Block, Inc. presents a more balanced set of financial ratios with half rated favorable and only 21.43% unfavorable, indicating slightly favorable overall financial health. In contrast, CyberArk faces significant profitability and coverage challenges, with half of its ratios unfavorable and only 35.71% favorable, leading to a slightly unfavorable global assessment. Based strictly on these metrics, Block, Inc. demonstrates better financial ratio performance in 2024.
Strategic Positioning
This section compares the strategic positioning of Block, Inc. and CyberArk Software Ltd., including market position, key segments, and exposure to technological disruption:
Block, Inc.
- Leading payment solutions provider with strong market cap and high beta indicating volatility.
- Diverse revenue streams: software, cryptocurrency assets, hardware, and transaction services.
- Operates in evolving payment technologies and cryptocurrency, facing moderate disruption risks.
CyberArk Software Ltd.
- Niche cybersecurity firm with moderate market cap and lower beta showing less volatility.
- Focused on software security: SaaS, subscriptions, licenses, and professional services.
- Exposed to cybersecurity advancements with SaaS and cloud privilege management innovations.
Block, Inc. vs CyberArk Software Ltd. Positioning
Block pursues a diversified business model spanning payments, software, and crypto assets, providing multiple growth drivers but higher volatility. CyberArk concentrates on cybersecurity software, offering specialized solutions but with narrower market exposure and potentially slower growth.
Which has the best competitive advantage?
Both companies are currently shedding value with ROIC below WACC. Block shows a slightly unfavorable moat with improving profitability, while CyberArk faces a very unfavorable moat and declining profitability, indicating weaker competitive advantage for CyberArk.
Stock Comparison
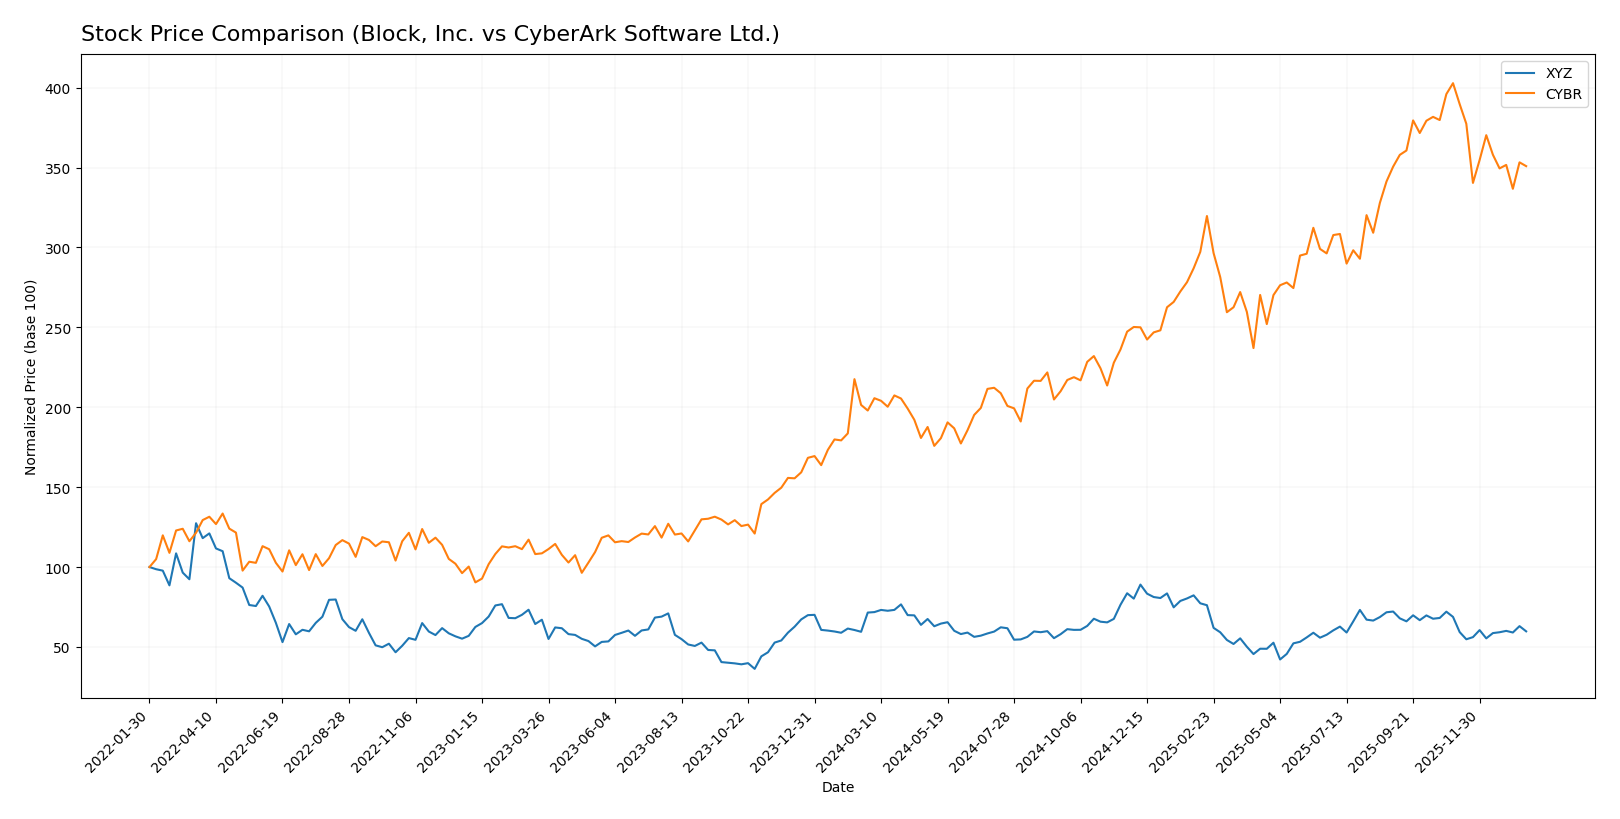
The stock price movements of Block, Inc. and CyberArk Software Ltd. over the past 12 months reveal contrasting trends, with Block, Inc. experiencing a steady decline while CyberArk Software Ltd. shows substantial gains despite recent downward pressure.
Trend Analysis
Block, Inc.’s stock showed a bearish trend over the past year with a price drop of 16.43%, marked by deceleration and a standard deviation of 10.43. The recent period confirms continued decline with a -13.16% change.
CyberArk Software Ltd. exhibited a bullish trend overall, gaining 77.27% despite deceleration and high volatility (std deviation 82.45). Its recent trend reversed with a -12.89% drop, reflecting short-term selling pressure.
Comparing both, CyberArk Software Ltd. delivered the highest market performance over the analyzed period, outperforming Block, Inc. by a wide margin despite recent trend weakness.
Target Prices
The current analyst consensus presents a positive outlook for both Block, Inc. and CyberArk Software Ltd.
| Company | Target High | Target Low | Consensus |
|---|---|---|---|
| Block, Inc. | 100 | 65 | 84.91 |
| CyberArk Software Ltd. | 520 | 440 | 479.22 |
Analysts expect Block, Inc.’s stock to rise significantly from its current price of 65.95, while CyberArk’s target consensus suggests a moderate upside compared to its current price of 453.65. Overall, both stocks have positive growth potential according to consensus targets.
Analyst Opinions Comparison
This section compares analysts’ ratings and grades for Block, Inc. and CyberArk Software Ltd.:
Rating Comparison
Block, Inc. Rating
- Rating: B+, considered Very Favorable by analysts.
- Discounted Cash Flow Score: Moderate at 3 out of 5.
- ROE Score: Favorable at 4, indicating efficient equity use.
- ROA Score: Favorable at 4, demonstrating effective asset use.
- Debt To Equity Score: Moderate at 2, moderate financial risk.
- Overall Score: Moderate at 3, a balanced financial position.
CyberArk Software Ltd. Rating
- Rating: C-, marked as Very Favorable despite lower grade.
- Discounted Cash Flow Score: Moderate, also 3 out of 5.
- ROE Score: Very Unfavorable at 1, showing weak equity returns.
- ROA Score: Very Unfavorable at 1, reflecting poor asset utilization.
- Debt To Equity Score: Moderate at 2, similar financial risk level.
- Overall Score: Very Unfavorable at 1, indicating weaker financial health.
Which one is the best rated?
Block, Inc. is clearly better rated with a B+ rating and favorable scores in ROE and ROA, compared to CyberArk’s C- rating and very unfavorable scores in key metrics, despite both having moderate debt-to-equity and DCF scores.
Scores Comparison
Here is a comparison of the Altman Z-Score and Piotroski Score for Block, Inc. and CyberArk Software Ltd.:
Block, Inc. Scores
- Altman Z-Score: 2.70, classified in the grey zone indicating moderate bankruptcy risk.
- Piotroski Score: 6, indicating average financial strength.
CyberArk Software Ltd. Scores
- Altman Z-Score: 6.52, classified in the safe zone indicating low bankruptcy risk.
- Piotroski Score: 3, indicating very weak financial strength.
Which company has the best scores?
Based on the data, CyberArk shows a stronger Altman Z-Score, suggesting better bankruptcy safety, but Block, Inc. has a notably higher Piotroski Score, implying stronger overall financial health.
Grades Comparison
The following tables present the recent grades assigned to Block, Inc. and CyberArk Software Ltd. by recognized grading companies:
Block, Inc. Grades
This table summarizes the latest grades given by reputable financial firms for Block, Inc.
| Grading Company | Action | New Grade | Date |
|---|---|---|---|
| Piper Sandler | Maintain | Underweight | 2026-01-14 |
| Keefe, Bruyette & Woods | Maintain | Outperform | 2026-01-02 |
| Needham | Maintain | Buy | 2025-11-24 |
| B of A Securities | Maintain | Buy | 2025-11-21 |
| Morgan Stanley | Maintain | Equal Weight | 2025-11-21 |
| BTIG | Maintain | Buy | 2025-11-20 |
| RBC Capital | Maintain | Outperform | 2025-11-20 |
| Stephens & Co. | Maintain | Overweight | 2025-11-20 |
| Mizuho | Maintain | Outperform | 2025-11-20 |
| BTIG | Maintain | Buy | 2025-11-14 |
Block, Inc. displays a broadly positive grading trend, with multiple Buy and Outperform ratings, though one Underweight and one Equal Weight suggest some divergence in opinions.
CyberArk Software Ltd. Grades
This table summarizes the latest grades given by reputable financial firms for CyberArk Software Ltd.
| Grading Company | Action | New Grade | Date |
|---|---|---|---|
| Oppenheimer | Maintain | Outperform | 2024-10-22 |
| Keybanc | Maintain | Overweight | 2024-10-18 |
| Mizuho | Maintain | Outperform | 2024-10-17 |
| BTIG | Maintain | Buy | 2024-10-09 |
| Barclays | Maintain | Overweight | 2024-10-07 |
| Wedbush | Maintain | Outperform | 2024-10-01 |
| Jefferies | Maintain | Buy | 2024-09-24 |
| DA Davidson | Maintain | Buy | 2024-08-09 |
| Rosenblatt | Maintain | Buy | 2024-08-09 |
| Susquehanna | Maintain | Positive | 2024-08-09 |
CyberArk Software Ltd. shows consistent strong positive ratings, predominantly Buy, Outperform, and Overweight, indicating a favorable consensus among analysts.
Which company has the best grades?
Both Block, Inc. and CyberArk Software Ltd. hold consensus Buy ratings, but CyberArk exhibits a more uniformly positive grading profile with no Underweight or Hold ratings. This could suggest a stronger analyst confidence for CyberArk, potentially impacting investors’ perception of relative stability and growth prospects.
Strengths and Weaknesses
The table below compares key strengths and weaknesses of Block, Inc. (XYZ) and CyberArk Software Ltd. (CYBR) based on their latest financial and strategic data.
| Criterion | Block, Inc. (XYZ) | CyberArk Software Ltd. (CYBR) |
|---|---|---|
| Diversification | Highly diversified: Software & Data Products (7.16B), Cryptocurrency Assets (10.2B), Hardware, and Transactions | Moderately diversified: SaaS (468M), Self Hosted Subscription (265M), Maintenance & Support (197M), and others |
| Profitability | Net margin 12.01% (favorable); ROIC 3.03% (unfavorable); WACC 14.27% | Net margin -9.34% (unfavorable); ROIC -2.85% (unfavorable); WACC 8.15% (neutral) |
| Innovation | Growing ROIC trend indicates improving profitability despite current value destruction | Declining ROIC trend signals decreasing profitability and challenges in sustaining competitive edge |
| Global presence | Strong presence supported by substantial transaction volumes and diversified product lines | Global presence in cybersecurity with subscription and license models, but profitability issues limit expansion power |
| Market Share | Solid market share in fintech and cryptocurrency sectors with increasing revenues | Specialized market share in cybersecurity software, facing profitability and growth headwinds |
Block, Inc. shows a strong diversified revenue base and improving profitability trends, though it currently destroys value. CyberArk struggles with declining profitability and value destruction, despite its niche in cybersecurity. Investors should weigh Block’s growth potential against CyberArk’s riskier profile.
Risk Analysis
Below is a comparative table of key risks for Block, Inc. (XYZ) and CyberArk Software Ltd. (CYBR) based on the latest 2024 data:
| Metric | Block, Inc. (XYZ) | CyberArk Software Ltd. (CYBR) |
|---|---|---|
| Market Risk | High beta 2.665 indicates high volatility | Low beta 0.915 implies lower volatility |
| Debt level | Moderate debt-to-equity 0.37, favorable | Very low debt-to-equity 0.01, favorable |
| Regulatory Risk | Moderate, US and international payment regulations | Moderate, cybersecurity regulations globally |
| Operational Risk | Exposure to hardware/software integration challenges | Risks from rapidly evolving cybersecurity threats |
| Environmental Risk | Moderate, tech sector exposure to energy use | Low, software-focused with minimal physical footprint |
| Geopolitical Risk | Moderate, operates in several countries with stable environments | Higher, headquartered in Israel with regional geopolitical tensions |
Synthesis: Block, Inc. faces significant market volatility but maintains solid financial stability with manageable debt. CyberArk, while having low financial leverage and safer bankruptcy risk, struggles with negative profitability and geopolitical risks due to its location. Market and geopolitical risks are the most impactful for these companies in 2026.
Which Stock to Choose?
Block, Inc. (XYZ) shows a favorable income evolution with a 10.06% revenue growth in 2024 and strong net margin at 12.01%. Its financial ratios are slightly favorable, featuring a solid current ratio of 2.33 and low debt levels. Profitability is improving, although ROIC remains below WACC, indicating slight value destruction. The company holds a very favorable B+ rating, supported by moderate overall scores.
CyberArk Software Ltd. (CYBR) posted a strong 33.1% revenue growth in 2024 but suffers from negative profitability, with a -9.34% net margin and unfavorable ROE and ROIC. Its financial ratios lean slightly unfavorable, despite low debt and a safe Altman Z-score. CYBR’s rating is very unfavorable (C-), reflecting concerns over profitability and value destruction with declining ROIC.
For investors, Block, Inc. might appear more suitable for those seeking steady income growth and better-rated financial stability, while CyberArk could be interpreted as appealing to risk-tolerant investors targeting rapid revenue expansion despite profitability challenges. The choice could depend on whether one prioritizes stability and improving profits or high growth potential with higher risk.
Disclaimer: Investment carries a risk of loss of initial capital. The past performance is not a reliable indicator of future results. Be sure to understand risks before making an investment decision.
Go Further
I encourage you to read the complete analyses of Block, Inc. and CyberArk Software Ltd. to enhance your investment decisions: