Home > Comparison > Technology > XYZ vs CPAY
The strategic rivalry between Block, Inc. and Corpay, Inc. shapes the trajectory of the global technology payments sector. Block operates as a versatile fintech innovator, blending hardware and software solutions for merchants. Corpay focuses on specialized corporate payment services, excelling in vehicle and travel expense management. This analysis probes their contrasting growth models to identify which offers superior risk-adjusted returns for diversified portfolios in today’s dynamic market environment.

Table of contents
Companies Overview
Block, Inc. and Corpay, Inc. dominate the payments infrastructure landscape with distinct yet impactful market approaches.
Block, Inc.: Digital Payments Innovator
Block, Inc. leads as a technology-driven payments provider. It generates revenue through hardware sales like card readers and POS terminals combined with software services including Square POS and Cash App. In 2026, Block focuses on expanding integrated digital solutions that enhance seller and consumer payment experiences across multiple global markets.
Corpay, Inc.: Corporate Payments Specialist
Corpay, Inc. specializes in business and consumer payment management, emphasizing vehicle and lodging expenses. Its core revenue stems from corporate cards, accounts payable automation, and cross-border payment solutions. The company’s 2026 strategy prioritizes broadening its international footprint and refining business payment platforms to streamline corporate expense management.
Strategic Collision: Similarities & Divergences
Both firms operate in payments infrastructure but diverge sharply in client focus. Block pursues a broad seller-consumer ecosystem, while Corpay targets corporate expense automation and niche payment verticals. Their competition centers on market share in digital payments, yet their distinct business models offer contrasting risk and growth profiles for investors.
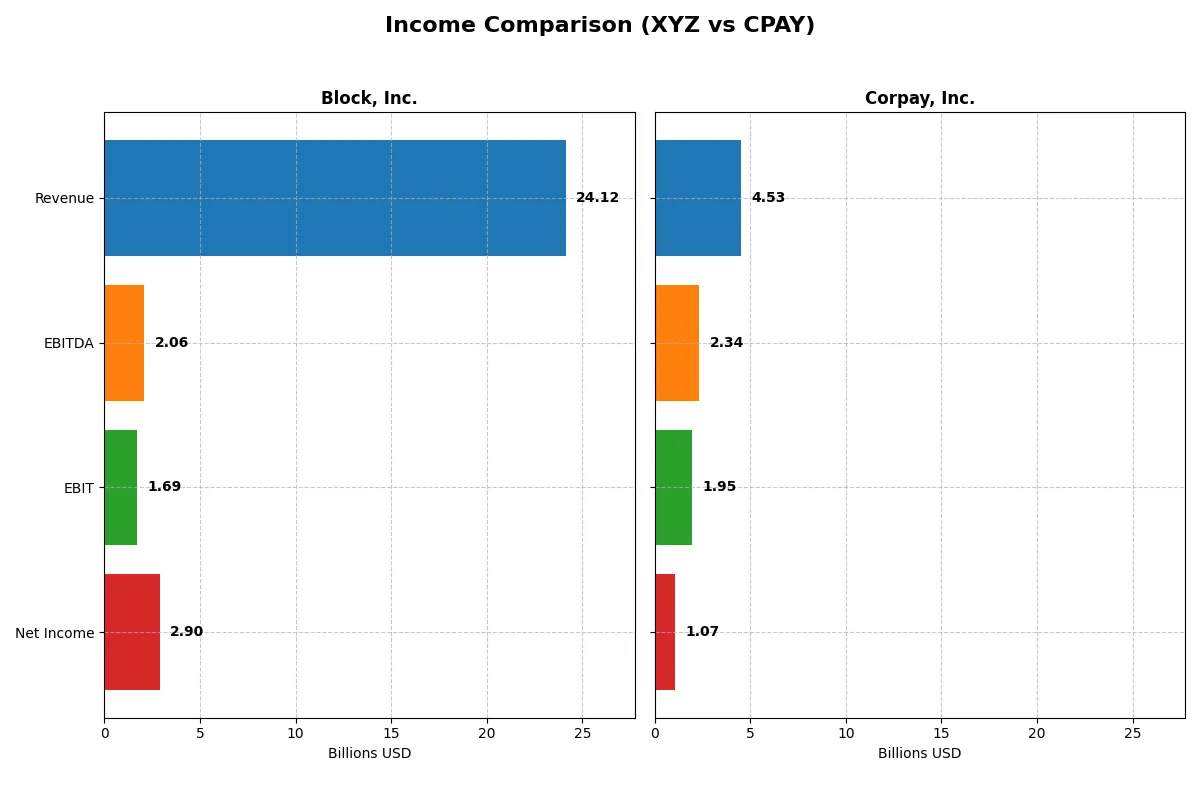
Income Statement Comparison
This data dissects the core profitability and scalability of both corporate engines to reveal who dominates the bottom line:
| Metric | Block, Inc. (XYZ) | Corpay, Inc. (CPAY) |
|---|---|---|
| Revenue | 24.1B | 3.97B |
| Cost of Revenue | 15.2B | 869M |
| Operating Expenses | 8.0B | 1.32B |
| Gross Profit | 8.9B | 3.11B |
| EBITDA | 2.06B | 2.12B |
| EBIT | 1.69B | 1.77B |
| Interest Expense | 9.3M | 383M |
| Net Income | 2.90B | 1.00B |
| EPS | 4.7 | 14.27 |
| Fiscal Year | 2024 | 2024 |
Income Statement Analysis: The Bottom-Line Duel
This income statement comparison will expose which company harnesses its revenue and expenses most effectively to maximize shareholder value.
Block, Inc. Analysis
Block, Inc. grows revenue from 9.5B in 2020 to 24.1B in 2024, with net income swinging from a 540M loss in 2022 to a 2.9B profit in 2024. Gross margin improves steadily, hitting 36.9% in 2024, while net margin surges to 12.0%. The latest year shows strong momentum with a 10% revenue rise and a dramatic net income increase, signaling enhanced operational efficiency despite rising expenses.
Corpay, Inc. Analysis
Corpay, Inc. increases revenue from 2.8B in 2021 to 4.5B in 2025, with net income climbing from 840M to 1.1B over the same period. It boasts a robust 69.9% gross margin and a strong 23.6% net margin in 2025. While revenue growth accelerates 14% last year, net margin dips slightly, reflecting higher interest costs. Yet, Corpay maintains solid EBIT growth and operational discipline, underscoring sustained profitability.
Margin Strength vs. Growth Trajectory
Block delivers impressive revenue and net income growth with improving margins, transforming losses into sizable profits by 2024. Corpay commands superior margins and consistent profitability but shows slower net margin expansion and higher leverage costs. For investors, Block’s rapid scaling and margin recovery offer high growth potential, while Corpay’s stable, high-margin profile appeals to those favoring durable profitability.
Financial Ratios Comparison
These vital ratios act as a diagnostic tool to expose the underlying fiscal health, valuation premiums, and capital efficiency of the companies analyzed:
| Ratios | Block, Inc. (XYZ) | Corpay, Inc. (CPAY) |
|---|---|---|
| ROE | 13.6% | 27.5% |
| ROIC | 3.0% | 8.8% |
| P/E | 18.1 | 19.7 |
| P/B | 2.47 | 5.43 |
| Current Ratio | 2.33 | 0.98 |
| Quick Ratio | 2.31 | 0.98 |
| D/E | 0.37 | 2.58 |
| Debt-to-Assets | 21.5% | 37.9% |
| Interest Coverage | 95.9 | 4.8 |
| Asset Turnover | 0.66 | 0.17 |
| Fixed Asset Turnover | 45.1 | 9.59 |
| Payout ratio | 0 | 0 |
| Dividend yield | 0 | 0 |
| Fiscal Year | 2024 | 2025 |
Efficiency & Valuation Duel: The Vital Signs
Financial ratios act as a company’s DNA, highlighting hidden risks and operational strengths essential for investment decisions.
Block, Inc.
Block posts a solid 13.6% ROE and a 12% net margin, signaling decent profitability. Its P/E of 18.1 and P/B of 2.47 suggest a fairly valued stock. The firm retains earnings for growth, focusing heavily on R&D, as it pays no dividends. Its strong current ratio of 2.33 indicates robust liquidity.
Corpay, Inc.
Corpay excels with a 27.5% ROE and a high 23.6% net margin, showing operational efficiency. Despite a stretched P/B of 5.43, its P/E near 19 remains neutral. The company carries significant debt (D/E 2.58) and a weaker current ratio under 1. It reinvests cash flow rather than paying dividends, favoring growth over yield.
Premium Valuation vs. Operational Safety
Block delivers balanced profitability with favorable liquidity and moderate valuation, reducing risk. Corpay offers higher returns but carries heavier debt and weaker liquidity, increasing financial strain. Investors seeking stability may prefer Block’s profile, while those tolerating risk might consider Corpay’s growth potential.
Which one offers the Superior Shareholder Reward?
Block, Inc. and Corpay, Inc. both forgo dividends, focusing on reinvestment and buybacks. Block’s dividend yield is zero with a 0% payout ratio, while Corpay also pays no dividends. Block’s free cash flow per share is $2.52 with a modest buyback program implied by steady shareholders’ equity. Corpay’s free cash flow per share is much higher at $18.52, supported by aggressive share repurchases, reflected in substantial financial leverage (6.8x) and a debt-to-equity ratio of 2.58. Corpay’s reinvestment heavily favors growth, evident in a high capex coverage ratio (7.47x) and strong operating margins (EBIT margin 43%). Block’s more conservative capital structure and moderate margins suggest slower growth but less risk. I see Corpay’s intense buyback strategy and growth reinvestment as a higher-risk, higher-reward model. For 2026, Corpay offers superior total shareholder return potential but with elevated financial leverage risks; Block provides a steadier, more sustainable shareholder reward.
Comparative Score Analysis: The Strategic Profile
The radar chart below reveals the fundamental DNA and trade-offs between Block, Inc. and Corpay, Inc., highlighting their financial strengths and vulnerabilities:
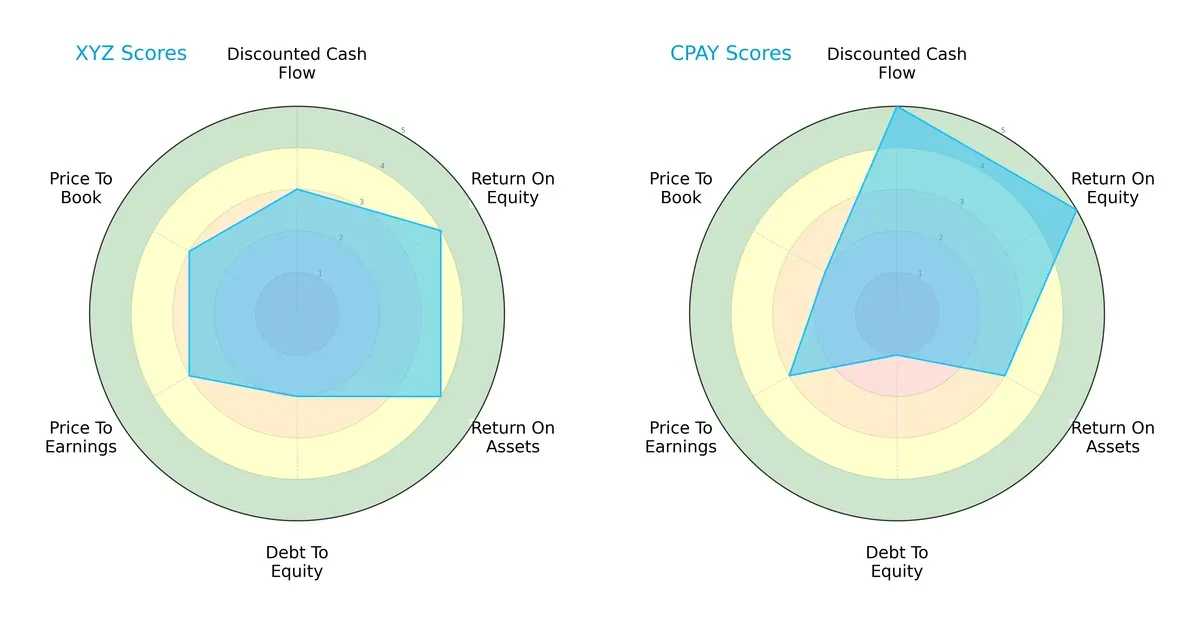
Block, Inc. presents a balanced profile with solid ROE (4) and ROA (4) scores, but its debt-to-equity score (2) signals higher leverage risk. Corpay, Inc. excels in discounted cash flow (5) and ROE (5), yet struggles with debt management (1) and a weaker price-to-book (2) valuation. Block relies on financial stability, while Corpay leans heavily on growth potential.
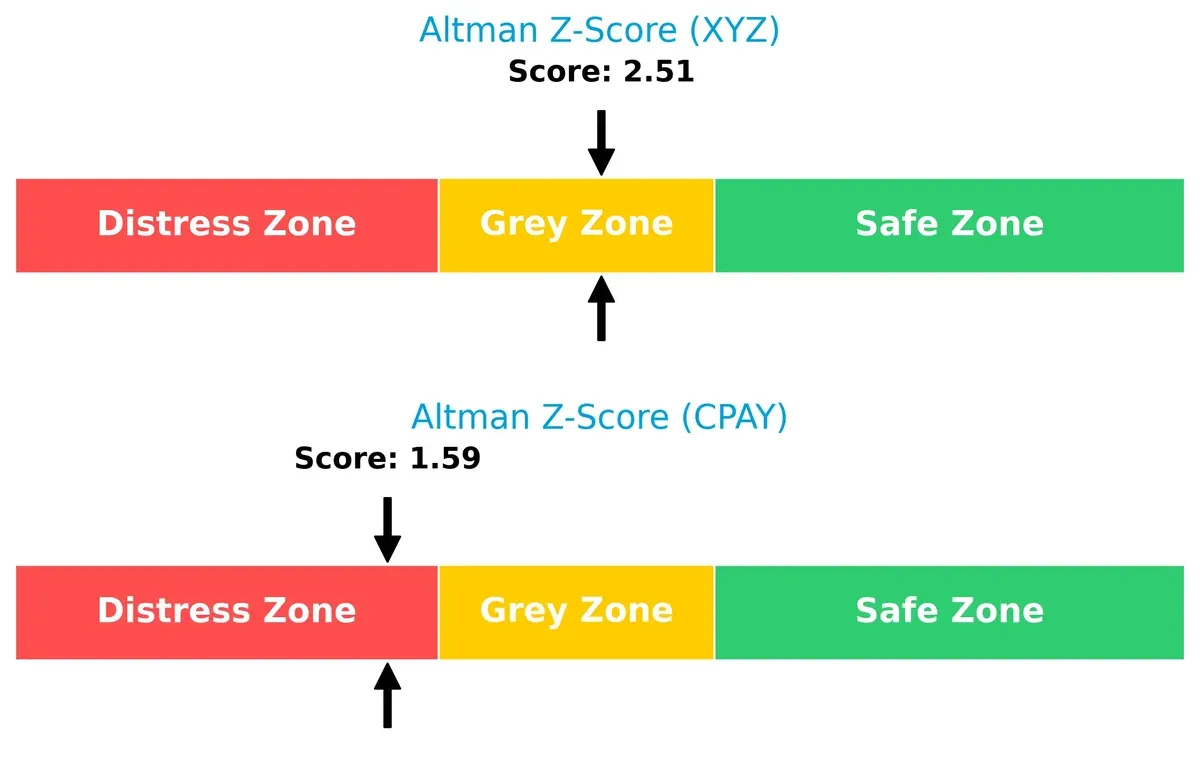
Bankruptcy Risk: Solvency Showdown
The Altman Z-Score gap shows Block, Inc. sits in the grey zone (2.51), suggesting moderate bankruptcy risk. Corpay, Inc. falls into the distress zone (1.59), indicating higher insolvency danger in this market cycle:
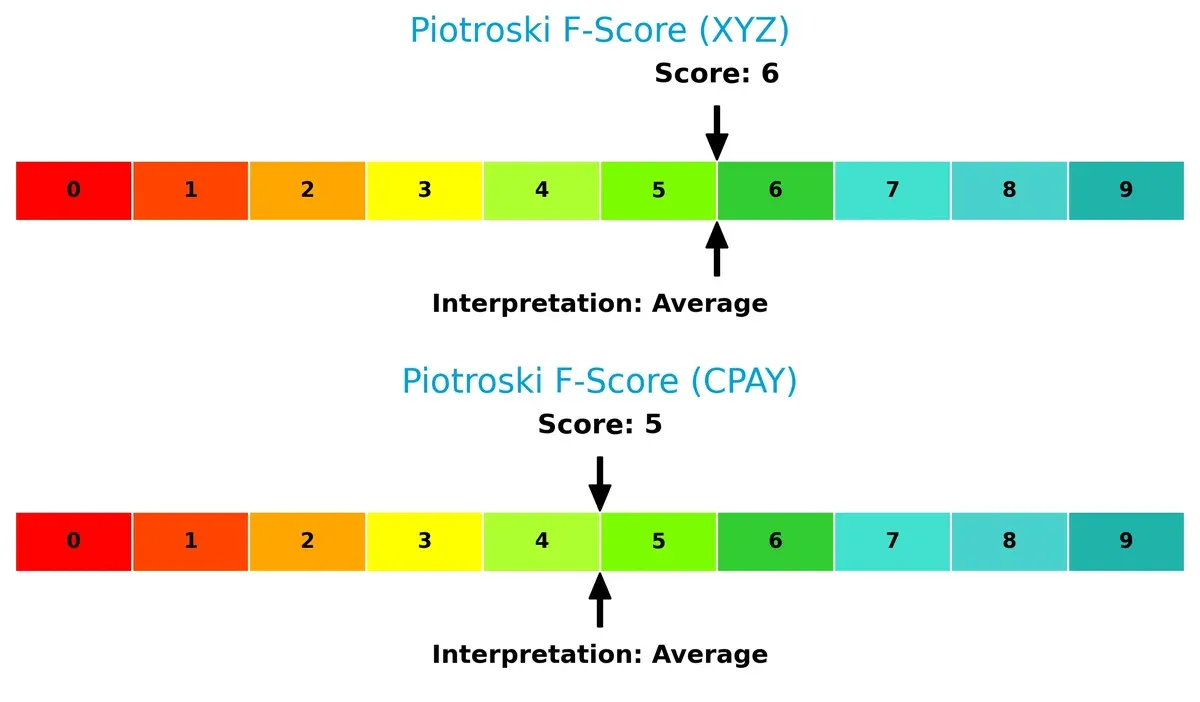
Financial Health: Quality of Operations
Both companies score similarly in Piotroski F-Score, with Block at 6 and Corpay at 5, reflecting average financial health. Neither exhibits severe red flags, but Block shows slightly stronger operational quality and efficiency:
How are the two companies positioned?
This section dissects the operational DNA of Block and Corpay by comparing their revenue distribution and internal dynamics. The goal is to confront their economic moats and identify which model offers the most resilient competitive advantage today.
Revenue Segmentation: The Strategic Mix
This comparison visualizes how Block, Inc. and Corpay, Inc. diversify their revenues and reveals their core sector commitments:
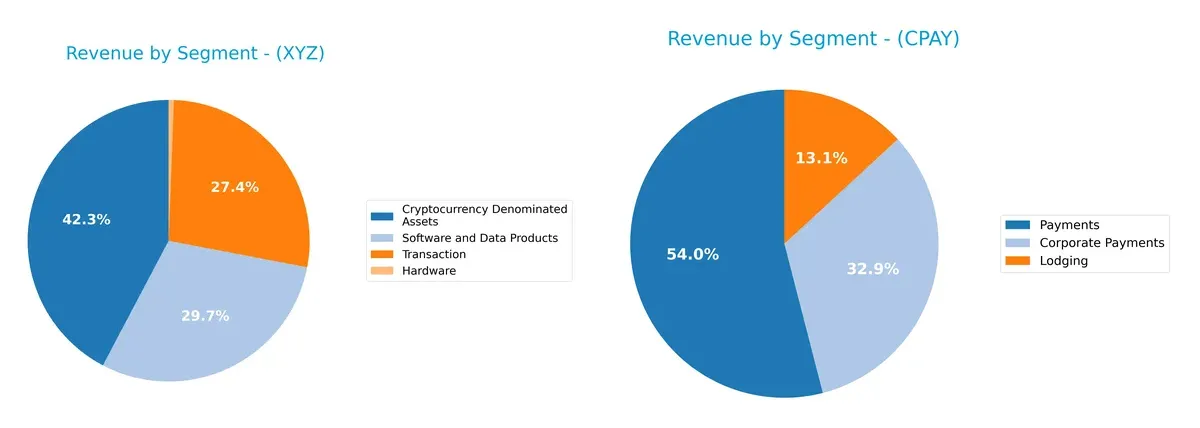
Block, Inc. pivots significantly on Cryptocurrency Denominated Assets, generating $10.2B, and anchors its business with Software and Data Products at $7.2B. Its Transaction segment adds $6.6B, showing a balanced multi-segment approach. In contrast, Corpay, Inc. concentrates heavily in Payments at $2.0B and Corporate Payments $1.2B, with Lodging at $489M. Block’s diversification reduces concentration risk, while Corpay’s focus highlights infrastructure dominance but raises exposure to sector cyclicality.
Strengths and Weaknesses Comparison
This table compares the strengths and weaknesses of Block, Inc. and Corpay, Inc. based on diversification, profitability, financials, innovation, global presence, and market share:
Block, Inc. Strengths
- Diverse revenue streams including software, crypto assets, hardware, and transactions
- Favorable net margin of 12% and strong liquidity ratios (current ratio 2.33)
- Low debt-to-assets ratio (22%) and very high interest coverage (181)
- Significant US revenue base with growing non-US sales
Corpay, Inc. Strengths
- Strong profitability with high net margin (24%) and ROE (28%)
- Favorable WACC (6.3%) supports value creation
- Solid presence in US, UK, and Brazil markets
- Favorable fixed asset turnover indicating efficient asset use
Block, Inc. Weaknesses
- ROIC (3%) below WACC (14%), indicating weak capital efficiency
- Neutral ROE and moderate asset turnover (0.66)
- No dividend yield and only slightly favorable overall ratios
- Heavy US revenue reliance limits geographic diversification
Corpay, Inc. Weaknesses
- Unfavorable liquidity ratios (current ratio 0.98) raise short-term risk concerns
- High debt-to-equity (2.58) increases financial leverage
- Unfavorable PB ratio (5.43) suggests overvaluation risk
- Low asset turnover (0.17) signals operational inefficiency
Block, Inc. benefits from diversified revenue and strong liquidity but faces capital efficiency challenges. Corpay, Inc. shows superior profitability yet carries higher financial risk and operational inefficiencies. Both firms must balance growth ambitions with prudent capital management.
The Moat Duel: Analyzing Competitive Defensibility
A structural moat shields long-term profits from relentless competitive erosion. Without it, sustainable growth is impossible. Let’s dissect the moats of two fintech leaders:
Block, Inc.: Intangible Assets and Network Effects Powering Growth
Block’s competitive edge stems from its integrated payments ecosystem and strong brand recognition. Its rising ROIC trend signals improving profitability despite current value destruction. Expansion into new markets and Cash App innovations could deepen this moat in 2026.
Corpay, Inc.: Cost Advantage and Operational Scale Drive Efficiency
Corpay leverages cost advantages and operational scale in corporate payments, earning returns above its cost of capital. Unlike Block, its ROIC is declining, suggesting challenges sustaining profitability. Growth in global corporate payment solutions offers expansion opportunities but risks margin pressure.
Network Effects vs. Cost Leadership: Which Moat Holds Stronger?
Block exhibits a deeper moat with a growing ROIC trend fueled by network effects and software integration. Corpay creates value through cost leadership but faces declining efficiency. Block is better positioned to defend and expand its market share in 2026.
Which stock offers better returns?
The past year reveals stark contrasts in price movement and trading dynamics between Block, Inc. and Corpay, Inc., highlighting divergent investor sentiment and market momentum.
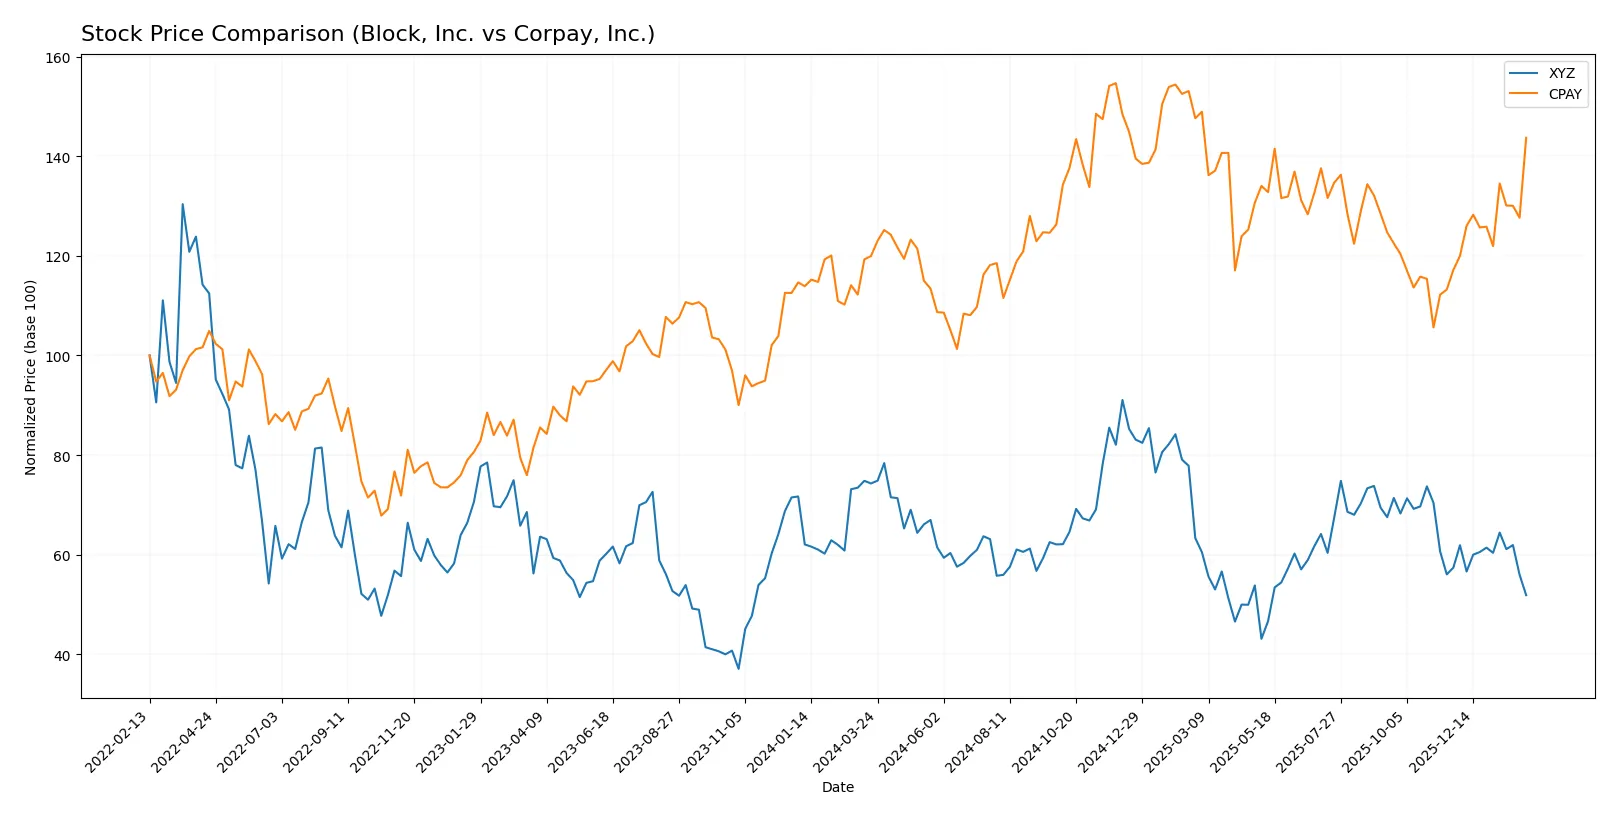
Trend Comparison
Block, Inc. exhibits a bearish trend with a -30.19% price decline over the past 12 months. The trend decelerates, ranging from a high of 98.25 to a low of 46.53, with volatility at a moderate 10.46.
Corpay, Inc. shows a bullish trend, gaining 19.8% in the same period. The trend accelerates, hitting a high of 381.18 and a low of 249.66, but with elevated volatility at 31.25.
Corpay outperforms Block with a clear upward trajectory and acceleration, while Block’s stock declines significantly with decelerating momentum.
Target Prices
Analysts present constructive target price consensus for Block, Inc. and Corpay, Inc.
| Company | Target Low | Target High | Consensus |
|---|---|---|---|
| Block, Inc. | 65 | 100 | 84.4 |
| Corpay, Inc. | 300 | 390 | 359.33 |
The consensus target prices for both companies significantly exceed current stock prices, signaling bullish analyst expectations. Block, Inc. trades well below its consensus, while Corpay, Inc. is close but still below its target average.

Don’t Let Luck Decide Your Entry Point
Optimize your entry points with our advanced ProRealTime indicators. You’ll get efficient buy signals with precise price targets for maximum performance. Start outperforming now!
How do institutions grade them?
Here is the summary of recent institutional grades for Block, Inc. and Corpay, Inc.:
Block, Inc. Grades
The table below lists recent grades from recognized financial institutions for Block, Inc.:
| Grading Company | Action | New Grade | Date |
|---|---|---|---|
| Citigroup | Maintain | Buy | 2026-02-05 |
| Piper Sandler | Maintain | Underweight | 2026-01-14 |
| Keefe, Bruyette & Woods | Maintain | Outperform | 2026-01-02 |
| Needham | Maintain | Buy | 2025-11-24 |
| B of A Securities | Maintain | Buy | 2025-11-21 |
| Morgan Stanley | Maintain | Equal Weight | 2025-11-21 |
| Mizuho | Maintain | Outperform | 2025-11-20 |
| RBC Capital | Maintain | Outperform | 2025-11-20 |
| Stephens & Co. | Maintain | Overweight | 2025-11-20 |
| BTIG | Maintain | Buy | 2025-11-20 |
Corpay, Inc. Grades
The table below lists recent grades from recognized financial institutions for Corpay, Inc.:
| Grading Company | Action | New Grade | Date |
|---|---|---|---|
| Mizuho | Maintain | Neutral | 2026-02-06 |
| JP Morgan | Maintain | Overweight | 2026-02-05 |
| RBC Capital | Maintain | Sector Perform | 2026-02-05 |
| Morgan Stanley | Maintain | Overweight | 2026-02-05 |
| Morgan Stanley | Upgrade | Overweight | 2026-01-26 |
| Oppenheimer | Maintain | Outperform | 2026-01-12 |
| Oppenheimer | Upgrade | Outperform | 2025-12-05 |
| UBS | Maintain | Neutral | 2025-11-06 |
| RBC Capital | Maintain | Sector Perform | 2025-11-06 |
| JP Morgan | Maintain | Overweight | 2025-11-06 |
Which company has the best grades?
Block, Inc. holds stronger consensus with multiple “Buy” and “Outperform” ratings. Corpay, Inc. shows mixed grades, primarily “Overweight” and “Sector Perform.” Investors might view Block as favored by analysts, potentially signaling higher confidence.
Risks specific to each company
The following categories identify critical pressure points and systemic threats facing both firms in the 2026 market environment:
1. Market & Competition
Block, Inc.
- Faces intense competition in digital payments and POS hardware with pressure from fintech startups and incumbents.
Corpay, Inc.
- Competes in corporate payments and fleet expense solutions, challenged by specialized fintechs and global payment networks.
2. Capital Structure & Debt
Block, Inc.
- Maintains a conservative debt profile (D/E 0.37), supporting financial flexibility and low leverage risk.
Corpay, Inc.
- Exhibits high leverage (D/E 2.58), elevating financial risk and sensitivity to interest rate hikes.
3. Stock Volatility
Block, Inc.
- High beta (2.67) implies significant stock price swings, increasing volatility risk for investors.
Corpay, Inc.
- Low beta (0.81) suggests relatively stable stock price movements, reducing market risk exposure.
4. Regulatory & Legal
Block, Inc.
- Subject to evolving fintech regulations across multiple jurisdictions, requiring costly compliance efforts.
Corpay, Inc.
- Faces complex cross-border regulatory environments, especially in payments and vehicle expense management.
5. Supply Chain & Operations
Block, Inc.
- Relies on hardware components vulnerable to global supply disruptions and chip shortages.
Corpay, Inc.
- Operations depend on third-party service providers and international networks, exposing it to operational risks.
6. ESG & Climate Transition
Block, Inc.
- Increasing stakeholder pressure to integrate ESG criteria into technology and payment services.
Corpay, Inc.
- Faces growing demands to reduce environmental impact in fleet operations and logistics payments.
7. Geopolitical Exposure
Block, Inc.
- Exposure concentrated in North America, Japan, and Europe, sensitive to trade tensions and regulatory shifts.
Corpay, Inc.
- Broad international footprint including Brazil and UK, increasing risks from geopolitical instability and currency fluctuations.
Which company shows a better risk-adjusted profile?
Block, Inc.’s moderate leverage and favorable liquidity provide a stronger financial cushion against shocks. Corpay’s high debt and lower liquidity raise solvency concerns, despite stable stock volatility. Block’s high beta signals market risk, but its balance sheet strength offsets this. Corpay’s operational and geopolitical risks are more pronounced. Overall, Block, Inc. offers a superior risk-adjusted profile. The most concerning risk for Block is market competition driving margin pressure. For Corpay, elevated leverage amid operational complexity is the critical threat, underscored by its Altman Z-score in the distress zone.
Final Verdict: Which stock to choose?
Block, Inc. (XYZ) stands out for its resilience and improving profitability despite a challenging macro backdrop. Its superpower lies in operational efficiency, reflected in a solid current ratio and strong cash flow management. A point of vigilance remains its negative economic value creation, indicating cautious capital allocation. Suited for investors targeting long-term recovery plays within aggressive growth portfolios.
Corpay, Inc. (CPAY) boasts a compelling strategic moat through robust returns on equity and capital that comfortably exceed its cost of capital. Its recurring revenue model and accelerating bullish momentum offer a safety cushion compared to XYZ’s volatility. However, elevated leverage and weaker liquidity ratios call for prudent risk assessment. Fits well within a GARP (Growth at a Reasonable Price) strategy.
If you prioritize capital efficiency and value creation with an appetite for potential turnaround, Block, Inc. is the compelling choice due to its improving fundamentals and operational discipline. However, if you seek a stronger moat combined with growth stability, Corpay offers better stability and superior profitability metrics, albeit with higher financial leverage. Both profiles warrant careful monitoring given their contrasting risk-reward balances.
Disclaimer: Investment carries a risk of loss of initial capital. The past performance is not a reliable indicator of future results. Be sure to understand risks before making an investment decision.
Go Further
I encourage you to read the complete analyses of Block, Inc. and Corpay, Inc. to enhance your investment decisions: