In today’s fast-evolving technology landscape, Block, Inc. and CoreWeave, Inc. stand out as pioneers in software infrastructure. Block, with its comprehensive payment solutions, and CoreWeave, focusing on cloud platforms for AI workloads, both drive innovation in overlapping markets. This comparison aims to help you navigate their growth potential and risks to identify which company could be the smarter choice for your investment portfolio. Let’s explore their strengths together.
Table of contents
Companies Overview
I will begin the comparison between Block, Inc. and CoreWeave, Inc. by providing an overview of these two companies and their main differences.
Block, Inc. Overview
Block, Inc. operates in the software infrastructure industry, offering a variety of payment and retail solutions designed to simplify transactions for sellers. The company provides hardware such as card readers and terminals, alongside software products including point-of-sale systems and financial tools like Cash App. Founded in 2009 and based in California, Block serves multiple countries including the US, Canada, and several European nations.
CoreWeave, Inc. Overview
CoreWeave, Inc. is a cloud infrastructure provider focused on supporting next-generation AI workloads and enterprise compute needs. The company delivers GPU and CPU compute services, storage, networking, and managed platforms tailored for use cases like AI model training and rendering. Established in 2017 and headquartered in New Jersey, CoreWeave has positioned itself as a specialized cloud operator for high-performance computing.
Key similarities and differences
Both Block and CoreWeave operate within the technology sector under software infrastructure, but their business models diverge significantly. Block primarily targets the financial technology space, enabling payment processing and retail solutions, while CoreWeave focuses on cloud infrastructure for AI and compute-intensive applications. Block has a larger workforce and a longer market presence, whereas CoreWeave is newer with a strong emphasis on scalable cloud services for advanced computing needs.
Income Statement Comparison
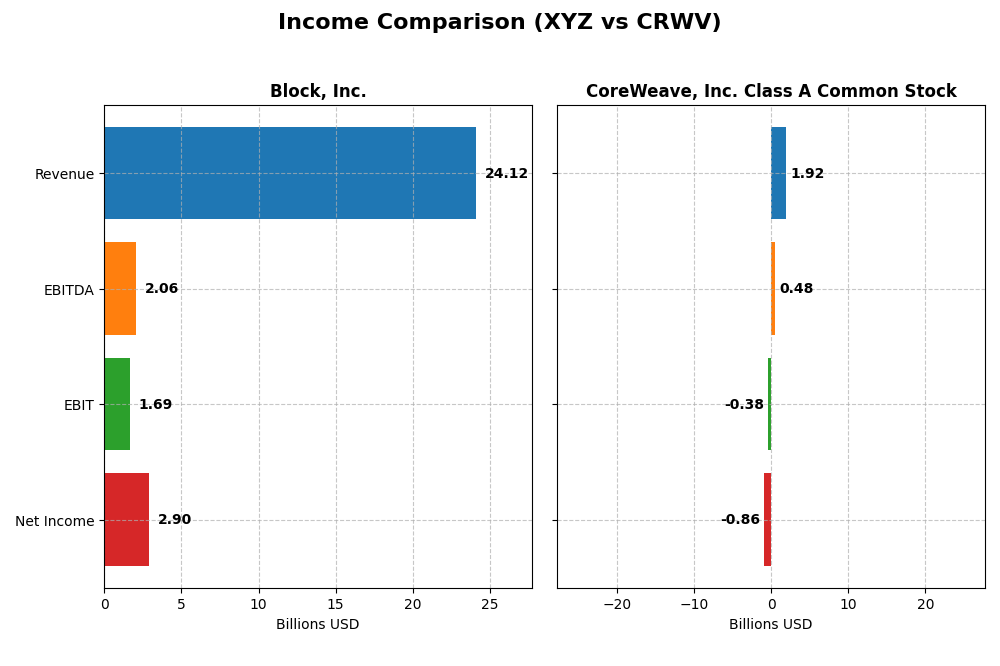
This table presents a side-by-side comparison of key income statement figures for Block, Inc. and CoreWeave, Inc. Class A Common Stock for the fiscal year 2024.
| Metric | Block, Inc. | CoreWeave, Inc. Class A Common Stock |
|---|---|---|
| Market Cap | 40.2B | 50.4B |
| Revenue | 24.1B | 1.92B |
| EBITDA | 2.06B | 480M |
| EBIT | 1.69B | -383M |
| Net Income | 2.90B | -864M |
| EPS | 4.7 | -2.33 |
| Fiscal Year | 2024 | 2024 |
Income Statement Interpretations
Block, Inc.
Block, Inc. showed a strong upward trend in revenue, rising from 9.5B in 2020 to 24.1B in 2024, with net income swinging from a loss of 540M in 2022 to a positive 2.9B in 2024. Gross margin remained favorable at 36.85%, while net margin improved to 12.01%. The latest year reflected significant growth in profitability and earnings per share, indicating robust operational improvements.
CoreWeave, Inc. Class A Common Stock
CoreWeave, Inc. experienced rapid revenue growth, surging from 15.8M in 2022 to 1.9B in 2024, yet net income remained negative, widening its loss to 863M in 2024. Despite a high gross margin of 74.24%, EBIT and net margins were unfavorable, with interest expenses significantly impacting profitability. The latest year showed strong revenue expansion but sustained losses and negative earnings per share.
Which one has the stronger fundamentals?
Block, Inc. demonstrates stronger fundamentals with consistent revenue and net income growth, favorable margins, and improved profitability metrics over the period. CoreWeave, while showing impressive revenue growth, faces challenges with negative net income, high interest costs, and weak margins. Overall, Block’s income statement reflects more stable and positive financial health.
Financial Ratios Comparison
The table below compares key financial ratios for Block, Inc. (XYZ) and CoreWeave, Inc. Class A Common Stock (CRWV) based on their latest fiscal year data ending 2024.
| Ratios | Block, Inc. (XYZ) | CoreWeave, Inc. (CRWV) |
|---|---|---|
| ROE | 13.62% | 208.77% |
| ROIC | 3.03% | 2.08% |
| P/E | 18.1 | -18.73 |
| P/B | 2.47 | -39.11 |
| Current Ratio | 2.33 | 0.39 |
| Quick Ratio | 2.31 | 0.39 |
| D/E | 0.37 | -25.68 |
| Debt-to-Assets | 21.5% | 59.6% |
| Interest Coverage | 95.9 | 0.90 |
| Asset Turnover | 0.66 | 0.11 |
| Fixed Asset Turnover | 45.1 | 0.13 |
| Payout ratio | 0 | -6.69% |
| Dividend yield | 0% | 0.36% |
Interpretation of the Ratios
Block, Inc.
Block, Inc. shows a mix of strong and weak financial ratios in 2024. Key strengths include a favorable net margin of 12.01%, solid liquidity with a current ratio of 2.33, and low debt levels, indicated by a debt-to-equity of 0.37. However, return on invested capital (3.03%) and WACC (14.27%) are unfavorable, suggesting some inefficiency in capital use. The company does not pay dividends, likely reinvesting in growth and innovation.
CoreWeave, Inc. Class A Common Stock
CoreWeave’s 2024 ratios are largely unfavorable, highlighted by a negative net margin of -45.08%, low liquidity with a current ratio of 0.39, and high debt-to-assets at 59.56%. Despite an exceptionally high ROE of 208.77%, the company faces challenges such as negative interest coverage and poor asset turnover. It also pays no dividends, probably focusing on expanding its cloud infrastructure and technology capabilities.
Which one has the best ratios?
Block, Inc. presents a more balanced ratio profile with half of its ratios favorable and manageable debt, reflecting moderate financial health. CoreWeave, while showing impressive ROE, suffers from multiple liquidity and profitability issues, with over 70% of ratios unfavorable. Overall, Block, Inc.’s ratios appear more stable and less risky than CoreWeave’s as of 2024.
Strategic Positioning
This section compares the strategic positioning of Block, Inc. and CoreWeave, Inc. regarding market position, key segments, and exposure to technological disruption:
Block, Inc.
- Established player in payment solutions, facing competition in software infrastructure.
- Diverse business segments: payments, hardware, software, cryptocurrency assets, and Cash App.
- Moderate exposure via evolving payment technologies and cryptocurrency integration.
CoreWeave, Inc. Class A Common Stock
- Emerging cloud platform provider with high market volatility and competition.
- Focused on GPU/CPU compute, storage, networking, and AI acceleration services.
- High exposure due to reliance on fast-evolving AI and cloud infrastructure technologies.
Block, Inc. vs CoreWeave, Inc. Class A Common Stock Positioning
Block shows a diversified approach spanning payments, hardware, and crypto assets, providing multiple revenue streams. CoreWeave concentrates on cloud and AI infrastructure, exposing it to rapid tech shifts but with a focused business model and smaller workforce.
Which has the best competitive advantage?
Both companies are currently shedding value with ROIC below WACC; however, Block exhibits a growing ROIC trend, suggesting improving profitability, whereas CoreWeave shows stable but unfavorable value destruction, indicating Block may possess a slightly stronger competitive moat.
Stock Comparison
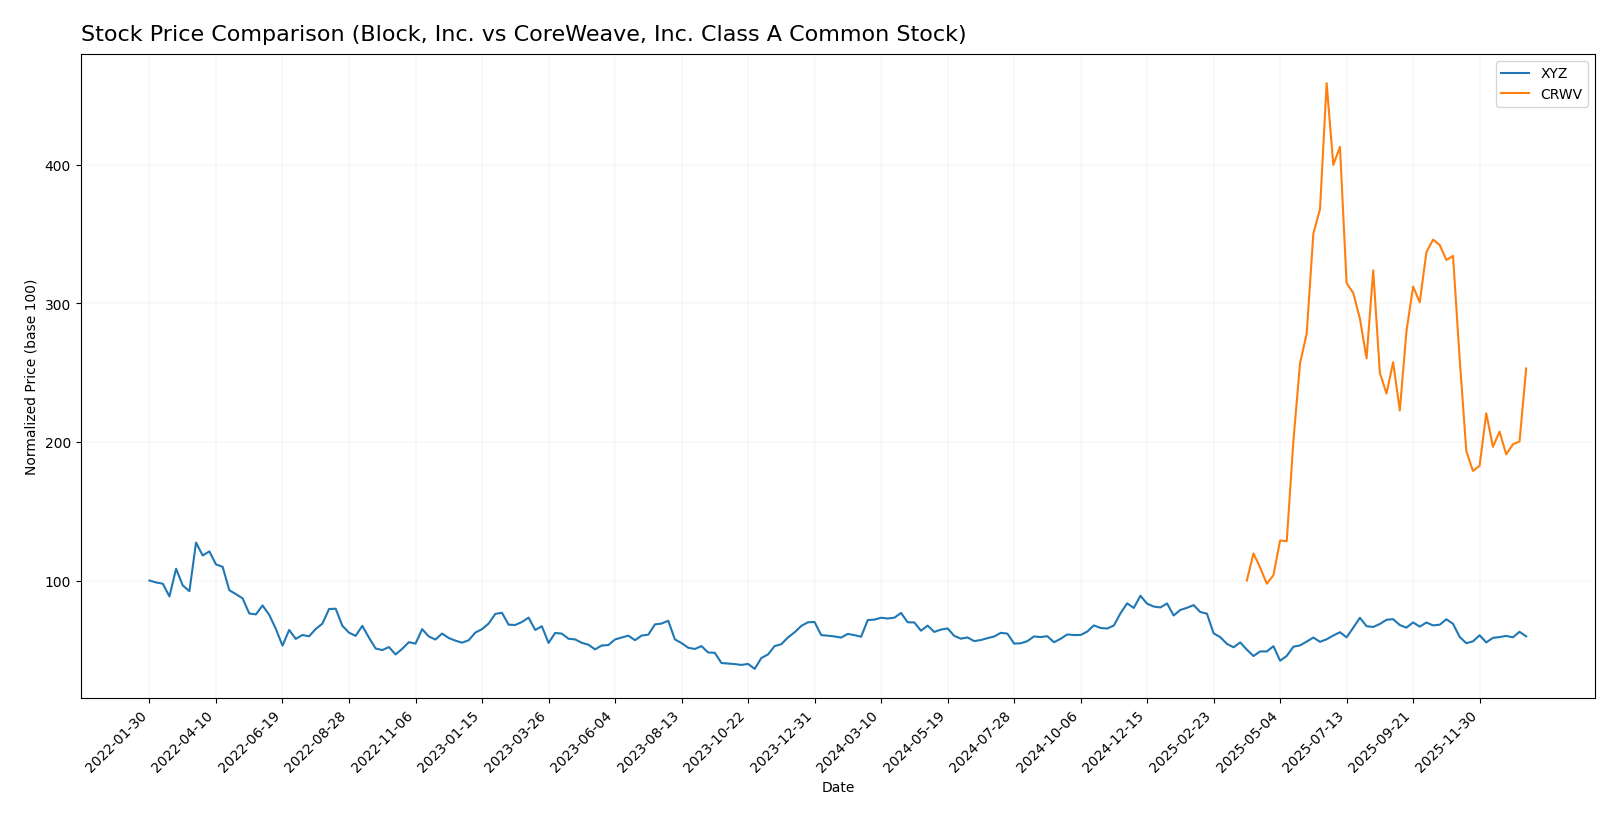
The stock price evolution of Block, Inc. and CoreWeave, Inc. Class A Common Stock over the past year reveals contrasting trends, with CoreWeave showing significant gains despite recent pullbacks, while Block experiences an overall decline with slowing momentum.
Trend Analysis
Block, Inc. (XYZ) exhibited a bearish trend over the past 12 months, with a price decrease of 16.43%, decelerating in momentum. The stock fluctuated between a high of 98.25 and a low of 46.53, with moderate volatility (std deviation 10.43).
CoreWeave, Inc. Class A (CRWV) showed a strong bullish trend over the same period, gaining 153.08% despite recent deceleration and a notable short-term drop of 24.29%. Price ranged from 39.09 to 183.58, reflecting higher volatility (std deviation 35.67).
Comparing both, CoreWeave delivered the highest market performance with a substantial overall gain, while Block recorded a significant loss, indicating divergent investor sentiment and trading dynamics.
Target Prices
The target price consensus for these companies reflects positive analyst outlooks with significant upside potential.
| Company | Target High | Target Low | Consensus |
|---|---|---|---|
| Block, Inc. | 100 | 65 | 84.91 |
| CoreWeave, Inc. Class A Common Stock | 175 | 68 | 115.79 |
Analysts expect Block, Inc. shares to rise above the current price of 65.95 USD, while CoreWeave, Inc. shows a strong target consensus well above its current price of 101.23 USD. Both stocks present attractive upside potential based on this data.
Analyst Opinions Comparison
This section compares analysts’ ratings and grades for Block, Inc. and CoreWeave, Inc. Class A Common Stock:
Rating Comparison
Block, Inc. Rating
- Rating: B+, considered very favorable by analysts.
- Discounted Cash Flow Score: 3, moderate valuation assessment.
- ROE Score: 4, favorable efficiency in generating profit from equity.
- ROA Score: 4, favorable asset utilization to generate earnings.
- Debt To Equity Score: 2, moderate level of financial risk.
- Overall Score: 3, moderate overall financial standing.
CoreWeave, Inc. Rating
- Rating: D+, considered very unfavorable by analysts.
- Discounted Cash Flow Score: 1, very unfavorable valuation assessment.
- ROE Score: 1, very unfavorable profit generation from equity.
- ROA Score: 1, very unfavorable asset utilization to generate earnings.
- Debt To Equity Score: 1, very unfavorable financial risk due to debt.
- Overall Score: 1, very unfavorable overall financial standing.
Which one is the best rated?
Based strictly on the provided data, Block, Inc. is clearly better rated with a B+ rating and favorable scores in ROE and ROA. CoreWeave, Inc. shows very unfavorable scores and a D+ rating across all key financial metrics.
Scores Comparison
The scores comparison between Block, Inc. and CoreWeave, Inc. Class A Common Stock is as follows:
Block, Inc. Scores
- Altman Z-Score: 2.70, in the grey zone indicating moderate bankruptcy risk.
- Piotroski Score: 6, classified as average financial strength.
CoreWeave, Inc. Scores
- Altman Z-Score: 0.80, in the distress zone indicating high bankruptcy risk.
- Piotroski Score: 3, classified as very weak financial strength.
Which company has the best scores?
Block, Inc. shows better financial health with a higher Altman Z-Score in the grey zone and an average Piotroski Score. CoreWeave has both scores in weaker zones, indicating higher financial risk.
Grades Comparison
Here is the grades comparison for Block, Inc. and CoreWeave, Inc. Class A Common Stock:
Block, Inc. Grades
The latest grades from reputable firms for Block, Inc. are as follows:
| Grading Company | Action | New Grade | Date |
|---|---|---|---|
| Piper Sandler | Maintain | Underweight | 2026-01-14 |
| Keefe, Bruyette & Woods | Maintain | Outperform | 2026-01-02 |
| Needham | Maintain | Buy | 2025-11-24 |
| B of A Securities | Maintain | Buy | 2025-11-21 |
| Morgan Stanley | Maintain | Equal Weight | 2025-11-21 |
| BTIG | Maintain | Buy | 2025-11-20 |
| RBC Capital | Maintain | Outperform | 2025-11-20 |
| Stephens & Co. | Maintain | Overweight | 2025-11-20 |
| Mizuho | Maintain | Outperform | 2025-11-20 |
| BTIG | Maintain | Buy | 2025-11-14 |
Block, Inc. shows a generally positive rating trend, with multiple “Buy” and “Outperform” grades, despite one “Underweight” rating.
CoreWeave, Inc. Class A Common Stock Grades
The latest grades from reputable firms for CoreWeave, Inc. Class A Common Stock are as follows:
| Grading Company | Action | New Grade | Date |
|---|---|---|---|
| Barclays | Maintain | Equal Weight | 2026-01-12 |
| Wells Fargo | Maintain | Overweight | 2026-01-08 |
| Jefferies | Maintain | Buy | 2026-01-05 |
| DA Davidson | Upgrade | Neutral | 2026-01-05 |
| Goldman Sachs | Maintain | Neutral | 2025-11-17 |
| HC Wainwright & Co. | Maintain | Buy | 2025-11-12 |
| Wells Fargo | Maintain | Overweight | 2025-11-12 |
| Barclays | Maintain | Equal Weight | 2025-11-12 |
| Loop Capital | Maintain | Buy | 2025-11-12 |
| B of A Securities | Maintain | Neutral | 2025-11-11 |
CoreWeave, Inc. exhibits a mixed but generally favorable rating pattern, with a balance of “Buy,” “Overweight,” and “Neutral” grades.
Which company has the best grades?
Block, Inc. has received more consistent “Buy” and “Outperform” grades compared to CoreWeave’s mix of “Buy,” “Overweight,” and “Neutral.” This suggests Block may be viewed more favorably by analysts, potentially influencing investor confidence and portfolio weighting decisions.
Strengths and Weaknesses
Below is a comparative overview of key strengths and weaknesses for Block, Inc. (XYZ) and CoreWeave, Inc. Class A Common Stock (CRWV) based on the most recent financial and operational data.
| Criterion | Block, Inc. (XYZ) | CoreWeave, Inc. Class A (CRWV) |
|---|---|---|
| Diversification | High: Revenue from software, crypto assets, hardware, and transactions | Low: Limited product/service diversification reported |
| Profitability | Moderate: Net margin at 12.01%, but ROIC below WACC (3.03% vs 14.27%) | Poor: Negative net margin (-45.08%), ROIC below WACC (2.08% vs 84.93%) |
| Innovation | Strong: Growing ROIC trend indicating improving profitability | Weak: No growth in ROIC, unfavorable profitability |
| Global presence | Solid: Diverse revenue streams suggest broad market engagement | Limited data, likely smaller or niche market presence |
| Market Share | Significant in fintech and crypto-related markets | Emerging player with high risk profile |
Block, Inc. demonstrates a diversified business model and improving profitability despite some value destruction, suggesting potential for recovery and growth. CoreWeave faces significant challenges with poor profitability, low liquidity ratios, and high leverage, indicating higher investment risk. Caution and rigorous risk management are advised when considering CoreWeave.
Risk Analysis
The table below summarizes key risks for Block, Inc. (XYZ) and CoreWeave, Inc. Class A Common Stock (CRWV) based on their latest financial and operational data from 2024.
| Metric | Block, Inc. (XYZ) | CoreWeave, Inc. (CRWV) |
|---|---|---|
| Market Risk | Beta 2.67: High volatility risk | Beta 21.65: Extremely high volatility risk |
| Debt Level | Debt-to-Equity 0.37: Low risk | Debt-to-Equity -25.68 (unusual): High leverage concerns |
| Regulatory Risk | Moderate, US and international markets | Moderate, US cloud infrastructure regulation |
| Operational Risk | Moderate, reliance on payment hardware/software | High, early-stage cloud infrastructure with limited scale |
| Environmental Risk | Low, typical technology sector | Low, data center energy use under watch |
| Geopolitical Risk | Moderate, international exposure | Moderate, US-based but serving global clients |
Block, Inc. shows manageable debt and moderate operational risk with high market volatility (beta 2.67). CoreWeave faces extreme volatility, significant financial distress signals (Altman Z-score in distress zone), and operational risks due to its early growth phase and high debt levels. Market and financial stability risks are most impactful for CoreWeave.
Which Stock to Choose?
Block, Inc. (XYZ) shows favorable income evolution with strong revenue and net margin growth, supported by a slightly favorable global ratios opinion. Its profitability is positive, debt levels are well managed, and it holds a very favorable B+ rating, indicating financial stability despite a slightly unfavorable MOAT status.
CoreWeave, Inc. Class A Common Stock (CRWV) exhibits impressive revenue growth but suffers from negative net margins and profitability challenges. Its financial ratios are largely unfavorable, with high debt and liquidity concerns, and it holds a very unfavorable D+ rating, reflecting significant financial risk and an unfavorable MOAT status.
Investors focused on growth might find CoreWeave’s rapid revenue expansion appealing despite its financial risks, while those prioritizing stability and moderate profitability could view Block’s overall stronger financial health and rating as more suitable. The choice could depend on the investor’s risk tolerance and strategy.
Disclaimer: Investment carries a risk of loss of initial capital. The past performance is not a reliable indicator of future results. Be sure to understand risks before making an investment decision.
Go Further
I encourage you to read the complete analyses of Block, Inc. and CoreWeave, Inc. Class A Common Stock to enhance your investment decisions: