Home > Comparison > Financial Services > BX vs BK
The strategic rivalry between Blackstone Inc. and The Bank of New York Mellon Corporation shapes asset management’s evolution. Blackstone operates as a diversified alternative asset manager focused on private equity and real estate. In contrast, BNY Mellon excels as a global custodian offering securities services and wealth management. This analysis pits Blackstone’s growth-oriented platform against BNY Mellon’s fee-based stability to identify the superior risk-adjusted investment for diversified portfolios.

Table of contents
Companies Overview
Blackstone Inc. and The Bank of New York Mellon Corporation dominate the asset management landscape with distinct market roles and strategies.
Blackstone Inc.: Alternative Asset Powerhouse
Blackstone Inc. leads as a specialist in alternative asset management. It generates revenue through private equity, real estate, hedge funds, and credit investments. In 2026, Blackstone’s strategic focus remains on opportunistic real estate and global private equity, seeking growth in Asia and Latin America while leveraging diversified investment vehicles.
The Bank of New York Mellon Corporation: Custody and Wealth Management Leader
BNY Mellon stands as a global custodian and wealth manager. Its core revenue comes from securities services, market and wealth services, and investment management. The firm’s 2026 strategy emphasizes integrated cash management, technology-driven custody solutions, and expanding private banking for high-net-worth clients worldwide.
Strategic Collision: Similarities & Divergences
Both firms excel in asset management but diverge sharply in approach. Blackstone pursues active investment and alternative assets, while BNY Mellon focuses on custody, administration, and wealth services. Their primary battleground is global capital flow management, yet Blackstone’s risk-taking contrasts with BNY Mellon’s stable, service-driven model. This distinction shapes contrasting investment profiles: growth-oriented versus income and stability-focused.
Income Statement Comparison
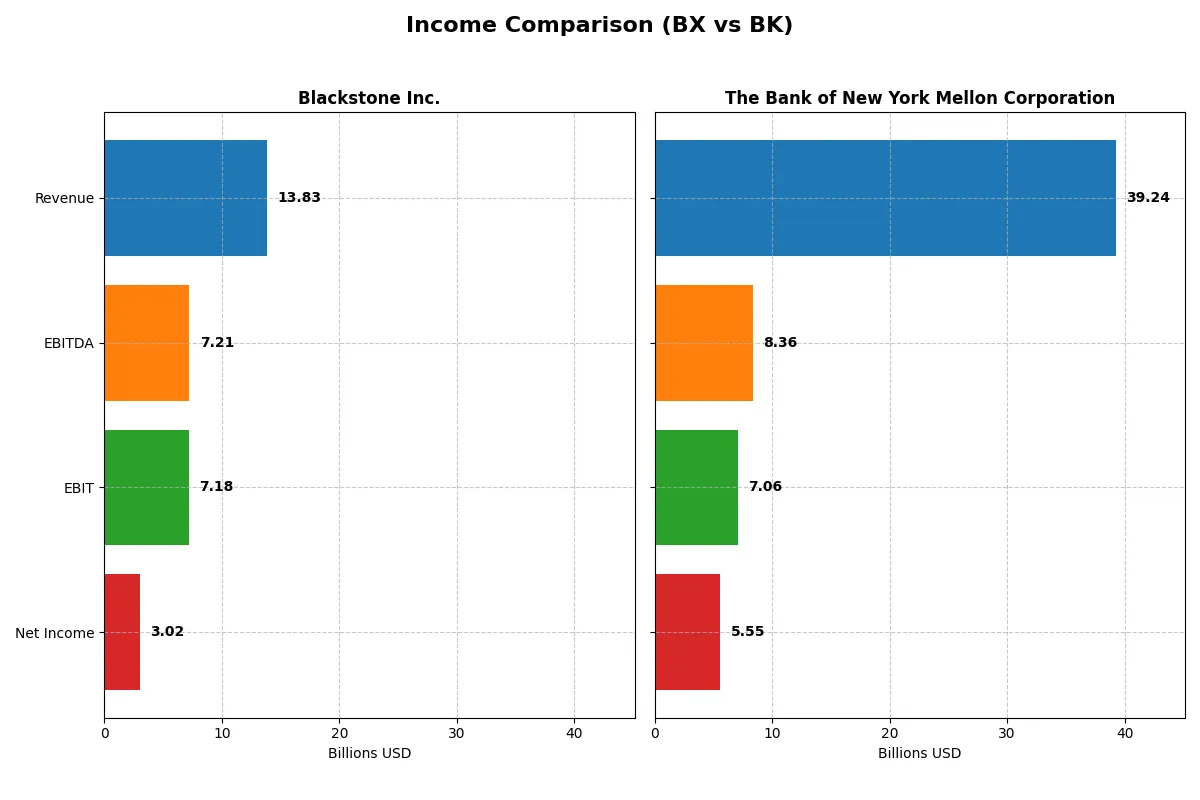
This data dissects the core profitability and scalability of both corporate engines to reveal who dominates the bottom line:
| Metric | Blackstone Inc. (BX) | The Bank of New York Mellon Corporation (BK) |
|---|---|---|
| Revenue | 13.8B | 39.2B |
| Cost of Revenue | 1.9B | 19.4B |
| Operating Expenses | 4.7B | 12.8B |
| Gross Profit | 11.9B | 19.9B |
| EBITDA | 7.2B | 8.4B |
| EBIT | 7.2B | 7.1B |
| Interest Expense | 0.5B | 20.7B |
| Net Income | 3.0B | 5.3B |
| EPS | 3.88 | 7.46 |
| Fiscal Year | 2025 | 2025 |
Income Statement Analysis: The Bottom-Line Duel
This income statement comparison reveals which company converts revenue into profit more efficiently and sustains margin strength.
Blackstone Inc. Analysis
Blackstone’s revenue grew from $7.4B in 2023 to $13.8B in 2025, showing strong momentum. The gross margin stayed robust at 86%, and EBIT margin remained high near 52%. Despite a favorable revenue jump of 21.6% in 2025, net income growth slowed, reflecting margin pressure. Overall, Blackstone maintains excellent profitability with improving operational efficiency.
The Bank of New York Mellon Corporation Analysis
BNY Mellon’s revenue held steady near $39B in 2024 and 2025, showing mature scale. Its gross margin of 50.6% and EBIT margin of 18% lag behind Blackstone but remain solid for banking. Net income rose 23.5% in 2025, driven by a 27.8% EPS increase, signaling improving bottom-line momentum despite slight revenue decline. The bank balances scale with margin expansion.
Margin Excellence vs. Scale Stability
Blackstone leads in margin dominance and operational efficiency, boasting superior gross and EBIT margins. BNY Mellon excels in revenue scale with steady profit growth and EPS momentum. Blackstone’s profile appeals to investors favoring high-margin, efficient operations, while BNY Mellon suits those prioritizing consistent scale and improving earnings growth.
Financial Ratios Comparison
These vital ratios act as a diagnostic tool to expose the underlying fiscal health, valuation premiums, and capital efficiency of the companies compared below:
| Ratios | Blackstone Inc. (BX) | The Bank of New York Mellon Corporation (BK) |
|---|---|---|
| ROE | 33.8% | 12.5% |
| ROIC | 12.5% | 6.4% |
| P/E | 39.9 | 14.7 |
| P/B | 16.1 | 1.8 |
| Current Ratio | N/A | 0.70 |
| Quick Ratio | N/A | 0.70 |
| D/E | 1.50 | 0.76 |
| Debt-to-Assets | 28.3% | 7.2% |
| Interest Coverage | 14.6 | 0.34 |
| Asset Turnover | 0.26 | 0.08 |
| Fixed Asset Turnover | 8.46 | 10.96 |
| Payout ratio | 121.3% | 25.4% |
| Dividend yield | 3.35% | 1.72% |
| Fiscal Year | 2025 | 2025 |
Efficiency & Valuation Duel: The Vital Signs
Financial ratios act as a company’s DNA, uncovering hidden risks and operational strengths crucial for investment decisions.
Blackstone Inc.
Blackstone shows a high net margin of 21.83%, signaling strong profitability, but lacks return on equity and invested capital data, which raises concerns. Its P/E ratio at 39.87 suggests an expensive valuation relative to earnings. The dividend yield of 3.04% rewards shareholders, balancing a slightly unfavorable overall ratio profile.
The Bank of New York Mellon Corporation
BNY Mellon posts a moderate net margin of 14.14% and a ROE of 12.52%, reflecting reasonable profitability and efficiency. Its P/E of 14.74 indicates a more attractive valuation compared to Blackstone. Dividend yield is lower at 1.72%, and while some leverage and coverage ratios are weak, the company maintains a diverse ratio profile with mixed neutrality.
Premium Valuation vs. Balanced Profitability
Blackstone’s elevated valuation contrasts with BNY Mellon’s more modest price multiples and steadier returns. Blackstone suits investors seeking income through dividends amid stretched valuation, while BNY Mellon fits those prioritizing valuation discipline and moderate profitability. Each profile appeals to distinct risk-reward appetites.
Which one offers the Superior Shareholder Reward?
I compare Blackstone Inc. (BX) and The Bank of New York Mellon Corporation (BK) on dividend yield, payout ratios, and buyback intensity to assess shareholder reward in 2026. BX offers a 3.0–4.4% dividend yield but with payout ratios exceeding 100%, signaling potential sustainability risks. BK yields 1.7–3.6% with conservative payout ratios around 25–54%, suggesting safer distributions. BX’s payout may rely heavily on capital gains and buybacks, which have been aggressive, enhancing total returns but adding volatility. BK’s modest dividend is complemented by restrained buybacks, reflecting a stable, risk-managed approach. I see BX’s model as higher reward but riskier; BK offers steadier, more sustainable income. For 2026, I favor BX for superior total return potential, provided investors tolerate payout volatility and capital cycle risks.
Comparative Score Analysis: The Strategic Profile
The radar chart below reveals the fundamental DNA and trade-offs of Blackstone Inc. and The Bank of New York Mellon Corporation:
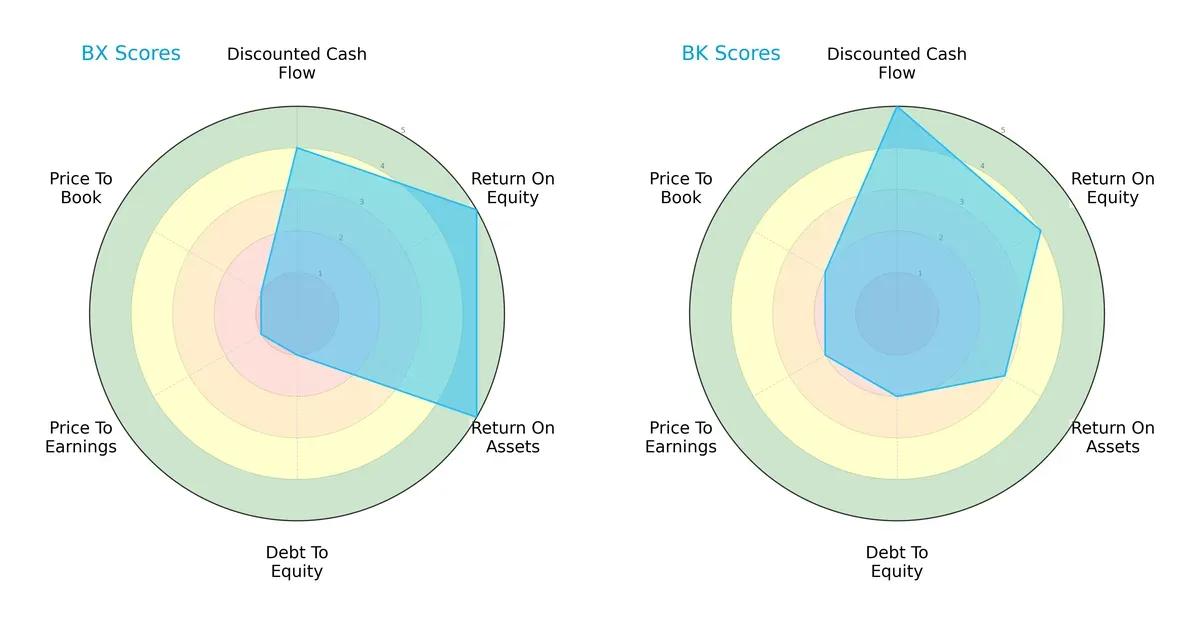
Blackstone excels in profitability with top ROE (5) and ROA (5) scores, but it carries heavy financial risk, reflected in very poor Debt/Equity (1) and valuation scores (PE/PB scores of 1). In contrast, BNY Mellon shows a more balanced profile with moderate scores across leverage (2) and valuation (2), and a strong DCF score (5). Blackstone relies on operational efficiency for advantage, while BNY Mellon offers steadier financial stability.
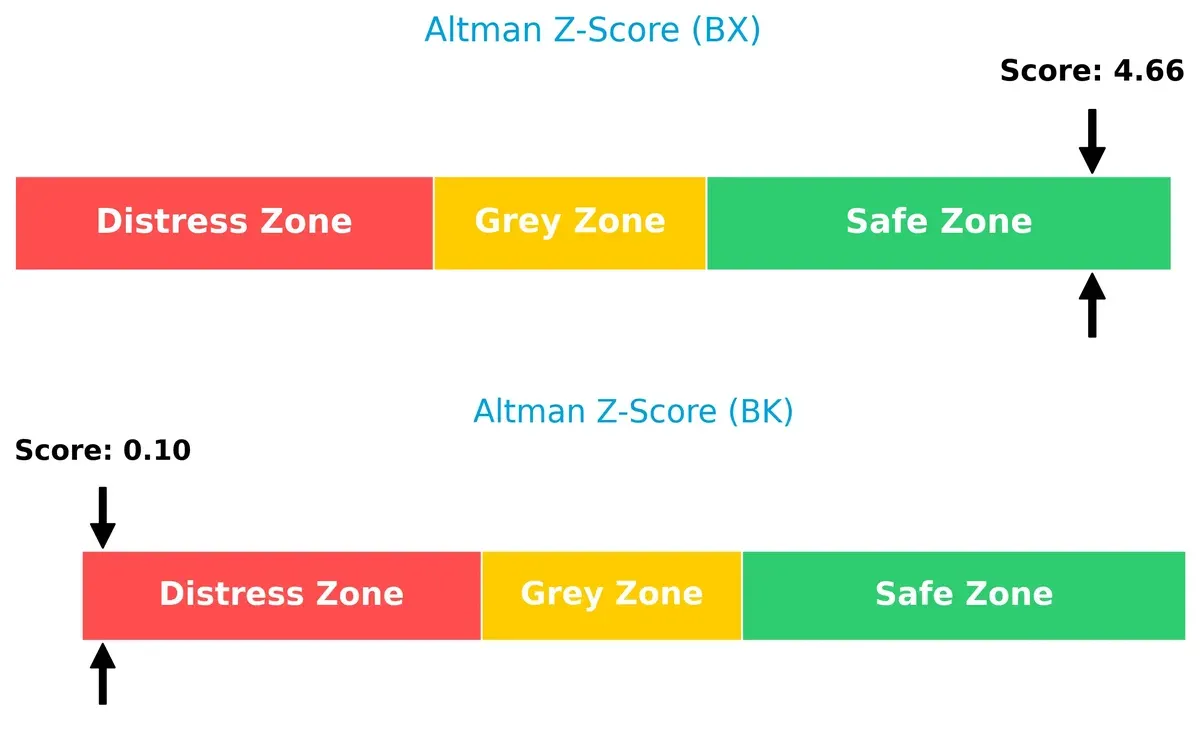
Bankruptcy Risk: Solvency Showdown
Blackstone’s Altman Z-Score of 4.66 signals a robust safety margin, whereas BNY Mellon’s 0.10 places it in distress territory. This gap highlights Blackstone’s superior long-term survival prospects in this cycle:
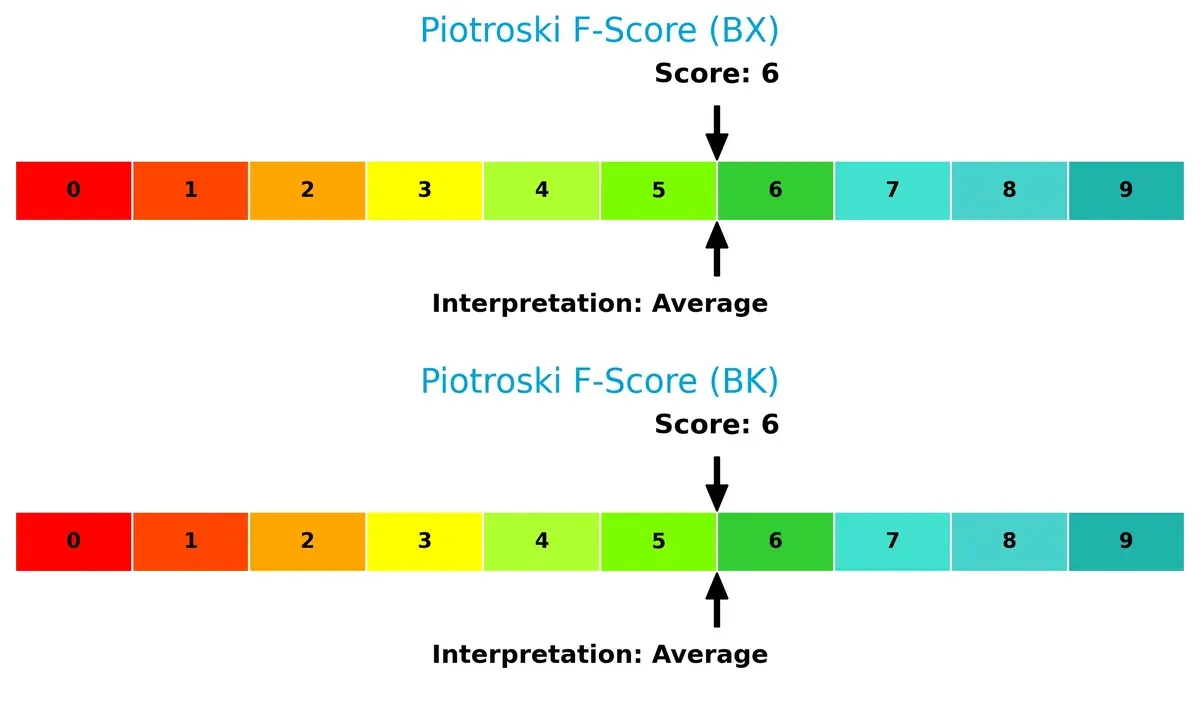
Financial Health: Quality of Operations
Both firms score a 6 on the Piotroski F-Score, indicating average financial health without glaring red flags internally. Neither company currently signals severe operational weaknesses:
How are the two companies positioned?
This section dissects BX and BK’s operational DNA by comparing revenue distribution and internal strengths and weaknesses. The goal is to confront their economic moats and identify which model offers the most resilient, sustainable competitive edge today.
Revenue Segmentation: The Strategic Mix
The following visual comparison dissects how both firms diversify their income streams and where their primary sector bets lie:
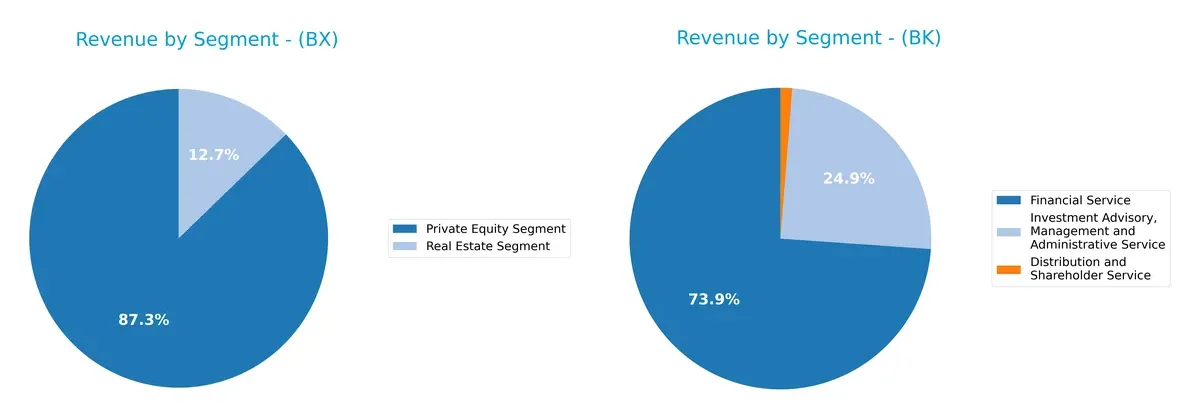
Blackstone Inc. (BX) anchors its revenue in Private Equity, generating $1.39B in 2024, with Real Estate trailing at $203M, showing moderate concentration risk. In contrast, The Bank of New York Mellon Corporation (BK) pivots on Financial Service ($9.34B) and Investment Advisory/Management ($3.14B), revealing a more diversified and balanced revenue mix. BK’s segmentation supports ecosystem lock-in, while BX’s reliance on Private Equity suggests exposure to market cycles.
Strengths and Weaknesses Comparison
This table compares the Strengths and Weaknesses of Blackstone Inc. and The Bank of New York Mellon Corporation:
Blackstone Inc. Strengths
- High net margin at 21.83%
- Favorable debt to equity and debt to assets
- Strong interest coverage ratio of 14.12
- Diverse revenue streams including Private Equity and Real Estate segments
The Bank of New York Mellon Corporation Strengths
- Favorable net margin at 14.14%
- Favorable price-to-earnings ratio of 14.74
- Strong fixed asset turnover at 10.96
- Geographic diversification with significant revenues from US, EMEA, and Asia Pacific
Blackstone Inc. Weaknesses
- Unfavorable ROE and ROIC at 0%
- Unavailable WACC data
- Unfavorable current and quick ratios at zero
- Unfavorable asset and fixed asset turnover
The Bank of New York Mellon Corporation Weaknesses
- Unfavorable WACC at 19.98%
- Low current and quick ratios at 0.7
- Weak interest coverage ratio at 0.34
- Moderate debt-to-equity ratio of 0.76 and some unfavorable asset turnover
Both companies show slightly unfavorable overall financial ratios. Blackstone excels in profitability margins and leverage management but faces liquidity and return on capital issues. BNY Mellon benefits from geographic and asset turnover strengths but contends with higher WACC and liquidity concerns, impacting capital efficiency.
The Moat Duel: Analyzing Competitive Defensibility
A structural moat shields long-term profits from relentless competitive pressures. Without it, earnings erode swiftly. Let’s dissect the economic moats of Blackstone Inc. and BNY Mellon:
Blackstone Inc.: Diversified Alternative Asset Moat
Blackstone’s moat stems from its broad alternative asset platform, leveraging intangible assets and scale. Its income statement shows margin strength but declining ROIC signals pressure on capital efficiency. New strategies in energy and Asia could deepen its moat if executed well.
The Bank of New York Mellon Corporation: Custody & Data Network Moat
BNY Mellon’s moat relies on network effects and switching costs in securities services and custody. Despite shedding value (ROIC < WACC), improving ROIC trends and robust revenue growth highlight strengthening competitive positioning. Expansion in global wealth management offers upside.
Moat Resilience: Alternative Assets vs. Custody Network
Blackstone commands a wide moat via asset diversification but faces capital efficiency erosion. BNY Mellon’s moat is narrower but shows resilience with growing ROIC and strong revenue gains. I see BNY Mellon better positioned to defend its market share in 2026.
Which stock offers better returns?
The past year reveals strong bullish momentum for both stocks, with The Bank of New York Mellon Corporation showing a notably higher price surge, accompanied by distinct trading volume dynamics.
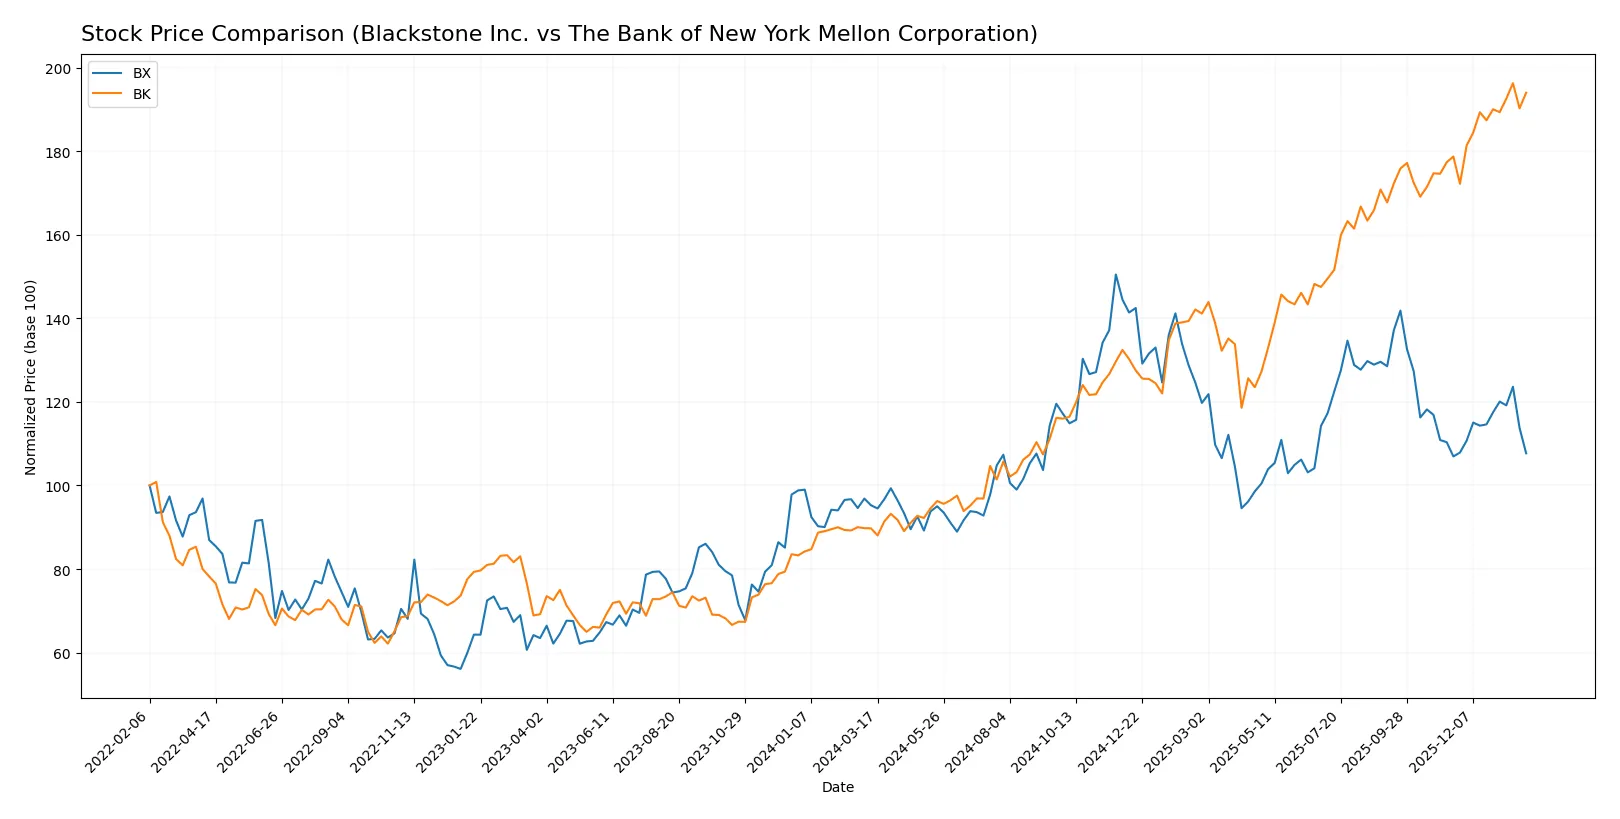
Trend Comparison
Blackstone Inc. (BX) shows a 13.04% price increase over the past 12 months, signaling a bullish trend with accelerating momentum and a high volatility level (20.31 std dev). The stock hit a peak of 199.05 and a low of 117.62.
The Bank of New York Mellon Corporation (BK) outperformed with a 116.19% gain over the same period. It also exhibits a bullish trend with acceleration and similar volatility (19.39 std dev). Its price ranged between 54.41 and 121.33.
BK’s stock delivered significantly higher returns than BX, demonstrating stronger market performance and buyer dominance despite a decreasing volume trend overall.
Target Prices
Analysts present a moderate upside potential for both Blackstone Inc. and The Bank of New York Mellon Corporation.
| Company | Target Low | Target High | Consensus |
|---|---|---|---|
| Blackstone Inc. | 164 | 215 | 179.83 |
| The Bank of New York Mellon Corp. | 110 | 143 | 130.25 |
The consensus target for Blackstone Inc. suggests a 26% premium to its current price of $142.42. For BNY Mellon, the consensus implies an 8.5% upside from $119.92. Both stocks show solid analyst confidence relative to current market prices.

Don’t Let Luck Decide Your Entry Point
Optimize your entry points with our advanced ProRealTime indicators. You’ll get efficient buy signals with precise price targets for maximum performance. Start outperforming now!
How do institutions grade them?
The institutional grade comparison for Blackstone Inc. and The Bank of New York Mellon Corporation is as follows:
Blackstone Inc. Grades
The table below shows recent grades from reputable financial institutions for Blackstone Inc.:
| Grading Company | Action | New Grade | Date |
|---|---|---|---|
| JP Morgan | maintain | Neutral | 2026-01-30 |
| Barclays | maintain | Equal Weight | 2026-01-30 |
| TD Cowen | maintain | Buy | 2026-01-30 |
| Citizens | maintain | Market Outperform | 2026-01-30 |
| TD Cowen | maintain | Buy | 2026-01-14 |
| UBS | maintain | Neutral | 2026-01-13 |
| Barclays | maintain | Equal Weight | 2026-01-09 |
| Barclays | maintain | Equal Weight | 2025-12-12 |
| TD Cowen | maintain | Buy | 2025-10-24 |
| Barclays | maintain | Equal Weight | 2025-10-24 |
The Bank of New York Mellon Corporation Grades
The table below summarizes recent grades from well-known grading companies for The Bank of New York Mellon Corporation:
| Grading Company | Action | New Grade | Date |
|---|---|---|---|
| Citigroup | maintain | Neutral | 2026-01-14 |
| Morgan Stanley | maintain | Overweight | 2026-01-14 |
| RBC Capital | maintain | Sector Perform | 2026-01-14 |
| Wells Fargo | maintain | Equal Weight | 2026-01-14 |
| Keefe, Bruyette & Woods | maintain | Outperform | 2026-01-14 |
| Truist Securities | upgrade | Buy | 2026-01-07 |
| TD Cowen | maintain | Buy | 2026-01-07 |
| Barclays | maintain | Overweight | 2026-01-05 |
| Morgan Stanley | maintain | Overweight | 2025-12-17 |
| TD Cowen | maintain | Buy | 2025-10-20 |
Which company has the best grades?
The Bank of New York Mellon Corporation generally holds stronger grades with multiple “Overweight,” “Outperform,” and upgrades to “Buy.” Blackstone Inc. shows a mix of “Neutral,” “Equal Weight,” and “Buy” ratings. This suggests investors may perceive BK as having greater near-term growth potential or stability.
Risks specific to each company
The following categories identify the critical pressure points and systemic threats facing both firms in the 2026 market environment:
1. Market & Competition
Blackstone Inc.
- Operates in competitive alternative asset management with diverse strategies but faces pressure from private equity and real estate cycles.
The Bank of New York Mellon Corporation
- Competes in custody, wealth, and investment services with large incumbents and fintech disruption risks.
2. Capital Structure & Debt
Blackstone Inc.
- Low debt-to-equity ratio signals conservative leverage; strong interest coverage ratio supports debt servicing.
The Bank of New York Mellon Corporation
- Moderate debt-to-equity ratio with weak interest coverage of 0.34 raises concerns over debt burden and financial flexibility.
3. Stock Volatility
Blackstone Inc.
- Beta of 1.75 indicates high stock volatility, reflecting sensitivity to market swings.
The Bank of New York Mellon Corporation
- Beta of 1.11 suggests moderate volatility, more stable relative to Blackstone.
4. Regulatory & Legal
Blackstone Inc.
- Subject to extensive regulation in financial services and cross-border investments; operational risks from compliance.
The Bank of New York Mellon Corporation
- Faces stringent regulatory scrutiny in custody, asset management, and banking operations globally.
5. Supply Chain & Operations
Blackstone Inc.
- Relies on global real estate and credit markets; operational risks tied to asset valuation and transaction execution.
The Bank of New York Mellon Corporation
- Dependent on technology infrastructure and data management, with operational risk from cyber threats and system failures.
6. ESG & Climate Transition
Blackstone Inc.
- Invests in alternative energy and greenfield projects but exposed to transition risks in real estate and energy sectors.
The Bank of New York Mellon Corporation
- Integrates ESG in investment services but faces pressure to improve sustainability practices and disclosures.
7. Geopolitical Exposure
Blackstone Inc.
- Significant exposure to Asia, Europe, and Latin America markets increases geopolitical and currency risks.
The Bank of New York Mellon Corporation
- Global operations expose it to geopolitical tensions, trade policies, and regulatory changes across multiple jurisdictions.
Which company shows a better risk-adjusted profile?
Blackstone’s strongest risk is high stock volatility and valuation concerns, despite solid debt metrics. BNY Mellon’s critical risk lies in weak interest coverage and financial distress signals from its Altman Z-score. Blackstone displays a safer bankruptcy profile with a 4.66 Altman Z-score versus BNY Mellon’s 0.10 in the distress zone. Overall, Blackstone presents a better risk-adjusted profile, benefiting from conservative leverage and stronger financial stability, despite market sensitivity. Meanwhile, BNY Mellon’s financial distress and operational leverage warrant caution amid evolving market and regulatory pressures.
Final Verdict: Which stock to choose?
Blackstone Inc. (BX) excels as a cash machine with strong operational margins and impressive income quality. Its main point of vigilance lies in a declining ROIC trend and stretched valuation multiples. BX fits portfolios targeting aggressive growth with a tolerance for cyclical fluctuations.
The Bank of New York Mellon (BK) boasts a strategic moat in its stable recurring revenue streams and improving ROIC trajectory. Though it carries more financial leverage and a tighter liquidity profile than BX, BK offers better stability and a more reasonable valuation. It suits investors focused on GARP—growth at a reasonable price.
If you prioritize aggressive growth and high operational efficiency, BX is the compelling choice due to its superior income margins and cash generation. However, if you seek stability with a growing profitability trend and moderate valuation, BK offers better risk management and long-term resilience. Both present slightly unfavorable ratio profiles, so careful risk assessment is essential.
Disclaimer: Investment carries a risk of loss of initial capital. The past performance is not a reliable indicator of future results. Be sure to understand risks before making an investment decision.
Go Further
I encourage you to read the complete analyses of Blackstone Inc. and The Bank of New York Mellon Corporation to enhance your investment decisions: