Home > Comparison > Financial Services > BX vs TROW
The strategic rivalry between Blackstone Inc. and T. Rowe Price Group defines the current trajectory of the asset management sector. Blackstone operates as a diversified alternative asset manager with a focus on private equity and real estate, while T. Rowe Price emphasizes traditional public equity and fixed income management with a strong ESG commitment. This analysis evaluates which model offers superior risk-adjusted returns for a diversified portfolio in today’s complex financial landscape.
Table of contents
Companies Overview
Blackstone Inc. and T. Rowe Price Group, Inc. stand as pivotal players in the asset management landscape, shaping diverse investment strategies.
Blackstone Inc.: Alternative Asset Powerhouse
Blackstone Inc. dominates alternative asset management with a diversified portfolio including real estate, private equity, hedge funds, and credit. Its revenue streams hinge on opportunistic and income-oriented real estate investments alongside large-scale corporate private equity deals. In 2026, Blackstone focuses on expanding its global footprint, emphasizing Asia and Latin America, while leveraging multi-asset strategies for robust capital deployment.
T. Rowe Price Group, Inc.: Traditional Investment Specialist
T. Rowe Price Group, Inc. excels as a publicly owned investment manager specializing in equity and fixed income mutual funds. It generates income through fundamental and quantitative bottom-up analysis across global public markets. The 2026 strategy highlights socially responsible investing with a strong commitment to ESG principles and measured late-stage venture capital investments, targeting sustainable long-term growth.
Strategic Collision: Similarities & Divergences
Blackstone pursues a broad, alternative asset strategy contrasting with T. Rowe Price’s focus on traditional public equity and fixed income funds. The primary battleground lies in capturing institutional and high-net-worth capital through distinct risk-return profiles. Investors face a choice between Blackstone’s global opportunistic approach and T. Rowe Price’s disciplined, ESG-driven public market expertise.
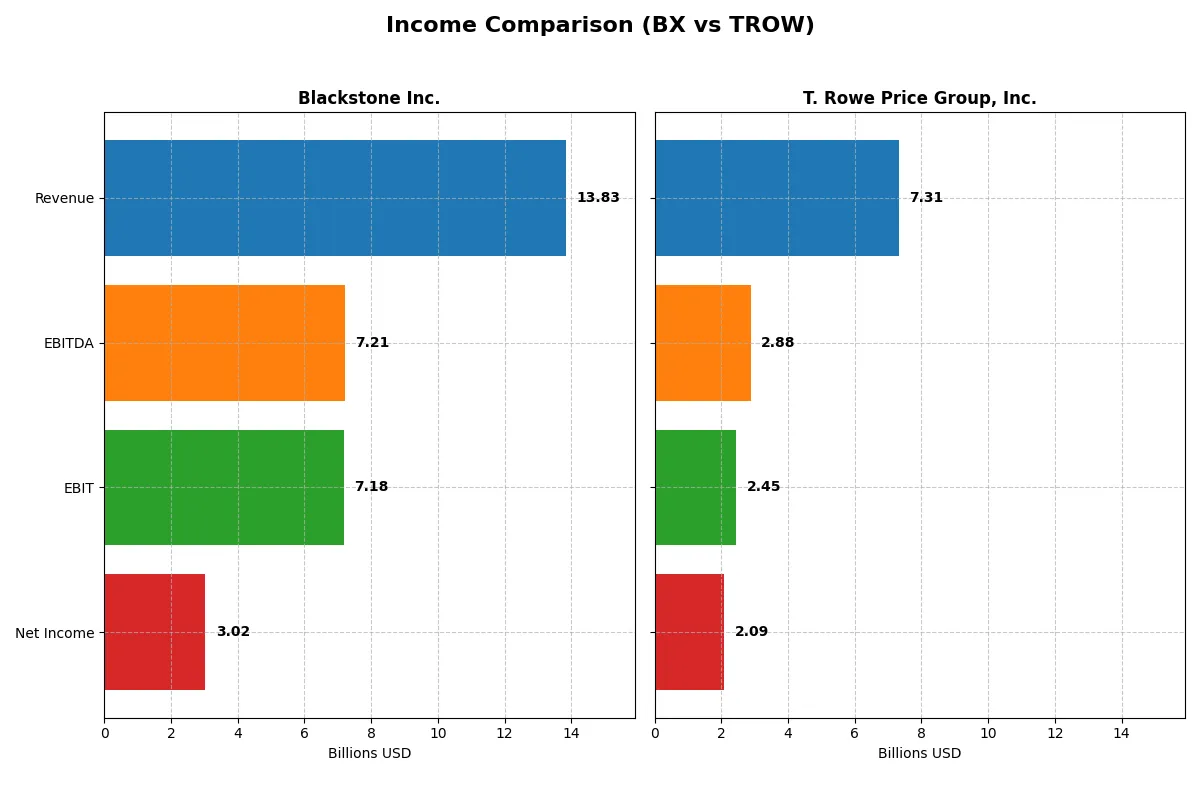
Income Statement Comparison
This table dissects the core profitability and scalability of both corporate engines to reveal who dominates the bottom line:
| Metric | Blackstone Inc. (BX) | T. Rowe Price Group, Inc. (TROW) |
|---|---|---|
| Revenue | 13.8B | 7.3B |
| Cost of Revenue | 1.9B | 2.7B |
| Operating Expenses | 4.7B | 2.4B |
| Gross Profit | 11.9B | 4.6B |
| EBITDA | 7.2B | 2.9B |
| EBIT | 7.2B | 2.4B |
| Interest Expense | 508M | 0 |
| Net Income | 3.0B | 2.1B |
| EPS | 3.88 | 9.26 |
| Fiscal Year | 2025 | 2025 |
Income Statement Analysis: The Bottom-Line Duel
This comparison uncovers each company’s true operational efficiency and profit-generation prowess over recent years.
Blackstone Inc. Analysis
Blackstone’s revenue soared from 7.4B in 2023 to 13.8B in 2025, reflecting strong top-line momentum. Its gross margin remains robust at 86%, while net margin stands at a solid 21.8%. Despite a one-year net margin dip, Blackstone’s EPS rose 7.2%, signaling improved bottom-line efficiency in 2025.
T. Rowe Price Group, Inc. Analysis
T. Rowe Price’s revenue climbed modestly from 6.5B in 2023 to 7.3B in 2025, showing steady but slower growth. Gross margin sits at a healthy 62.7%, with net margin at 28.5%, outperforming Blackstone’s net margin. However, EBIT and net margin contracted slightly over the last year, indicating some pressure on operating leverage.
Margin Power vs. Revenue Scale
Blackstone dominates in revenue scale and gross profitability, driven by excellent cost control and operational leverage. T. Rowe Price offers a superior net margin but grows slower and faces shrinking EBIT. Blackstone’s strong revenue momentum and margin expansion make it the fundamental winner, appealing more to investors seeking growth with efficiency.
Financial Ratios Comparison
These vital ratios act as a diagnostic tool to expose underlying fiscal health, valuation premiums, and capital efficiency for the companies compared below:
| Ratios | Blackstone Inc. (BX) | T. Rowe Price Group, Inc. (TROW) |
|---|---|---|
| ROE | 34.8% | 19.2% |
| ROIC | 17.2% | 22.2% |
| P/E | 39.9 | 11.0 |
| P/B | 13.9 | 2.1 |
| Current Ratio | 0.85 | 0 |
| Quick Ratio | 0.85 | 0 |
| D/E | 1.44 | 0 |
| Debt-to-Assets | 26.1% | 0 |
| Interest Coverage | 14.1 | 0 |
| Asset Turnover | 0.29 | 0.51 |
| Fixed Asset Turnover | 18.3 | 6.0 |
| Payout Ratio | 121.3% | 54.5% |
| Dividend Yield | 3.04% | 4.96% |
| Fiscal Year | 2025 | 2025 |
Efficiency & Valuation Duel: The Vital Signs
Financial ratios act as a company’s DNA, exposing hidden risks and operational strengths that shape investor decisions.
Blackstone Inc.
Blackstone exhibits strong profitability with a 34.8% ROE and a solid 21.8% net margin. Its valuation is stretched, reflected by a high 39.9 P/E and 13.9 P/B ratio. The company returns value through a 3.04% dividend yield, balancing shareholder payouts with reinvestment in core operations, despite a weak current ratio of 0.85.
T. Rowe Price Group, Inc.
T. Rowe Price shows efficient operations with a 19.2% ROE and a superior 28.5% net margin. Its valuation is attractive at a 10.98 P/E and moderate 2.11 P/B. The firm rewards shareholders with a 4.96% dividend yield and maintains a conservative capital structure, supported by favorable debt metrics and strong interest coverage.
Premium Valuation vs. Operational Safety
Blackstone’s higher profitability contrasts with its stretched valuation and weaker liquidity. T. Rowe Price offers a more balanced risk-reward profile with solid margins and attractive valuation. Investors prioritizing operational safety and income may find T. Rowe Price’s profile more suitable.
Which one offers the Superior Shareholder Reward?
I observe Blackstone (BX) pays a 3.0% dividend yield with a payout ratio above 120%, signaling aggressive distributions, possibly unsustainable long-term. Its buyback program is significant but less transparent in free cash flow coverage. T. Rowe Price (TROW) offers a 4.9% yield with a conservative 54% payout ratio and strong free cash flow backing. Both companies execute buybacks, but TROW’s capital allocation balance between dividends and buybacks appears more sustainable. In 2026, I favor TROW for a superior total return profile, combining steady income and prudent reinvestment.
Comparative Score Analysis: The Strategic Profile
The radar chart reveals the fundamental DNA and trade-offs of both firms, spotlighting strengths and vulnerabilities in key financial metrics:
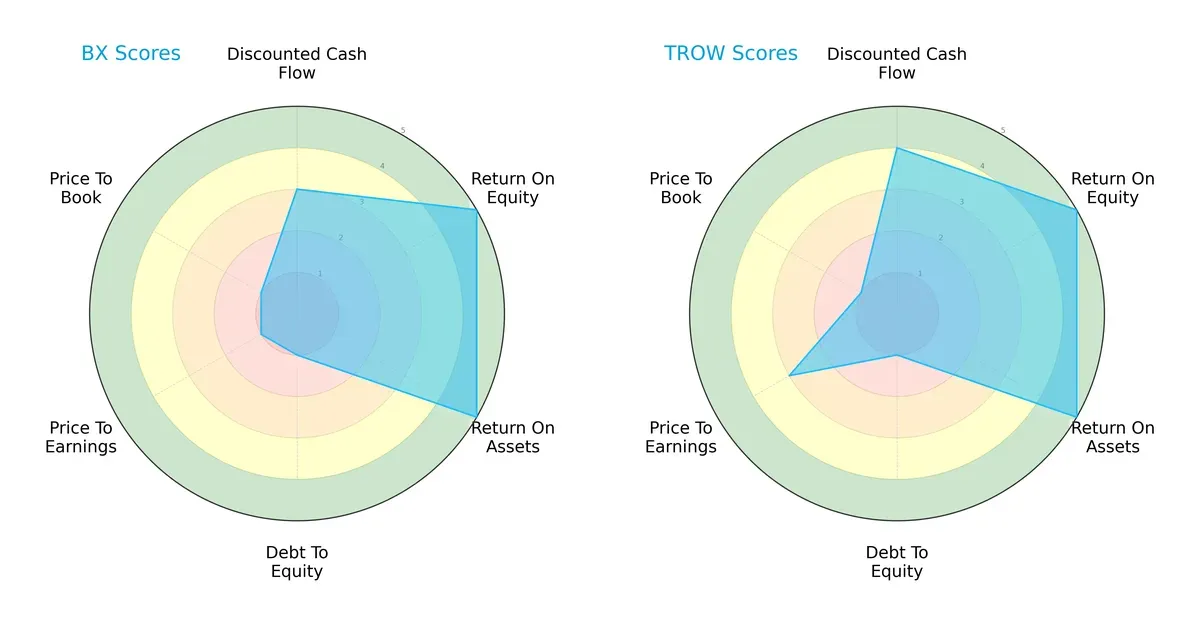
Blackstone Inc. and T. Rowe Price Group share strong ROE and ROA scores, indicating efficient profit generation and asset use. However, Blackstone leans heavily on its operational efficiency but suffers from very unfavorable debt and valuation scores. T. Rowe Price presents a more balanced profile, with a superior discounted cash flow score and better P/E valuation, suggesting a more prudent capital market position.
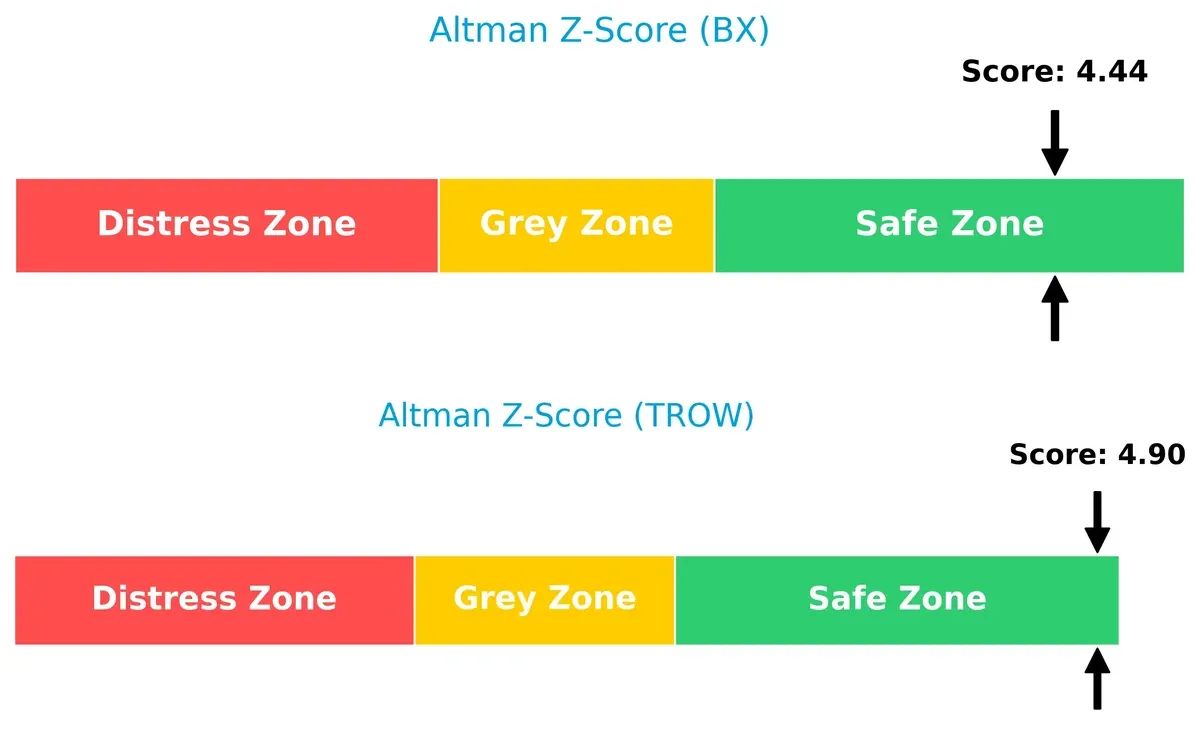
Bankruptcy Risk: Solvency Showdown
The Altman Z-Score gap highlights both firms in the safe zone, with T. Rowe Price slightly more insulated from bankruptcy risk in this cycle:
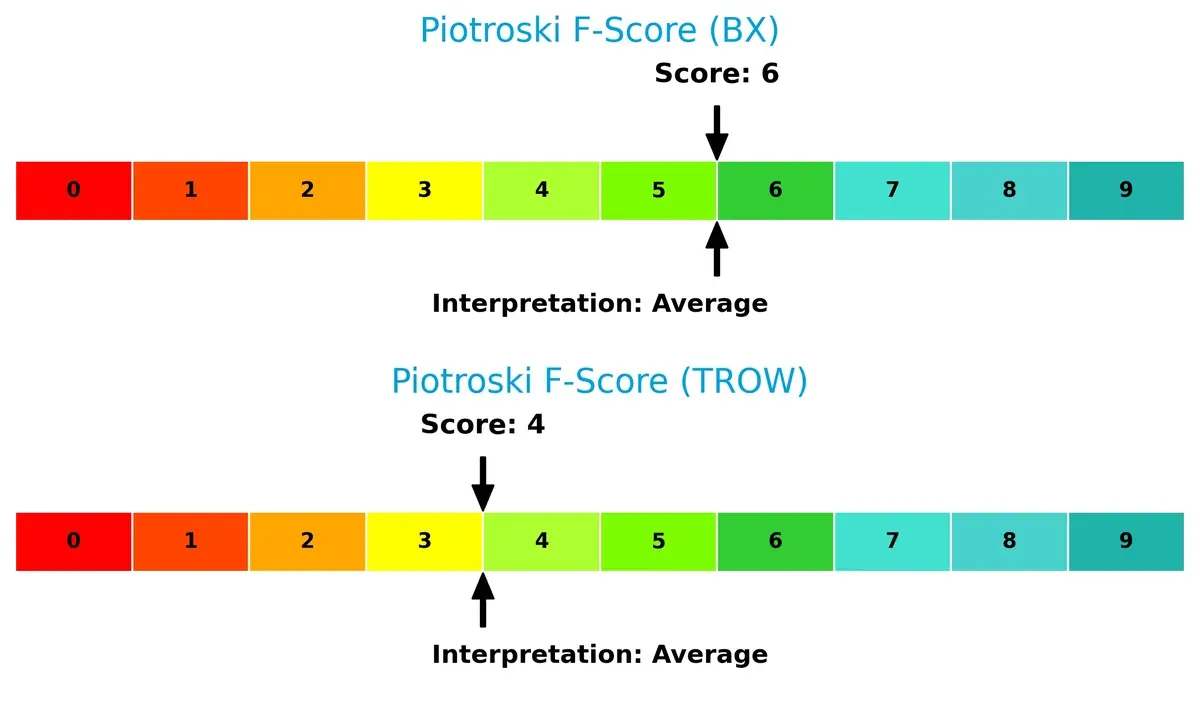
Financial Health: Quality of Operations
Blackstone’s Piotroski score of 6 outperforms T. Rowe Price’s 4, signaling stronger internal financial health and fewer red flags in operational metrics:
How are the two companies positioned?
This section dissects BX and TROW’s operational DNA by comparing their revenue distribution and internal dynamics. The goal is to confront their economic moats and identify the most resilient competitive advantage in today’s market.
Revenue Segmentation: The Strategic Mix
This comparison breaks down how Blackstone Inc. and T. Rowe Price Group diversify revenue streams, revealing their primary sector bets and strategic focus areas:
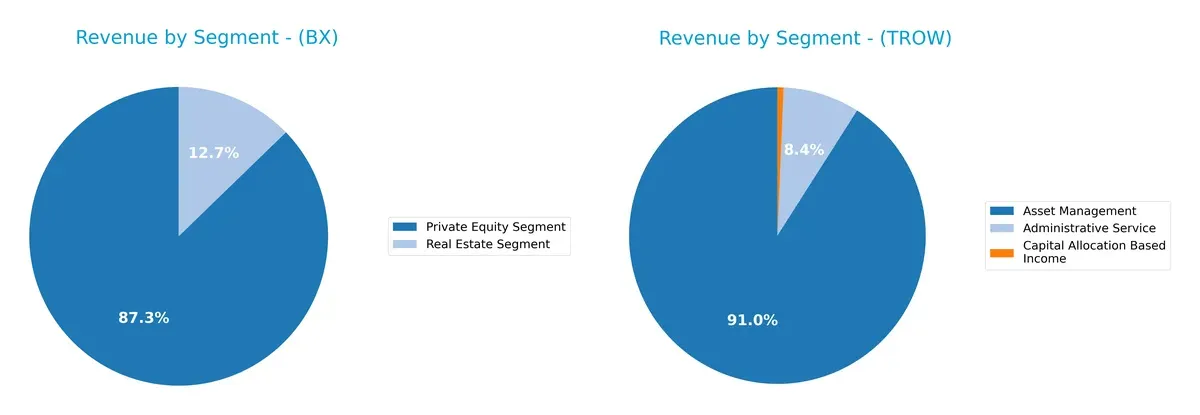
Blackstone relies heavily on its Private Equity segment with $1.39B in 2024, alongside a smaller Real Estate revenue of $203M. This concentration anchors its ecosystem in alternative assets. T. Rowe Price pivots on a dominant Asset Management segment at $6.4B, supplemented by $588M from Administrative Services. T. Rowe Price’s more diversified mix reduces concentration risk, while Blackstone’s focus signals infrastructure dominance but higher exposure to private markets volatility.
Strengths and Weaknesses Comparison
This table compares the Strengths and Weaknesses of Blackstone Inc. and T. Rowe Price Group, Inc.:
Blackstone Inc. Strengths
- Diverse revenue from Private Equity, Real Estate, Hedge Fund, Credit segments
- High ROE at 34.84% and favorable ROIC at 17.2%
- Strong interest coverage at 14.12 and dividend yield of 3.04%
- Low debt-to-assets ratio at 26.09% supports financial stability
T. Rowe Price Group Strengths
- High net margin of 28.53% and ROIC of 22.19% indicate solid profitability
- Favorable P/E of 10.98 and low debt enhance valuation appeal
- Infinite interest coverage and zero debt improve credit profile
- Diversified revenues including Asset Management and Administrative Services
- Higher dividend yield at 4.96% rewards shareholders
Blackstone Inc. Weaknesses
- Unfavorable current ratio at 0.85 signals liquidity risk
- Elevated P/E of 39.87 and P/B of 13.89 suggest expensive valuation
- Debt-to-equity ratio of 1.44 indicates higher leverage
- Asset turnover at 0.29 is weak, limiting operational efficiency
T. Rowe Price Group Weaknesses
- Current and quick ratios reported as zero, implying liquidity data issues or concerns
- Moderate ROE at 19.22% lower than Blackstone
- Asset turnover neutral at 0.51 may limit growth potential
- P/B ratio neutral at 2.11 suggests limited asset value premium
Blackstone’s strengths lie in diversified business lines and strong profitability metrics but face liquidity and valuation challenges. T. Rowe Price shows robust margins, favorable leverage, and shareholder returns but has some uncertainty in liquidity data and moderate asset efficiency. These contrasts reflect differing capital structures and operational focuses influencing each company’s strategic positioning.
The Moat Duel: Analyzing Competitive Defensibility
A structural moat is the only reliable shield protecting long-term profits from relentless competitive erosion. Let’s dissect two asset managers’ defenses:
Blackstone Inc.: Diversified Asset Dominance
Blackstone leverages a broad portfolio moat rooted in alternative assets and scale, showing high ROIC above WACC at 6.4%. Its margin stability and product diversity support resilience. Expansion into green energy and emerging markets could deepen this advantage in 2026.
T. Rowe Price Group, Inc.: Focused Investment Expertise
T. Rowe Price builds its moat on strong brand reputation and disciplined capital allocation, reflected in an even wider ROIC premium over WACC at 11.1%. Despite a smaller scale, it commands superior net margins and steady value creation. Growth in ESG offerings and global equity could enhance its moat.
Verdict: Diversification vs. Specialization in Asset Management
Both firms create value with declining ROIC trends, but T. Rowe Price holds a deeper moat through higher ROIC excess and margin strength. I see T. Rowe Price better positioned to defend market share amid shifting investor preferences.
Which stock offers better returns?
The past year shows Blackstone Inc. gaining 3.78%, indicating a bullish trend with price deceleration, while T. Rowe Price Group, Inc. declines by 17.66%, reflecting a bearish trend with accelerating losses.
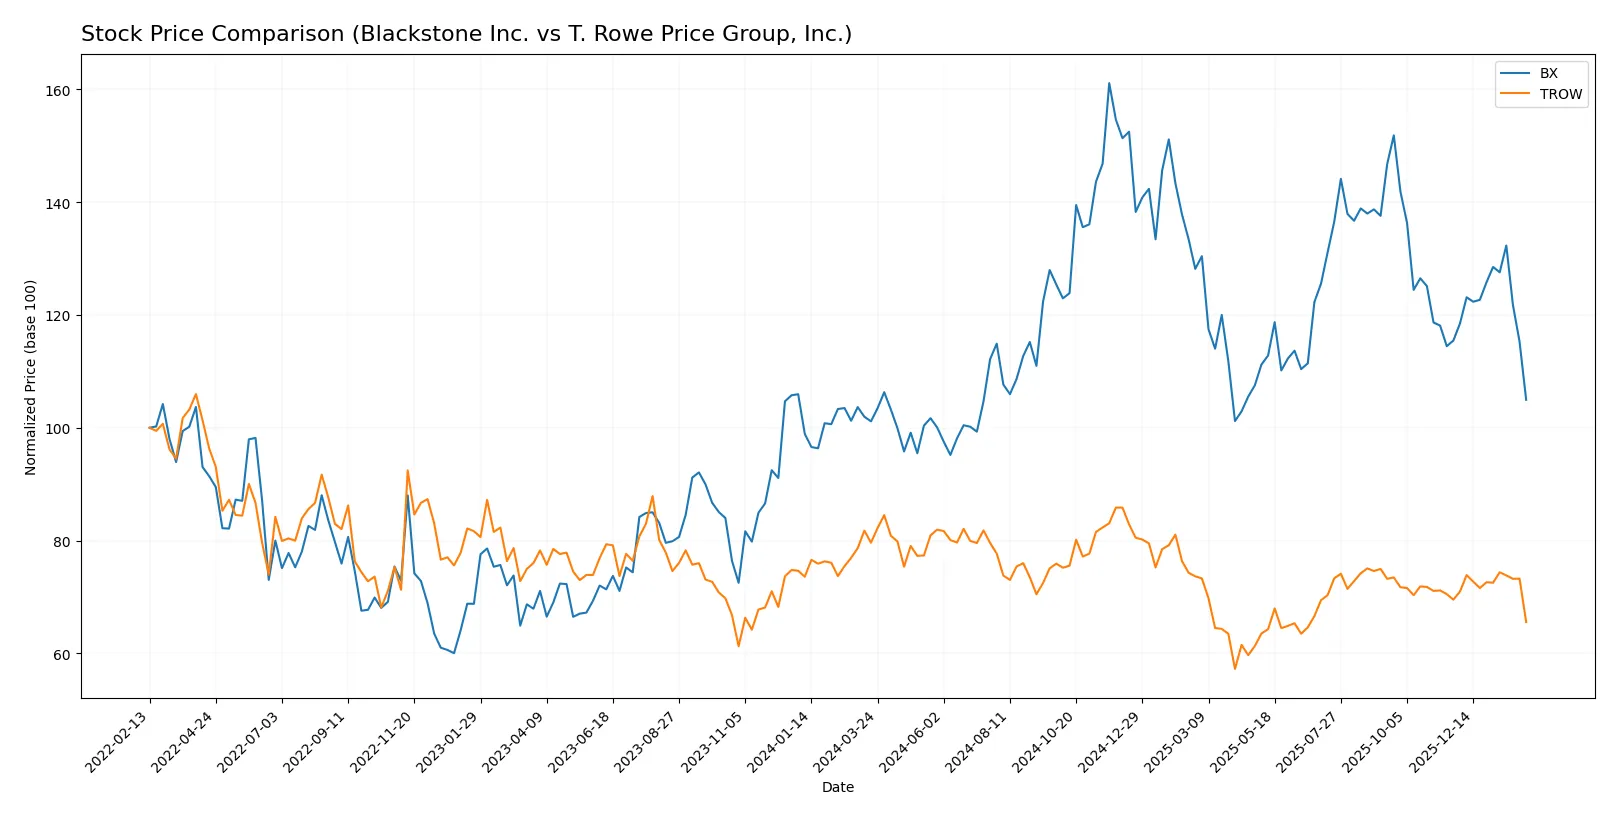
Trend Comparison
Blackstone Inc. posts a 3.78% price increase over the past 12 months, marking a bullish trend with decelerating momentum and a high volatility of 20.27%. Its price ranged from 117.62 to 199.05.
T. Rowe Price Group, Inc. suffers a 17.66% drop over the same period, confirming a bearish trend with accelerating losses and lower volatility at 8.86%. Price fluctuated between 82.6 and 123.84.
Comparing both, Blackstone outperforms T. Rowe Price significantly, delivering positive returns amid decelerating gains while T. Rowe Price endures sharp, accelerating declines.
Target Prices
Analysts present a bullish consensus for Blackstone Inc. and T. Rowe Price Group, Inc.
| Company | Target Low | Target High | Consensus |
|---|---|---|---|
| Blackstone Inc. | 158 | 215 | 178.17 |
| T. Rowe Price Group, Inc. | 94 | 123 | 108.25 |
Blackstone’s target consensus of 178.17 suggests a 37% upside versus its current 129.69 price. T. Rowe Price’s 108.25 consensus implies roughly a 14% gain from 94.58.

Don’t Let Luck Decide Your Entry Point
Optimize your entry points with our advanced ProRealTime indicators. You’ll get efficient buy signals with precise price targets for maximum performance. Start outperforming now!
How do institutions grade them?
The following tables summarize recent institutional grades for Blackstone Inc. and T. Rowe Price Group, Inc.:
Blackstone Inc. Grades
The table below shows recent grade actions by major grading firms for Blackstone Inc.
| Grading Company | Action | New Grade | Date |
|---|---|---|---|
| Piper Sandler | maintain | Neutral | 2026-02-02 |
| TD Cowen | maintain | Buy | 2026-01-30 |
| JP Morgan | maintain | Neutral | 2026-01-30 |
| Citizens | maintain | Market Outperform | 2026-01-30 |
| Barclays | maintain | Equal Weight | 2026-01-30 |
| TD Cowen | maintain | Buy | 2026-01-14 |
| UBS | maintain | Neutral | 2026-01-13 |
| Barclays | maintain | Equal Weight | 2026-01-09 |
| Barclays | maintain | Equal Weight | 2025-12-12 |
| JP Morgan | maintain | Neutral | 2025-10-24 |
T. Rowe Price Group, Inc. Grades
The table below lists recent grade actions from reputable grading companies for T. Rowe Price Group, Inc.
| Grading Company | Action | New Grade | Date |
|---|---|---|---|
| JP Morgan | maintain | Underweight | 2026-02-05 |
| Evercore ISI Group | maintain | In Line | 2026-02-05 |
| Keefe, Bruyette & Woods | maintain | Market Perform | 2026-02-05 |
| TD Cowen | maintain | Hold | 2026-02-05 |
| Morgan Stanley | maintain | Equal Weight | 2026-02-03 |
| JP Morgan | maintain | Underweight | 2026-01-20 |
| Barclays | maintain | Underweight | 2026-01-15 |
| TD Cowen | maintain | Hold | 2026-01-14 |
| Morgan Stanley | maintain | Equal Weight | 2025-12-17 |
| Keefe, Bruyette & Woods | maintain | Market Perform | 2025-12-17 |
Which company has the best grades?
Blackstone Inc. received predominantly neutral to buy-related grades, including a market outperform rating. T. Rowe Price Group consistently holds underweight to hold ratings. Blackstone’s stronger grades may suggest comparatively better institutional sentiment, potentially influencing investor confidence.
Risks specific to each company
The following categories identify the critical pressure points and systemic threats facing both firms in the 2026 market environment:
1. Market & Competition
Blackstone Inc.
- Competes in alternative asset management with a broad global reach, facing pressure from rising fees and new entrants.
T. Rowe Price Group, Inc.
- Focuses on traditional equity and fixed income management, challenged by passive investing and fee compression.
2. Capital Structure & Debt
Blackstone Inc.
- Elevated debt-to-equity ratio at 1.44 signals higher financial leverage risk.
T. Rowe Price Group, Inc.
- Virtually no debt, reflecting a conservative capital structure and lower financial risk.
3. Stock Volatility
Blackstone Inc.
- Beta of 1.76 indicates higher stock volatility, increasing risk in turbulent markets.
T. Rowe Price Group, Inc.
- Beta of 1.54 suggests moderate volatility, somewhat less sensitive to market swings.
4. Regulatory & Legal
Blackstone Inc.
- Operates in multiple jurisdictions with complex regulatory frameworks, increasing compliance risk.
T. Rowe Price Group, Inc.
- Faces regulatory scrutiny mainly on fiduciary duties and ESG disclosures, but less complex than Blackstone.
5. Supply Chain & Operations
Blackstone Inc.
- Relies on diverse real estate and private equity assets, vulnerable to operational disruptions and valuation shifts.
T. Rowe Price Group, Inc.
- Operational risk centers on fund management and technology platforms, with less exposure to physical asset disruptions.
6. ESG & Climate Transition
Blackstone Inc.
- Exposure to real estate and energy sectors poses transition risks amid tightening climate regulations.
T. Rowe Price Group, Inc.
- Emphasizes ESG investing practices, potentially benefiting from growing investor demand for sustainability.
7. Geopolitical Exposure
Blackstone Inc.
- Significant global footprint including Asia and Latin America increases geopolitical risk.
T. Rowe Price Group, Inc.
- More concentrated in developed markets, limiting geopolitical uncertainties but still exposed to global economic shifts.
Which company shows a better risk-adjusted profile?
Blackstone’s greatest risk lies in its high leverage and market volatility, amplifying financial vulnerability during downturns. T. Rowe Price faces pressure from fee compression and evolving investor preferences but benefits from a cleaner balance sheet and lower volatility. T. Rowe Price’s conservative debt posture and favorable valuation metrics suggest a better risk-adjusted profile in today’s environment. The stark contrast in debt-to-equity ratios—1.44 for Blackstone versus near zero for T. Rowe Price—justifies caution towards Blackstone’s capital structure risks.
Final Verdict: Which stock to choose?
Blackstone Inc. impresses with its superpower as a cash-generating powerhouse, delivering robust returns on equity and capital despite a slightly stretched balance sheet. Its key point of vigilance lies in its declining profitability trend and leverage levels. It fits well in aggressive growth portfolios seeking high returns with moderate risk tolerance.
T. Rowe Price Group stands out for its strategic moat rooted in efficient capital allocation and recurring fee-based revenue, offering a safer financial profile than Blackstone. Its valuation metrics and stable income streams make it suitable for GARP investors prioritizing balance between growth and value.
If you prioritize high return potential and can tolerate volatility, Blackstone outshines with its strong value creation despite some operational headwinds. However, if you seek better stability and a more conservative growth trajectory, T. Rowe Price offers a compelling scenario with its durable moat and healthier leverage profile.
Disclaimer: Investment carries a risk of loss of initial capital. The past performance is not a reliable indicator of future results. Be sure to understand risks before making an investment decision.
Go Further
I encourage you to read the complete analyses of Blackstone Inc. and T. Rowe Price Group, Inc. to enhance your investment decisions: