Home > Comparison > Financial Services > BX vs STT
The strategic rivalry between Blackstone Inc. and State Street Corporation shapes the asset management landscape today. Blackstone operates as a diversified alternative asset manager with a focus on private equity and real estate. State Street excels as a global provider of investment servicing and data-driven financial products. This analysis pits Blackstone’s growth-oriented, capital-intensive model against State Street’s scale and service efficiency to identify the superior risk-adjusted investment opportunity for diversified portfolios.

Table of contents
Companies Overview
Blackstone Inc. and State Street Corporation shape the global asset management landscape with distinct approaches and vast scale.
Blackstone Inc.: Alternative Asset Powerhouse
Blackstone dominates alternative asset management, focusing on real estate, private equity, and credit strategies. Its core revenue derives from managing opportunistic and income-oriented real estate, buyouts, and hedge funds. In 2026, Blackstone emphasizes global expansion and diversified multi-asset strategies across North America, Europe, and Asia, leveraging its strong foothold in early-stage and distressed asset investments.
State Street Corporation: Institutional Financial Services Leader
State Street excels as a custody and investment servicing provider, supporting institutional investors worldwide. It generates revenue through custody, portfolio management, risk analytics, and exchange-traded fund services under the SPDR brand. The 2026 strategy centers on enhancing ESG investing, compliance analytics, and expanding global fiduciary solutions, reinforcing its role in servicing mutual funds, pension plans, and endowments.
Strategic Collision: Similarities & Divergences
Blackstone pursues a high-touch, active investment model in alternatives, while State Street offers a broad institutional servicing platform focused on operational efficiency and data. Their primary battleground is asset management, with Blackstone targeting alpha generation through private assets, and State Street scaling through custodial and passive investment solutions. Their investment profiles differ sharply: Blackstone embodies growth and complexity; State Street, stability and scale.
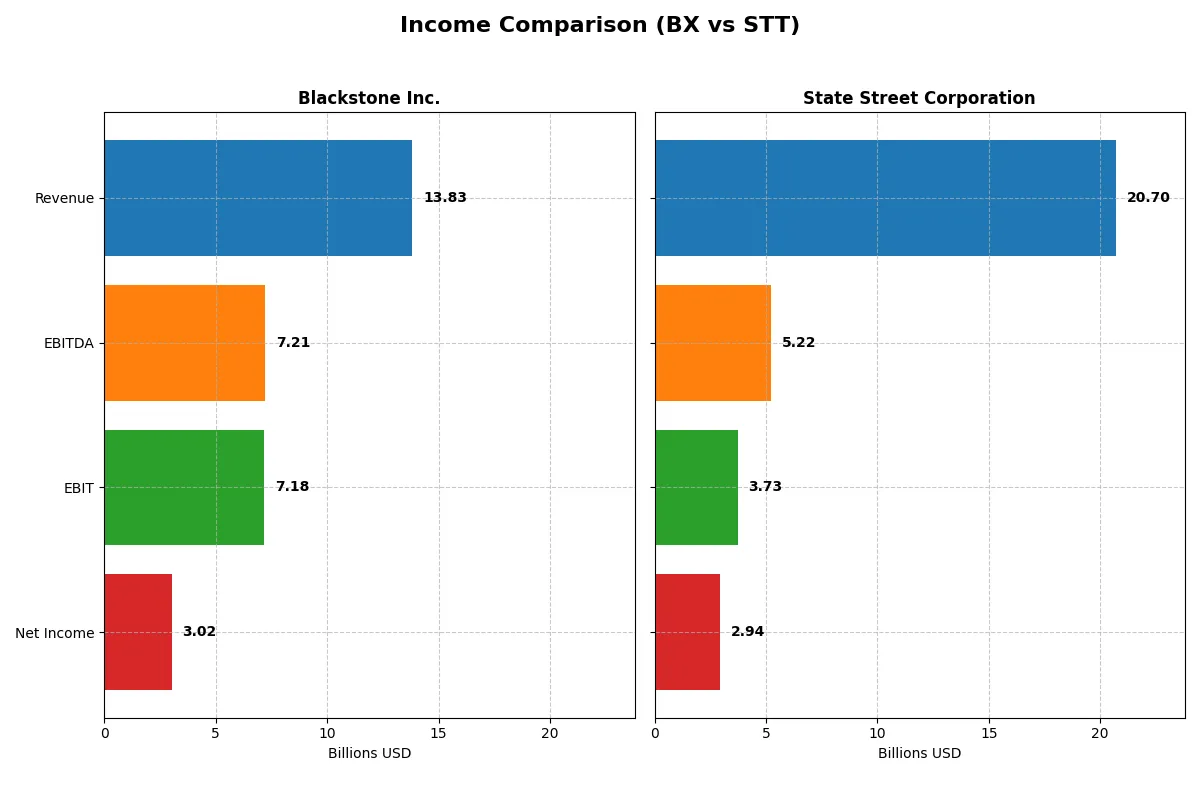
Income Statement Comparison
The following data dissects the core profitability and scalability of both corporate engines to reveal who dominates the bottom line:
| Metric | Blackstone Inc. (BX) | State Street Corporation (STT) |
|---|---|---|
| Revenue | 13.8B | 20.7B |
| Cost of Revenue | 1.9B | 6.8B |
| Operating Expenses | 4.7B | 10.2B |
| Gross Profit | 11.9B | 13.9B |
| EBITDA | 7.2B | 5.2B |
| EBIT | 7.2B | 3.7B |
| Interest Expense | 508M | 8.7B |
| Net Income | 3.0B | 2.9B |
| EPS | 3.88 | 9.56 |
| Fiscal Year | 2025 | 2025 |
Income Statement Analysis: The Bottom-Line Duel
This income statement comparison reveals which company drives growth and profitability with superior operational efficiency and financial discipline.
Blackstone Inc. Analysis
Blackstone’s revenue climbed from 7.4B in 2023 to 13.8B in 2025, showing strong momentum. Gross margin remains exceptionally high at 86%, reflecting efficient cost control. Net income rose to 3B in 2025, but margin compression signals some pressure on bottom-line growth despite solid operating profits.
State Street Corporation Analysis
State Street grew revenue steadily from 12B in 2021 to 20.7B in 2025, though it declined slightly last year. Gross margin stands at 67%, healthy but less robust than Blackstone’s. Net income reached 2.9B in 2025, with improving net margin and earnings per share signaling growing profitability despite elevated interest expenses.
Verdict: Margin Excellence vs. Revenue Expansion
Blackstone leads with superior margins and operational efficiency, sustaining high profitability despite lower revenue growth over five years. State Street boasts stronger top-line expansion and improving earnings momentum but faces pressure from high interest costs. Investors seeking margin power will favor Blackstone; those prioritizing scale and growth may lean toward State Street.
Financial Ratios Comparison
These vital ratios act as a diagnostic tool to expose the underlying fiscal health, valuation premiums, and capital efficiency of the companies compared below:
| Ratios | Blackstone Inc. (BX) | State Street Corporation (STT) |
|---|---|---|
| ROE | 33.8% (2024) | 10.6% (2024) |
| ROIC | 12.5% (2024) | 2.9% (2024) |
| P/E | 47.6 (2024) | 10.9 (2024) |
| P/B | 16.1 (2024) | 1.15 (2024) |
| Current Ratio | 0 (2025) | 3.59 (2025) |
| Quick Ratio | 0 (2025) | 3.59 (2025) |
| D/E | 1.50 (2024) | 1.45 (2024) |
| Debt-to-Assets | 28.3% (2024) | 10.4% (2024) |
| Interest Coverage | 14.6 (2024) | 0.37 (2024) |
| Asset Turnover | 0.26 (2024) | 0.06 (2024) |
| Fixed Asset Turnover | 8.46 (2024) | 6.22 (2024) |
| Payout ratio | 159% (2024) | 38% (2024) |
| Dividend yield | 3.35% (2024) | 3.53% (2024) |
| Fiscal Year | 2025 | 2025 |
Efficiency & Valuation Duel: The Vital Signs
Ratios act as a company’s DNA, revealing hidden risks and operational excellence behind headline numbers.
Blackstone Inc.
Blackstone shows a strong net margin of 21.8% but an unfavorable ROE of 0%, signaling profitability challenges at the equity level. The stock trades expensive with a P/E of 39.9, suggesting stretched valuation. Shareholders benefit from a solid 3.0% dividend yield, highlighting a return focus amid limited reinvestment in R&D or growth.
State Street Corporation
State Street posts a 14.2% net margin with a neutral ROE of 10.6%, reflecting moderate profitability. The valuation is attractive at a P/E of 12.3, indicating a value-oriented stock. A 2.4% dividend yield underscores consistent shareholder returns, balanced by conservative reinvestment amid a slightly unfavorable WACC of 16.5%.
Premium Valuation vs. Operational Safety
Blackstone’s high valuation contrasts with its shareholder-friendly dividend but weak equity returns. State Street offers a more balanced profile with moderate profitability and a fair valuation. Investors seeking growth at a premium may favor Blackstone; those prioritizing operational safety and value may lean toward State Street.
Which one offers the Superior Shareholder Reward?
I see Blackstone Inc. (BX) delivers a higher dividend yield of ~3.3% in 2025, but its payout ratio exceeds 100%, signaling potential sustainability concerns. BX also pursues significant buybacks, enhancing total returns. State Street Corporation (STT) yields ~2.4% with a conservative payout ratio near 30%, preserving cash for growth. STT’s buyback activity is limited, reflecting a cautious capital allocation. Historically, BX’s aggressive distributions have rewarded shareholders more but carry higher risk. I conclude BX offers the superior total return profile in 2026, assuming its dividend and buybacks remain supported by strong cash flow.
Comparative Score Analysis: The Strategic Profile
The radar chart reveals the core DNA and strategic trade-offs of Blackstone Inc. and State Street Corporation, highlighting their financial strengths and valuation contrasts:
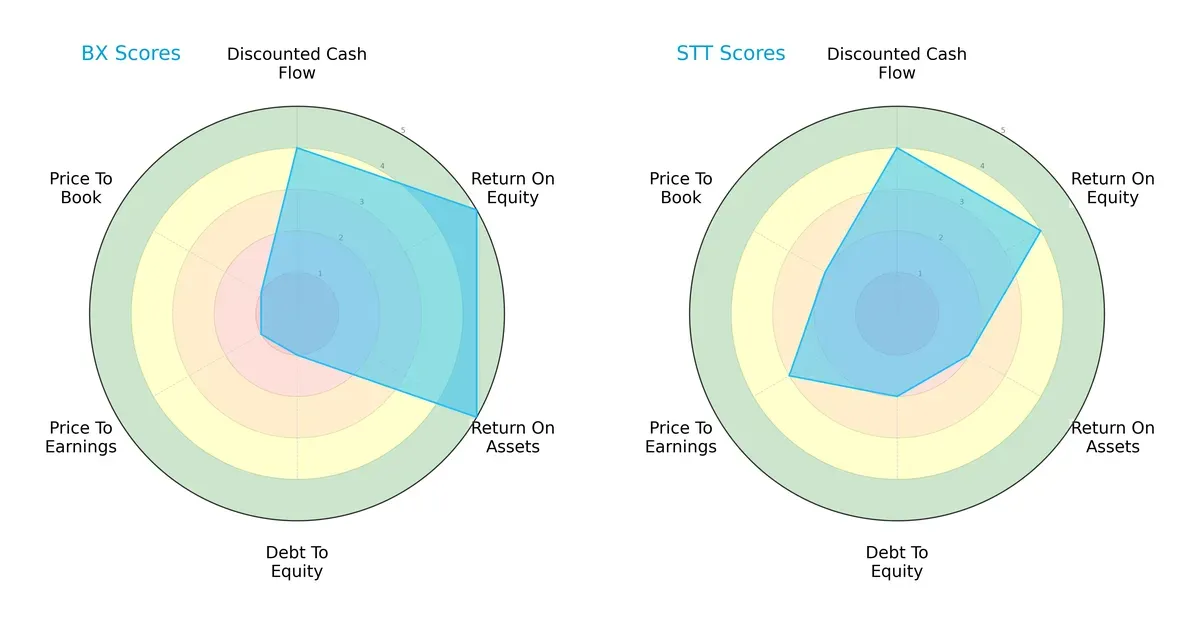
Blackstone excels in profitability metrics, posting higher ROE (5 vs. 4) and ROA (5 vs. 2) scores, signaling superior asset and equity efficiency. State Street shows a more balanced debt profile (debt-to-equity score 2 vs. 1), reducing financial risk. Blackstone’s valuation scores (P/E and P/B at 1) indicate overvaluation risks, unlike State Street’s moderate valuations, granting STT a more stable market price foundation.
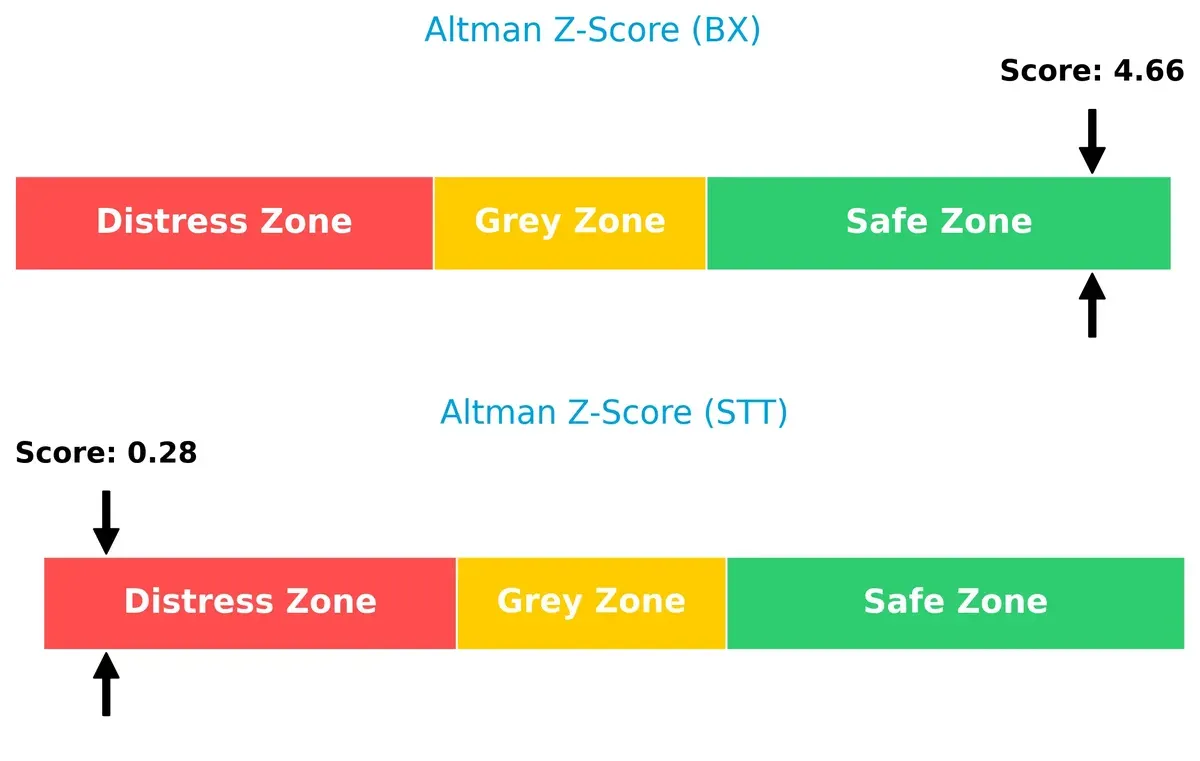
Bankruptcy Risk: Solvency Showdown
Blackstone’s Altman Z-Score of 4.66 places it comfortably in the safe zone, signaling robust long-term solvency. In stark contrast, State Street scores 0.28, deep in the distress zone, raising significant bankruptcy concerns in this market cycle:
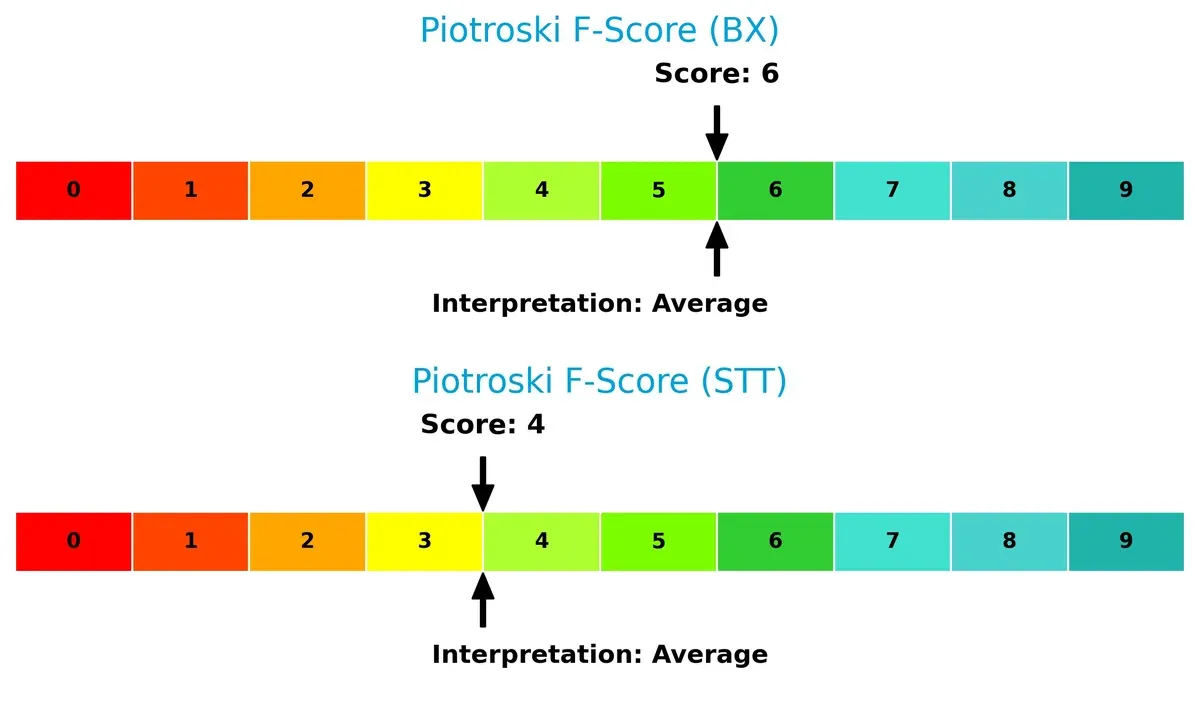
Financial Health: Quality of Operations
Both firms score in the “average” range on the Piotroski F-Score, with Blackstone at 6 and State Street at 4. Blackstone’s higher score suggests stronger internal financial metrics and operational quality, while State Street’s lower score flags potential weaknesses in profitability and efficiency measures:
How are the two companies positioned?
This section dissects BX and STT’s operational DNA by comparing their revenue distribution and internal strengths and weaknesses. The goal is to confront their economic moats to reveal which model offers the most resilient and sustainable advantage today.
Revenue Segmentation: The Strategic Mix
This visual comparison dissects how Blackstone Inc. and State Street Corporation diversify their income streams and where their primary sector bets lie:
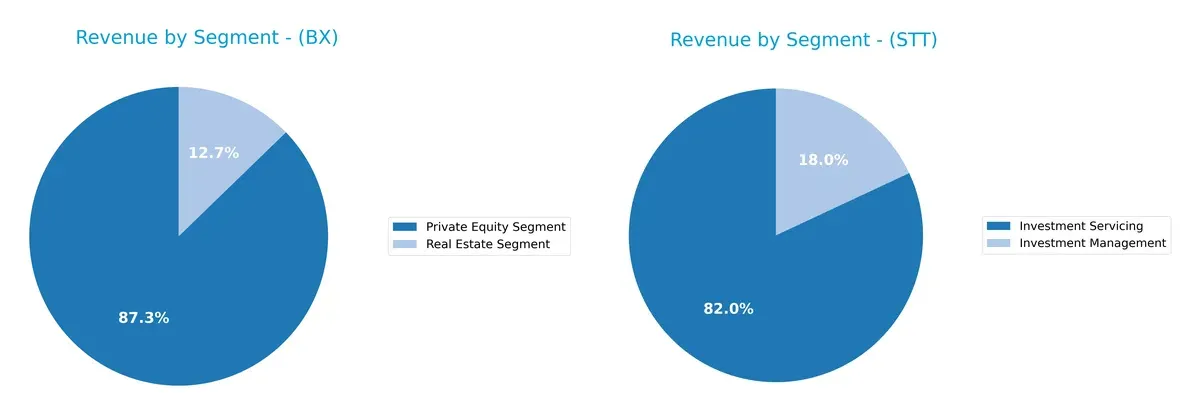
Blackstone pivots heavily on Private Equity with $1.39B and Real Estate at $203M in 2024, showing moderate diversification. State Street relies predominantly on Investment Servicing, which dwarfs Investment Management at $10.65B versus $2.34B. Blackstone’s focus reveals concentration risk but benefits from ecosystem lock-in in private markets. State Street’s dominance in servicing anchors its infrastructure moat, though it faces exposure to market servicing volume cycles.
Strengths and Weaknesses Comparison
This table compares the strengths and weaknesses of Blackstone Inc. and State Street Corporation:
Blackstone Inc. Strengths
- High net margin at 21.83%
- Favorable debt-to-assets ratio at 0%
- Strong interest coverage at 14.12x
- Dividend yield of 3.04%
- Diverse revenue from Private Equity, Real Estate, and Hedge Funds
State Street Corporation Strengths
- Favorable net margin of 14.23%
- Solid price-to-earnings at 12.27
- Quick ratio strong at 3.59
- Favorable fixed asset turnover at 6.52
- Global revenue presence with $7.5B US and $5.5B Non-US sales
- Dividend yield at 2.42%
Blackstone Inc. Weaknesses
- Unfavorable return on equity and ROIC at 0%
- Unavailable WACC data
- Poor liquidity ratios (current and quick ratio at 0)
- Unfavorable asset turnover
- High P/E at 39.87
- Unfavorable price-to-book at 0
State Street Corporation Weaknesses
- Unfavorable ROIC at 2.72% below WACC
- High WACC at 16.53%
- Debt-to-equity ratio unfavorable at 1.07
- Low interest coverage at 0.43x
- Current ratio unfavorable at 3.59
- Asset turnover very low at 0.06
Blackstone demonstrates strong profitability and prudent debt management but struggles with liquidity and efficiency metrics. State Street maintains solid operational liquidity and global diversification but faces challenges in capital efficiency and interest coverage. These contrasting profiles suggest divergent strategic priorities for each firm.
The Moat Duel: Analyzing Competitive Defensibility
A structural moat is the only shield guarding long-term profits from relentless competitive erosion. Let’s dissect how Blackstone and State Street defend their turf:
Blackstone Inc.: Diversified Alternative Asset Moat
Blackstone’s moat stems from its broad alternative asset platform and intangible expertise. This manifests in high gross margins (86%) and strong EBIT margins (52%), signaling operational leverage. New market entries in real estate and private equity may deepen this moat in 2026, though ROIC data is elusive.
State Street Corporation: Institutional Custody and Data Moat
State Street relies on deep institutional relationships and data-driven services, contrasting Blackstone’s asset focus. Despite solid margins (67% gross, 18% EBIT), it faces a steep value destruction indicated by a -14% ROIC vs. WACC gap. Expansion in ESG and analytics offers upside but profitability pressures persist.
Alternative Assets vs. Institutional Services: Who Holds the Stronger Moat?
Blackstone’s wider moat lies in its diversified alternative investments and margin dominance, while State Street struggles with eroding returns despite a loyal institutional base. Blackstone stands better equipped to defend and grow its market share.
Which stock offers better returns?
Over the past 12 months, both stocks show strong upward momentum, with State Street Corporation exhibiting a notably higher price gain and continued acceleration.
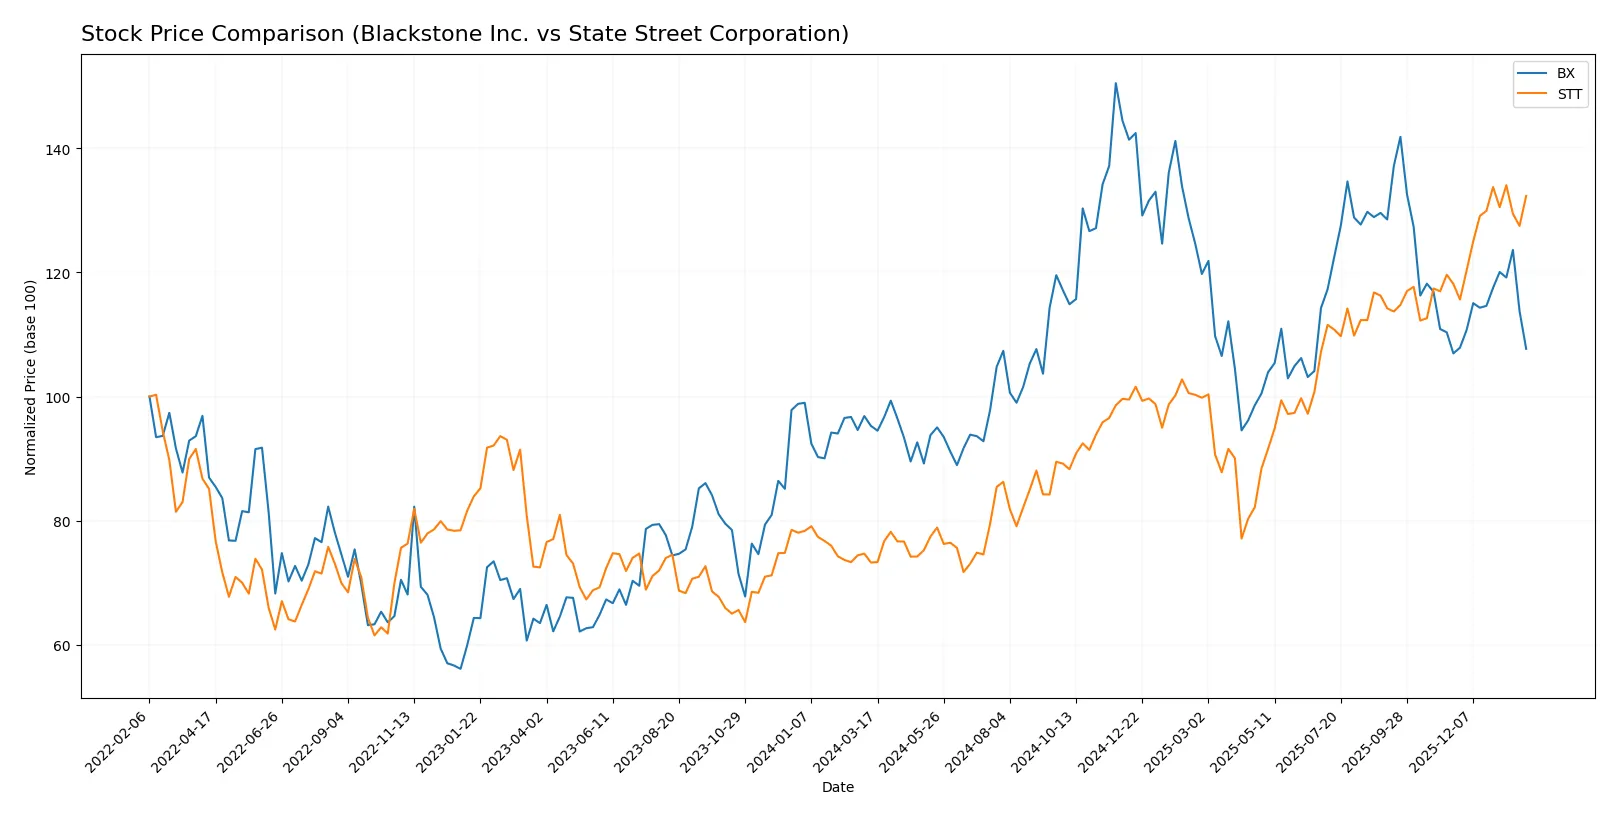
Trend Comparison
Blackstone Inc. posts a 13.04% price increase over the last year, signaling a bullish trend with accelerating momentum and a high volatility of 20.31%. The stock ranged from 117.62 to 199.05.
State Street Corporation outperformed with an 80.67% rise, also bullish with acceleration. It showed lower volatility at 16.89%, hitting a low of 70.91 and a high of 132.57 over the same period.
State Street’s stock trend significantly surpasses Blackstone’s, delivering the highest market performance by a wide margin over the past year.
Target Prices
Analysts show a bullish consensus for Blackstone Inc. and State Street Corporation, signaling upside potential from current levels.
| Company | Target Low | Target High | Consensus |
|---|---|---|---|
| Blackstone Inc. | 164 | 215 | 179.83 |
| State Street Corporation | 128 | 164 | 142.17 |
The target consensus for Blackstone is about 26% above its current price of 142.42, while State Street’s target implies a roughly 9% upside from 130.86. Analysts expect both financial firms to outperform current valuations.

Don’t Let Luck Decide Your Entry Point
Optimize your entry points with our advanced ProRealTime indicators. You’ll get efficient buy signals with precise price targets for maximum performance. Start outperforming now!
How do institutions grade them?
Blackstone Inc. Grades
The following table summarizes recent grades from major financial institutions for Blackstone Inc.:
| Grading Company | Action | New Grade | Date |
|---|---|---|---|
| TD Cowen | Maintain | Buy | 2026-01-30 |
| JP Morgan | Maintain | Neutral | 2026-01-30 |
| Citizens | Maintain | Market Outperform | 2026-01-30 |
| Barclays | Maintain | Equal Weight | 2026-01-30 |
State Street Corporation Grades
Below are recent institutional grades for State Street Corporation from recognized grading firms:
| Grading Company | Action | New Grade | Date |
|---|---|---|---|
| Morgan Stanley | Maintain | Overweight | 2026-01-20 |
| Truist Securities | Downgrade | Hold | 2026-01-07 |
| TD Cowen | Maintain | Buy | 2026-01-07 |
| Barclays | Downgrade | Equal Weight | 2026-01-05 |
Which company has the best grades?
Blackstone Inc. holds generally stable and positive grades, including Buy and Market Outperform. State Street Corporation shows mixed grades with recent downgrades to Hold and Equal Weight. Investors may view Blackstone’s grades as more consistent and favorable.
Risks specific to each company
The following categories identify the critical pressure points and systemic threats facing both firms in the 2026 market environment:
1. Market & Competition
Blackstone Inc.
- Operates in alternative asset management with diverse strategies, facing intense competition in private equity and real estate markets.
State Street Corporation
- Focuses on institutional investment servicing and management, competing with large custodians and asset managers globally.
2. Capital Structure & Debt
Blackstone Inc.
- Strong interest coverage (14.12) and favorable debt-to-assets ratio indicate controlled leverage despite some unfavorable debt-to-equity metrics.
State Street Corporation
- Higher debt-to-equity ratio (1.07) and weak interest coverage (0.43) raise concerns about financial risk and debt servicing capacity.
3. Stock Volatility
Blackstone Inc.
- Beta of 1.75 suggests higher volatility than the market, implying elevated risk in turbulent periods.
State Street Corporation
- Beta of 1.45 indicates moderate volatility, somewhat less volatile than Blackstone but still sensitive to market swings.
4. Regulatory & Legal
Blackstone Inc.
- Exposure to multi-jurisdictional regulations due to global private equity and real estate operations increases compliance complexity.
State Street Corporation
- Faces stringent regulatory oversight in custody and asset servicing, with evolving fiduciary and ESG regulations impacting operations.
5. Supply Chain & Operations
Blackstone Inc.
- Relies on deal flow and partner networks; economic cycles heavily impact asset liquidity and valuations.
State Street Corporation
- Operational risks in technology and data management critical due to extensive institutional client base and service complexity.
6. ESG & Climate Transition
Blackstone Inc.
- Invests in alternative energy and greenfield projects, but transition risks remain significant in energy and real estate sectors.
State Street Corporation
- Offers ESG investing solutions but must manage reputational risks and regulatory pressures on sustainable finance mandates.
7. Geopolitical Exposure
Blackstone Inc.
- Diverse geographic footprint including Asia and Latin America introduces currency and political risk to portfolio valuations.
State Street Corporation
- Global custody and servicing expose it to geopolitical tensions affecting cross-border capital flows and market stability.
Which company shows a better risk-adjusted profile?
Blackstone’s most impactful risk is its high stock volatility and regulatory complexity, which could pressure returns during market downturns. State Street faces significant financial risk due to weak interest coverage and leverage concerns. Despite Blackstone’s volatility, its strong debt servicing and Altman Z-Score in the safe zone suggest a more resilient financial position. State Street’s distress-level Altman Z-Score signals heightened bankruptcy risk, undermining confidence despite moderate stock volatility. The recent weak interest coverage at 0.43 for State Street justifies caution on its debt sustainability. Overall, Blackstone presents a better risk-adjusted profile in 2026.
Final Verdict: Which stock to choose?
Blackstone Inc. (BX) stands out as a cash-generative powerhouse with a robust income statement and a proven ability to deliver shareholder value through disciplined capital allocation. Its main point of vigilance remains a stretched valuation and mixed signals in liquidity, which could amplify risks in volatile markets. BX suits aggressive growth portfolios that tolerate premium pricing for quality.
State Street Corporation (STT) boasts a strategic moat rooted in its stable recurring revenue streams and operational scale, offering a more balanced risk profile than BX. While its profitability metrics trail, STT’s valuation and financial stability appeal to investors seeking steady income with moderate growth. It fits well within GARP (Growth At a Reasonable Price) portfolios focused on value and resilience.
If you prioritize dynamic growth and can accept valuation premiums, Blackstone’s operational efficiency and strong income growth make it the compelling choice. However, if you seek better stability and a more reasonable entry point, State Street offers superior safety and income consistency despite slower growth. Both require close monitoring of profitability trends and capital efficiency as key risks.
Disclaimer: Investment carries a risk of loss of initial capital. The past performance is not a reliable indicator of future results. Be sure to understand risks before making an investment decision.
Go Further
I encourage you to read the complete analyses of Blackstone Inc. and State Street Corporation to enhance your investment decisions: