Home > Comparison > Financial Services > BX vs NTRS
The strategic rivalry between Blackstone Inc. and Northern Trust Corporation shapes the asset management landscape. Blackstone operates as a diversified alternative asset manager with a focus on private equity and real estate, while Northern Trust specializes in wealth management and asset servicing for institutional clients. This contrast highlights a battle between alternative growth strategies and traditional asset servicing excellence. This analysis will identify which company offers a superior risk-adjusted profile for a diversified portfolio in 2026.

Table of contents
Companies Overview
Blackstone Inc. and Northern Trust Corporation are key players in the asset management industry with distinct market footprints.
Blackstone Inc.: Alternative Asset Powerhouse
Blackstone Inc. dominates alternative asset management, generating revenue through real estate, private equity, credit, and hedge funds. Its core business focuses on opportunistic and core+ real estate investments globally. In 2026, Blackstone prioritizes growth in private equity buyouts and credit markets, emphasizing diversified multi-asset strategies and expansion in Asia and Latin America.
Northern Trust Corporation: Wealth & Asset Servicing Leader
Northern Trust Corporation excels in wealth management and asset servicing for institutions and high-net-worth clients. Its primary revenue engine includes custody, investment operations, and private banking services. The 2026 strategy centers on enhancing asset servicing capabilities and expanding wealth management solutions, focusing on tailored financial consulting and risk management for sophisticated clients.
Strategic Collision: Similarities & Divergences
Both firms operate in financial services but diverge in approach: Blackstone embraces a closed, opportunistic investment model while Northern Trust provides open, service-oriented infrastructure. Their primary battleground is client asset growth—Blackstone through direct investments, Northern Trust via fiduciary and servicing excellence. This contrast creates distinct investment profiles: Blackstone offers higher risk-reward tied to asset performance, Northern Trust delivers steady, service-driven revenue streams.
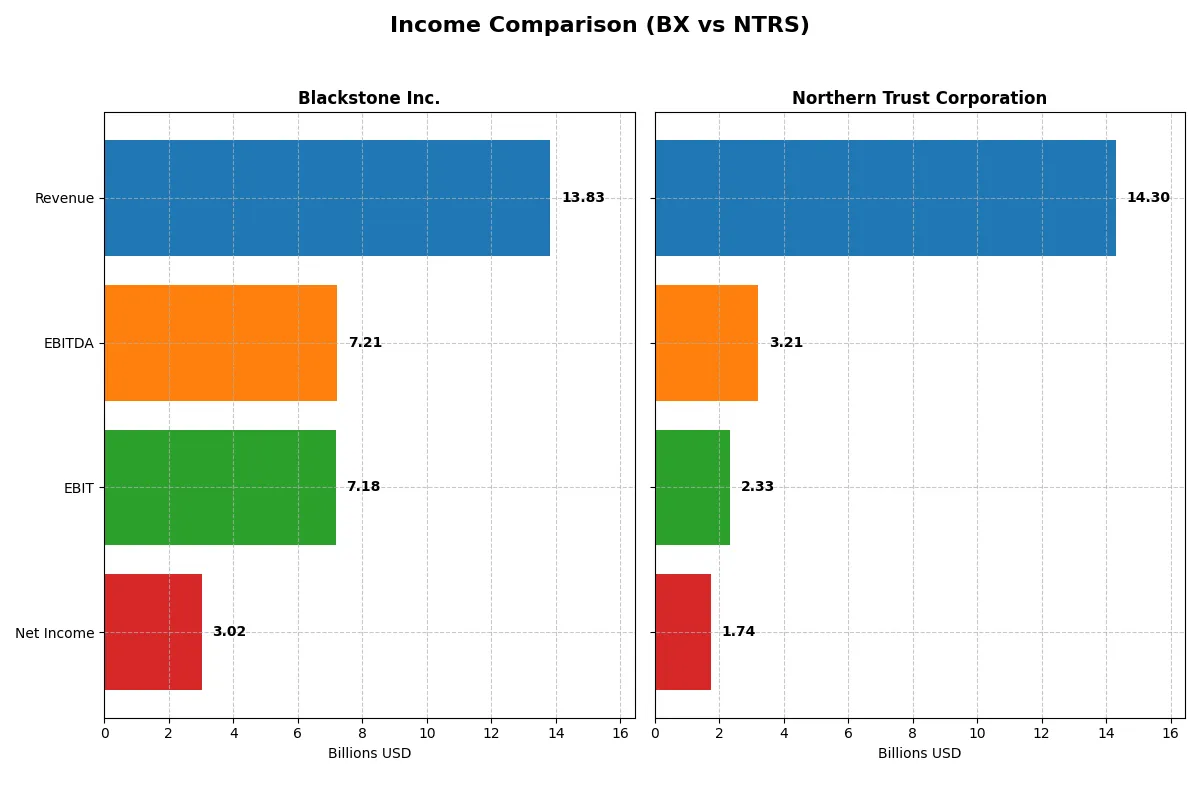
Income Statement Comparison
This data dissects the core profitability and scalability of both corporate engines to reveal who dominates the bottom line:
| Metric | Blackstone Inc. (BX) | Northern Trust Corporation (NTRS) |
|---|---|---|
| Revenue | 13.8B | 14.3B |
| Cost of Revenue | 1.9B | 6.2B |
| Operating Expenses | 4.7B | 5.8B |
| Gross Profit | 11.9B | 8.1B |
| EBITDA | 7.2B | 3.2B |
| EBIT | 7.2B | 2.3B |
| Interest Expense | 508M | 6.2B |
| Net Income | 3.0B | 1.7B |
| EPS | 3.88 | 8.79 |
| Fiscal Year | 2025 | 2025 |
Income Statement Analysis: The Bottom-Line Duel
This income statement comparison reveals which company runs a more efficient and profitable corporate engine based on recent financial performance.
Blackstone Inc. Analysis
Blackstone’s revenue surged from 7.4B in 2023 to 13.8B in 2025, showing strong top-line momentum. Its gross margin remains exceptionally high at 86%, reflecting disciplined cost control. Despite a slight net margin dip in 2025, the firm sustained a robust 21.8% net margin, signaling powerful operating leverage and margin resilience.
Northern Trust Corporation Analysis
Northern Trust’s revenue peaked at 15.9B in 2024 before declining nearly 10% to 14.3B in 2025. The company maintains solid gross margins around 56.5%, yet its net margin lags at 12.15%, pressured by high interest expenses (43.45% of revenue). Recent declines in revenue and earnings highlight operational challenges and margin compression.
Margin Dominance vs. Scale Volatility
Blackstone delivers superior margin efficiency with an 86% gross margin and 21.8% net margin, despite a volatile revenue path. Northern Trust shows stronger revenue growth over five years but suffers from weaker margins and declining recent momentum. Investors seeking margin power and profitability should focus on Blackstone’s consistent operational strength.
Financial Ratios Comparison
These vital ratios act as a diagnostic tool to expose the underlying fiscal health, valuation premiums, and capital efficiency of the companies compared below:
| Ratios | Blackstone Inc. (BX) | Northern Trust Corporation (NTRS) |
|---|---|---|
| ROE | 33.8% (2024) | 15.9% (2024) |
| ROIC | 12.5% (2024) | 6.2% (2024) |
| P/E | 47.6 (2024) | 10.2 (2024) |
| P/B | 16.1 (2024) | 1.61 (2024) |
| Current Ratio | 0.0 (2024, unavailable) | 0.45 (2024) |
| Quick Ratio | 0.0 (2024, unavailable) | 0.45 (2024) |
| D/E | 1.50 (2024) | 1.25 (2024) |
| Debt-to-Assets | 28.3% (2024) | 10.3% (2024) |
| Interest Coverage | 14.6 (2024) | 0.35 (2024) |
| Asset Turnover | 0.26 (2024) | 0.10 (2024) |
| Fixed Asset Turnover | 8.46 (2024) | 32.4 (2024) |
| Payout ratio | 159% (2024) | 32% (2024) |
| Dividend yield | 3.3% (2024) | 3.1% (2024) |
| Fiscal Year | 2024 | 2024 |
Efficiency & Valuation Duel: The Vital Signs
Ratios act as a company’s DNA, revealing hidden risks and operational excellence that raw numbers alone cannot show.
Blackstone Inc.
Blackstone posts a strong net margin of 21.8%, signaling operational efficiency, but its ROE and ROIC are unavailable, raising questions on capital returns. With a high P/E of 39.9, the stock appears stretched. A 3.04% dividend yield supports shareholder returns, suggesting a balanced approach between income and growth.
Northern Trust Corporation
Northern Trust shows a moderate net margin of 12.2% and a neutral ROE of 13.4%, indicating stable but unspectacular profitability. Its P/E of 14.75 reflects a reasonable valuation. The 2.27% dividend yield and reinvestment in fixed assets, with a strong fixed asset turnover, demonstrate a focus on steady shareholder value.
Valuation Stretch vs. Operational Stability
Blackstone’s premium valuation contrasts with Northern Trust’s more conservative multiples. Northern Trust offers a steadier profitability profile with reasonable valuation metrics. Investors seeking growth with dividend income might lean toward Blackstone, while those favoring operational stability and value may prefer Northern Trust.
Which one offers the Superior Shareholder Reward?
I compare Blackstone Inc. (BX) and Northern Trust Corporation (NTRS) on dividends, payout ratios, and buybacks to find superior shareholder reward. BX yields 3.04-4.4% with payout ratios exceeding 100%, supported by steady buybacks, risking sustainability. NTRS yields 2.3-4.3% with payout ratios near 30-60%, focusing on stable dividends and reinvestment. BX’s aggressive buybacks enhance total return but inflate payout risk. NTRS’s conservative payout and reinvestment signal durable growth and less financial strain. I find NTRS offers a more sustainable, balanced shareholder return profile for 2026 investors, favoring steady income with growth potential over BX’s riskier yield chase.
Comparative Score Analysis: The Strategic Profile
The radar chart reveals the fundamental DNA and trade-offs of Blackstone Inc. and Northern Trust Corporation, highlighting their core financial strengths and valuation challenges:
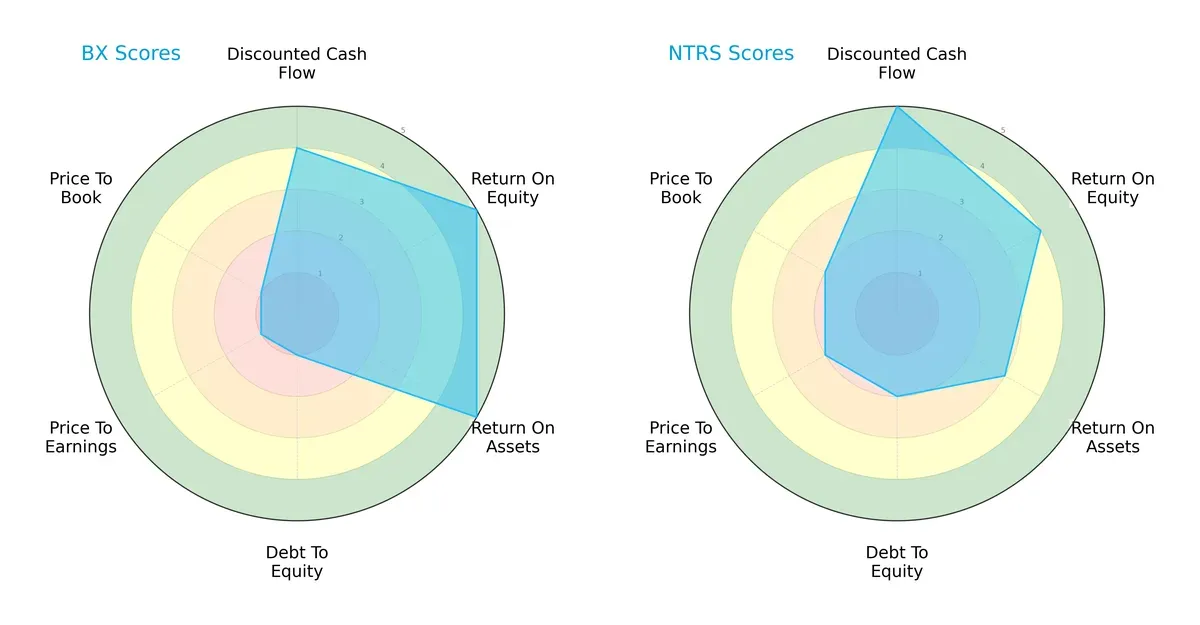
Blackstone excels in operational efficiency with top ROE and ROA scores (5 each), showing superior asset and equity returns. Northern Trust leads in discounted cash flow valuation (score 5) and maintains a more balanced debt profile (debt-to-equity score 2 vs. 1 for Blackstone). However, Blackstone suffers from weak valuation metrics (PE/PB scores at 1), signaling potential overvaluation risks. Northern Trust’s profile is more balanced, while Blackstone relies heavily on operational prowess despite financial leverage concerns.
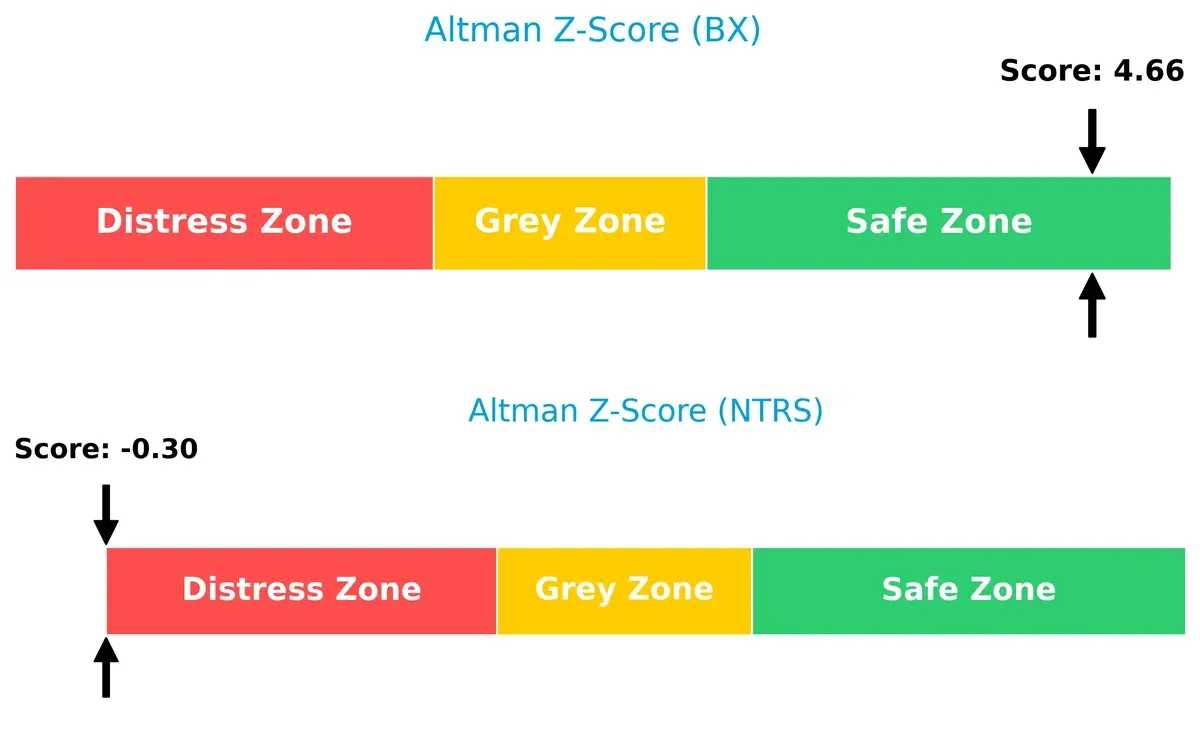
Bankruptcy Risk: Solvency Showdown
Blackstone’s Altman Z-Score of 4.66 places it firmly in the safe zone, indicating strong solvency and low bankruptcy risk. Northern Trust’s score of -0.30 signals distress, raising concerns about its long-term survival prospects in this cycle:
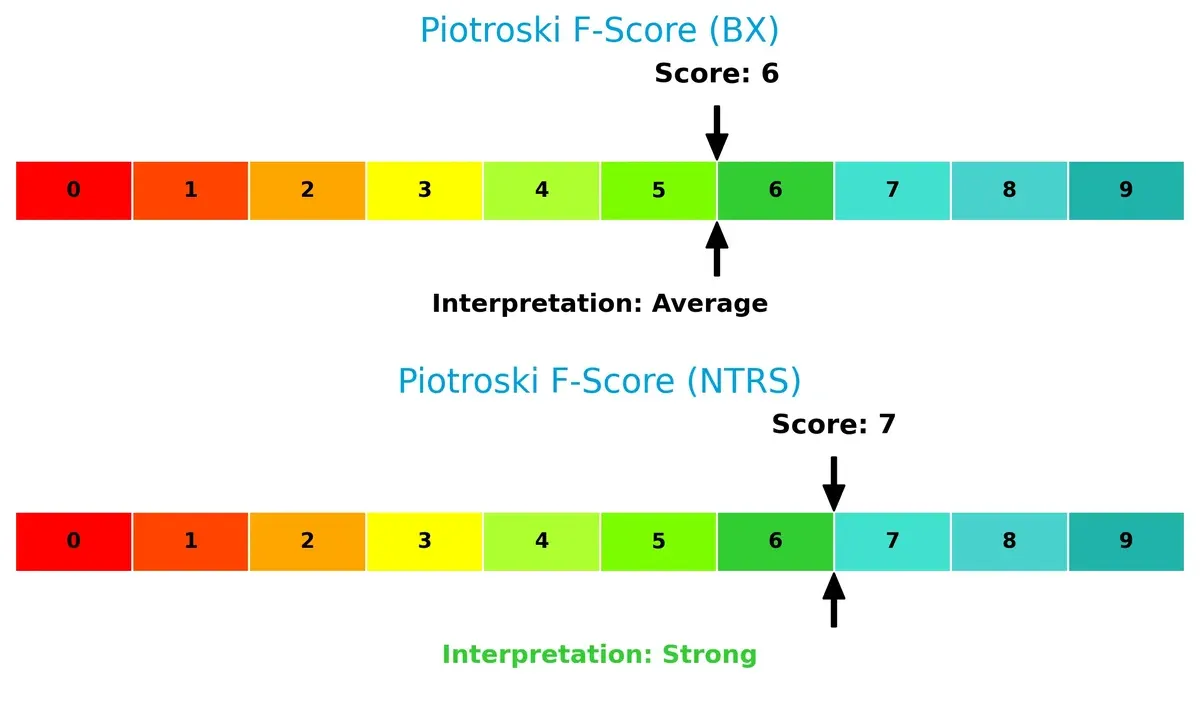
Financial Health: Quality of Operations
Northern Trust’s Piotroski F-Score of 7 indicates strong financial health, reflecting solid profitability, liquidity, and operational efficiency. Blackstone’s score of 6 is average, suggesting some internal weaknesses compared to its peer:
How are the two companies positioned?
This section dissects the operational DNA of BX and NTRS by comparing their revenue distribution and internal dynamics. The goal is to confront their economic moats to identify the most resilient competitive advantage today.
Revenue Segmentation: The Strategic Mix
This visual comparison dissects how Blackstone Inc. and Northern Trust Corporation diversify their income streams and where their primary sector bets lie:
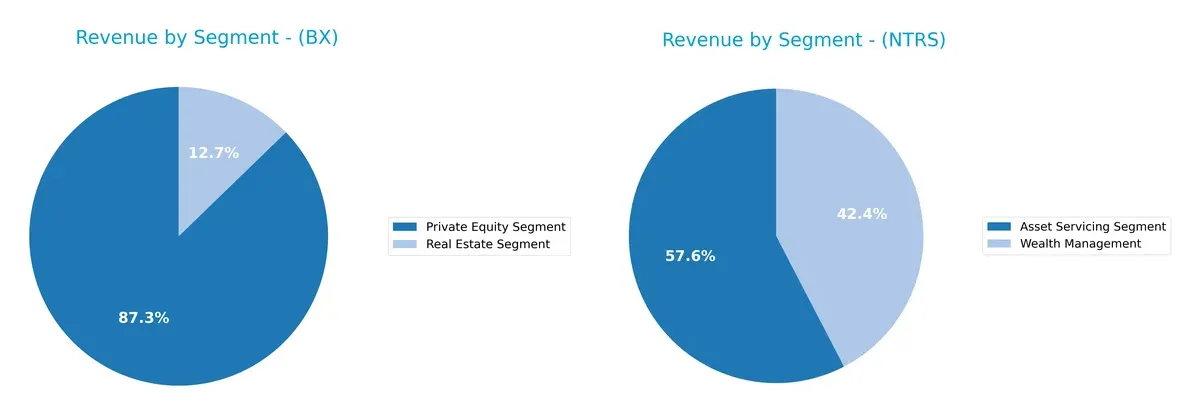
Blackstone’s 2024 revenue pivots on Private Equity at $1.39B, anchoring its portfolio with Real Estate at $203M. Northern Trust reveals a more balanced mix, with Asset Servicing at $4.37B and Wealth Management at $3.21B. Blackstone’s concentration signals reliance on its investment ecosystem, raising concentration risk. Northern Trust’s split diversifies exposure, reflecting a dual focus on client assets and service infrastructure, which supports stability through market cycles.
Strengths and Weaknesses Comparison
This table compares the Strengths and Weaknesses of Blackstone Inc. (BX) and Northern Trust Corporation (NTRS):
BX Strengths
- Diversified revenue streams across Private Equity, Real Estate, Credit, and Hedge Funds
- Strong net margin at 21.83%
- Favorable debt-to-assets and interest coverage
- Dividend yield of 3.04% supports shareholder returns
NTRS Strengths
- Solid wealth and asset servicing revenues
- Favorable price-to-earnings ratio at 14.75
- Strong fixed asset turnover at 30.78
- Geographic diversification with significant foreign revenue
BX Weaknesses
- Unfavorable ROE and ROIC at 0%, signaling weak capital efficiency
- Poor liquidity ratios (current and quick ratio at 0)
- High P/E ratio of 39.87 may suggest overvaluation
- Asset turnover ratios unfavorable
NTRS Weaknesses
- Low current and quick ratios at 0.41 indicate liquidity concerns
- Unfavorable debt-to-equity at 1.27 and weak interest coverage at 0.38
- WACC at 16.78% exceeds ROIC, signaling cost of capital issues
- Asset turnover low at 0.08
Blackstone shows strong profitability and diversified business segments, but struggles with some key efficiency and liquidity metrics. Northern Trust benefits from geographic diversification and asset turnover strengths, yet faces challenges in liquidity and capital cost management. These factors shape each company’s strategic financial positioning.
The Moat Duel: Analyzing Competitive Defensibility
A structural moat is the only reliable shield preserving long-term profits from relentless competition erosion. Let’s dissect two asset managers’ moats:
Blackstone Inc.: Diversification and Alternative Asset Leadership
Blackstone’s moat stems from its broad alternative asset portfolio and scale advantage. It delivers strong gross (86%) and EBIT margins (52%), reflecting operational efficiency. Yet, declining ROIC signals pressure ahead, though new markets in Asia and green energy might bolster its defenses in 2026.
Northern Trust Corporation: Client Relationships and Wealth Management Expertise
Northern Trust relies on deep client trust and asset servicing specialization, contrasting Blackstone’s alternative focus. Despite solid gross margin (57%), its ROIC trails WACC by nearly 12%, indicating value destruction. Expansion into international wealth markets offers growth, but margin pressures persist.
Verdict: Alternative Assets vs. Traditional Wealth Management Moats
Blackstone’s wider moat is rooted in asset diversification and operational scale, while Northern Trust’s narrower moat depends on client trust amid rising costs. Blackstone is better positioned to defend market share given its margin strength and growth avenues, despite near-term ROIC challenges.
Which stock offers better returns?
The past year shows Blackstone Inc. rising steadily with 13% gains and Northern Trust surging sharply by 83%, both demonstrating accelerating bullish trends.
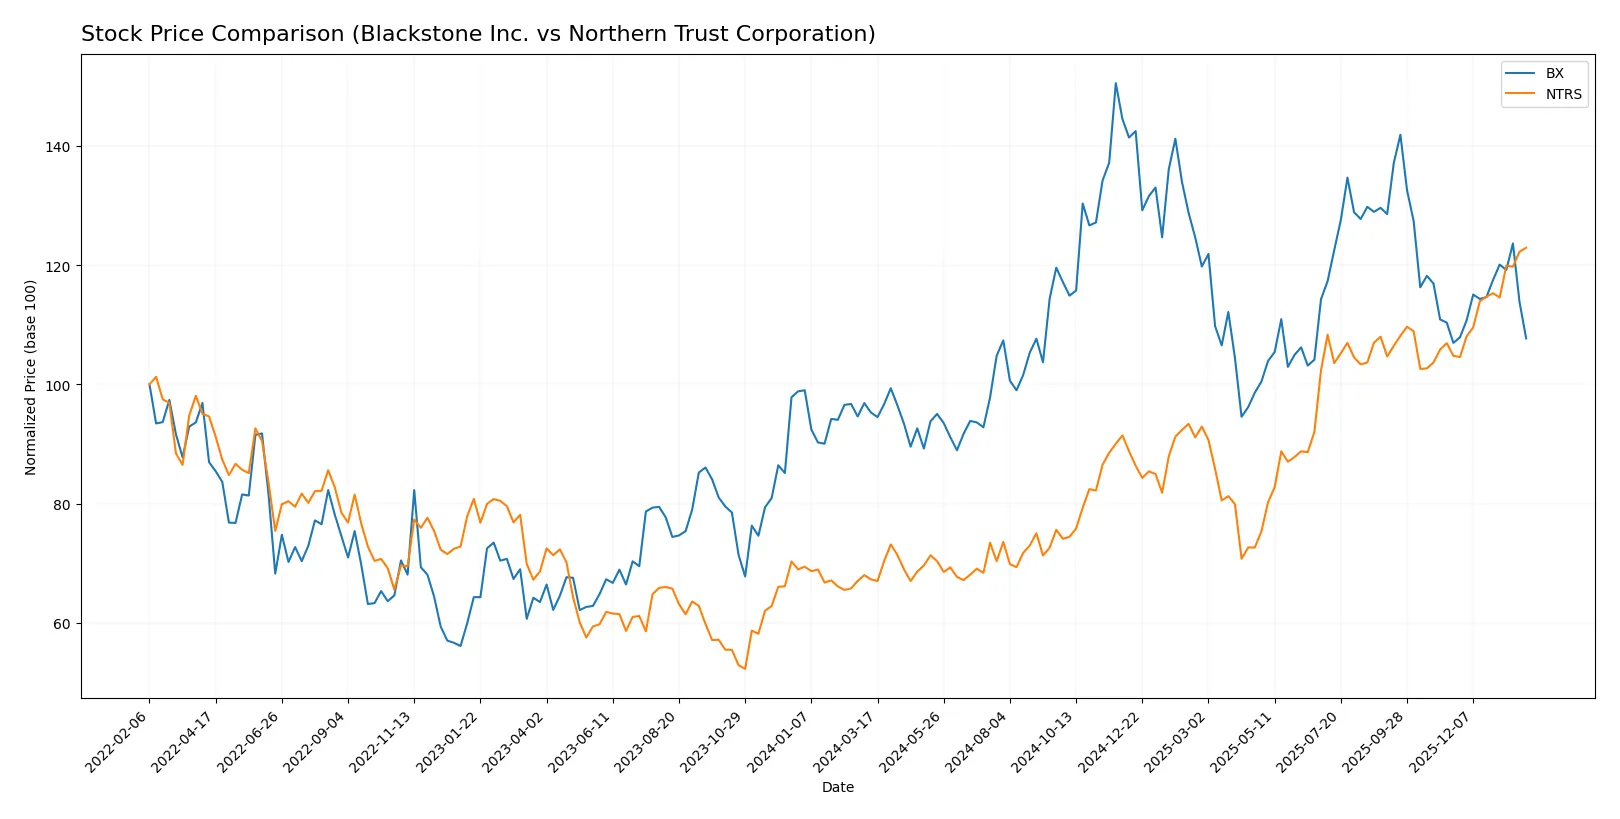
Trend Comparison
Blackstone Inc. gained 13.04% over the last 12 months, evidencing a bullish trend with price acceleration and a high of 199.05. Volatility is moderate with a 20.31 standard deviation.
Northern Trust Corporation surged 82.65% in the same period, also bullish with accelerating momentum. Its price ranged broadly from 81.45 to 149.43, showing strong upward volatility.
Northern Trust outperformed Blackstone decisively, delivering the highest market returns with stronger acceleration and buyer dominance over the past year.
Target Prices
Analysts present a cautiously optimistic consensus for Blackstone Inc. and Northern Trust Corporation.
| Company | Target Low | Target High | Consensus |
|---|---|---|---|
| Blackstone Inc. | 164 | 215 | 179.83 |
| Northern Trust Corporation | 131 | 160 | 146.17 |
The target consensus for Blackstone exceeds its current price of 142.42, indicating upside potential. Northern Trust’s consensus closely aligns with its current price of 149.43, suggesting a stable outlook.

Don’t Let Luck Decide Your Entry Point
Optimize your entry points with our advanced ProRealTime indicators. You’ll get efficient buy signals with precise price targets for maximum performance. Start outperforming now!
How do institutions grade them?
Blackstone Inc. Grades
The following table summarizes recent grades from recognized financial institutions for Blackstone Inc.:
| Grading Company | Action | New Grade | Date |
|---|---|---|---|
| TD Cowen | Maintain | Buy | 2026-01-30 |
| JP Morgan | Maintain | Neutral | 2026-01-30 |
| Citizens | Maintain | Market Outperform | 2026-01-30 |
| Barclays | Maintain | Equal Weight | 2026-01-30 |
| TD Cowen | Maintain | Buy | 2026-01-14 |
| UBS | Maintain | Neutral | 2026-01-13 |
| Barclays | Maintain | Equal Weight | 2026-01-09 |
| Barclays | Maintain | Equal Weight | 2025-12-12 |
| Barclays | Maintain | Equal Weight | 2025-10-24 |
| JP Morgan | Maintain | Neutral | 2025-10-24 |
Northern Trust Corporation Grades
The following table summarizes recent grades from recognized financial institutions for Northern Trust Corporation:
| Grading Company | Action | New Grade | Date |
|---|---|---|---|
| Goldman Sachs | Maintain | Sell | 2026-01-28 |
| Citigroup | Maintain | Neutral | 2026-01-28 |
| TD Cowen | Maintain | Buy | 2026-01-26 |
| Wells Fargo | Maintain | Equal Weight | 2026-01-23 |
| RBC Capital | Maintain | Outperform | 2026-01-23 |
| Evercore ISI Group | Maintain | In Line | 2026-01-23 |
| Morgan Stanley | Maintain | Underweight | 2026-01-23 |
| TD Cowen | Maintain | Buy | 2026-01-07 |
| Barclays | Maintain | Equal Weight | 2026-01-05 |
| Citigroup | Maintain | Neutral | 2025-12-30 |
Which company has the best grades?
Blackstone Inc. consistently receives Buy and Market Outperform ratings, while Northern Trust shows a wider range including Sell and Underweight grades. Investors may interpret Blackstone’s steadier positive outlook as a sign of relative institutional confidence.
Risks specific to each company
The following categories identify the critical pressure points and systemic threats facing both firms in the 2026 market environment:
1. Market & Competition
Blackstone Inc.
- Competes aggressively in alternative asset management with diversified strategies but faces high PE multiples and margin pressure.
Northern Trust Corporation
- Focuses on wealth management and asset servicing with moderate ROE and stable margins but contends with rising competition in banking services.
2. Capital Structure & Debt
Blackstone Inc.
- Strong interest coverage (14.12) with favorable debt-to-assets, but debt-to-equity data unavailable, raising transparency concerns.
Northern Trust Corporation
- Weaker interest coverage (0.38) and higher debt-to-equity (1.27) signal financial leverage risks and tighter liquidity.
3. Stock Volatility
Blackstone Inc.
- Beta of 1.75 indicates higher stock volatility, reflecting sensitivity to market cycles and economic shifts.
Northern Trust Corporation
- Lower beta of 1.29 suggests more stable price movements, offering less exposure to market swings.
4. Regulatory & Legal
Blackstone Inc.
- Operates globally with exposure to complex regulations across multiple asset classes and jurisdictions.
Northern Trust Corporation
- Faces intense regulatory scrutiny in wealth management and banking sectors, especially post-2024 reforms.
5. Supply Chain & Operations
Blackstone Inc.
- Relies on global real estate and credit markets; operational complexity in emerging markets could disrupt cash flows.
Northern Trust Corporation
- Heavy operational dependency on technology platforms for asset servicing exposes it to cyber risks and service outages.
6. ESG & Climate Transition
Blackstone Inc.
- Invests in alternative energy and greenfield projects, but faces execution and transition risks amid evolving ESG standards.
Northern Trust Corporation
- Committed to sustainable finance but must manage client demands and regulatory ESG compliance costs.
7. Geopolitical Exposure
Blackstone Inc.
- Broad international footprint exposes it to geopolitical tensions in Asia and Latin America impacting investment returns.
Northern Trust Corporation
- More US-centric but vulnerable to global economic uncertainty affecting institutional clients and cross-border banking.
Which company shows a better risk-adjusted profile?
Blackstone’s primary risk lies in high market volatility and unclear debt details, despite solid interest coverage and Altman Z-Score in the safe zone. Northern Trust struggles with liquidity and leverage concerns, reflected in a distress zone Z-Score. Despite stronger Piotroski scores, Northern Trust’s financial fragility and operational risks weigh heavier. I find Blackstone’s risk-adjusted profile more favorable due to robust bankruptcy protection and diversified asset exposure, despite elevated stock volatility. Northern Trust’s distress zone Z-Score and weak interest coverage demand caution amid tightening credit conditions.
Final Verdict: Which stock to choose?
Blackstone Inc. (BX) stands out with its superpower of delivering exceptional operational margins and strong income quality. Its ability to generate robust cash flow and maintain a bullish price trend highlights efficiency. A point of vigilance remains its declining return on invested capital, which could pressure long-term value creation. BX suits an aggressive growth portfolio seeking market leadership in alternative asset management.
Northern Trust Corporation (NTRS) boasts a strategic moat rooted in its niche as a trusted custodian and wealth manager, offering recurring revenue stability. Its strong Piotroski score and favorable discounted cash flow profile provide a cushion against volatility, despite weaker liquidity ratios and a distressed Altman Z-score. NTRS fits well within a GARP portfolio aiming for steady income with moderate growth.
If you prioritize operational excellence and high-margin growth, Blackstone Inc. is the compelling choice due to its superior cash generation and market momentum. However, if you seek stability and a defensible niche with recurring revenue, Northern Trust offers better resilience and valuation appeal despite some financial risks. Both present distinct analytical scenarios aligned with different investor risk tolerances.
Disclaimer: Investment carries a risk of loss of initial capital. The past performance is not a reliable indicator of future results. Be sure to understand risks before making an investment decision.
Go Further
I encourage you to read the complete analyses of Blackstone Inc. and Northern Trust Corporation to enhance your investment decisions: