Home > Comparison > Financial Services > BX vs KKR
The strategic rivalry between Blackstone Inc. and KKR & Co. Inc. defines the current trajectory of the asset management sector. Blackstone operates as a diversified alternative asset manager with a strong real estate focus, while KKR emphasizes private equity and credit investments across various industries. This analysis pits Blackstone’s broad multi-asset approach against KKR’s targeted investment style to determine which offers superior risk-adjusted returns for a diversified portfolio.
Table of contents
Companies Overview
Blackstone Inc. and KKR & Co. Inc. stand as titans in global alternative asset management, shaping investment landscapes worldwide.
Blackstone Inc.: Diversified Alternative Asset Manager
Blackstone Inc. dominates as a diversified alternative asset manager focusing on real estate, private equity, credit, and hedge fund solutions. Its core revenue derives from managing opportunistic and income-oriented real estate investments, corporate buyouts, and credit strategies across multiple regions. In 2026, Blackstone emphasizes expanding its global reach and deepening its real estate and credit platforms to capture resilient income streams.
KKR & Co. Inc.: Global Private Equity and Real Estate Investor
KKR & Co. Inc. anchors its identity in private equity and real estate investments across industries and geographies. Revenue stems from acquisitions, leveraged buyouts, credit special situations, and growth equity, with a strong focus on technology, infrastructure, and consumer sectors. In 2026, KKR prioritizes broadening its impact investments and scaling mid-market buyouts while enhancing its global diversification across emerging and developed markets.
Strategic Collision: Similarities & Divergences
Both firms champion alternative asset management but diverge in approach: Blackstone pursues a multi-asset, opportunistic strategy, while KKR targets focused buyouts and impact investing. Their primary battleground lies in real estate and private equity deal sourcing and execution. Blackstone offers a more diversified risk profile, whereas KKR’s strategy leans toward concentrated sector bets and longer holding periods.
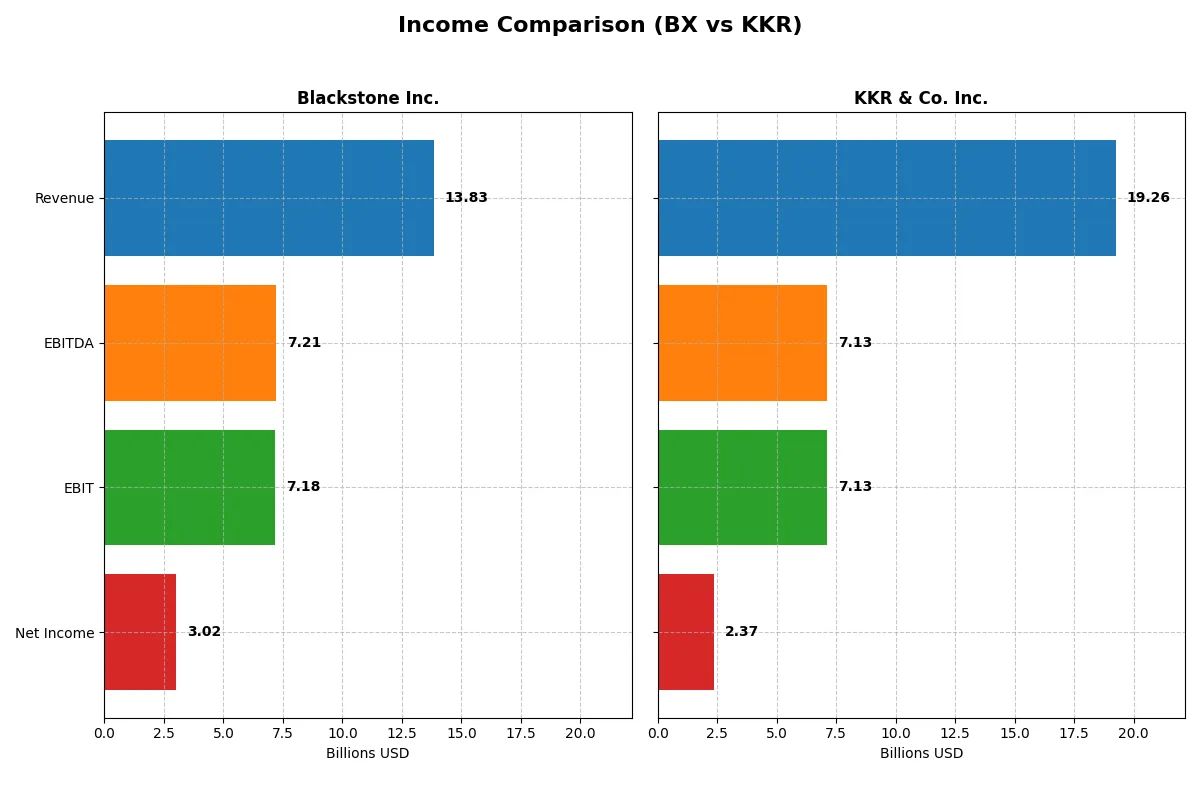
Income Statement Comparison
This data dissects the core profitability and scalability of both corporate engines to reveal who dominates the bottom line:
| Metric | Blackstone Inc. (BX) | KKR & Co. Inc. (KKR) |
|---|---|---|
| Revenue | 13.8B | 19.3B |
| Cost of Revenue | 1.9B | 11.2B |
| Operating Expenses | 4.7B | 7.6B |
| Gross Profit | 11.9B | 8.1B |
| EBITDA | 7.2B | 7.1B |
| EBIT | 7.2B | 7.1B |
| Interest Expense | 508M | 2.3B |
| Net Income | 3.0B | 2.4B |
| EPS | 3.88 | 2.52 |
| Fiscal Year | 2025 | 2025 |
Income Statement Analysis: The Bottom-Line Duel
This income statement comparison reveals which company operates with greater efficiency and delivers stronger profitability.
Blackstone Inc. Analysis
Blackstone’s revenue surged from 7.4B in 2023 to 13.8B in 2025, with net income rising from 1.39B to 3.02B. Their gross margin remains robust at 86%, reflecting tight cost control. Despite a slight net margin dip to 21.8%, Blackstone’s EBIT margin holds strong near 52%, showcasing operational momentum and efficiency.
KKR & Co. Inc. Analysis
KKR’s revenue peaked at 21.6B in 2024 before falling 11% to 19.3B in 2025; net income dropped from 3.08B to 2.37B. Gross margin at 42% and EBIT margin at 37% reflect a leaner profit structure but with higher interest expense pressure. The recent decline in earnings and margins signals weakening operational momentum.
Margin Dominance vs. Revenue Scale
Blackstone leads on profitability, boasting superior gross and EBIT margins alongside healthier net profits. KKR’s larger revenue base comes with thinner margins and recent earnings softness. Investors seeking consistent margin power will favor Blackstone’s efficient profit engine over KKR’s scale-driven but volatile profile.
Financial Ratios Comparison
These vital ratios act as a diagnostic tool to expose the underlying fiscal health, valuation premiums, and capital efficiency of the companies analyzed:
| Ratios | Blackstone Inc. (BX) | KKR & Co. Inc. (KKR) |
|---|---|---|
| ROE | 34.8% | 13.0% |
| ROIC | 17.2% | 0.3% |
| P/E | 39.9 | 42.6 |
| P/B | 13.9 | 5.5 |
| Current Ratio | 0.85 | 4.12 |
| Quick Ratio | 0.85 | 4.12 |
| D/E | 1.44 | 2.15 |
| Debt-to-Assets | 26.1% | 14.1% |
| Interest Coverage | 14.1 | 0.28 |
| Asset Turnover | 0.29 | 0.06 |
| Fixed Asset Turnover | 18.3 | 12.2 |
| Payout ratio | 121.3% | 19.9% |
| Dividend yield | 3.04% | 0.47% |
| Fiscal Year | 2025 | 2024 |
Efficiency & Valuation Duel: The Vital Signs
Financial ratios act as the company’s DNA, uncovering hidden risks and operational strengths that define investment potential.
Blackstone Inc.
Blackstone delivers strong profitability with a 34.8% ROE and a net margin of 21.8%, signaling operational excellence. However, its valuation is stretched, reflected in a high P/E of 39.9 and P/B of 13.9. The firm supports shareholders with a 3.0% dividend yield, balancing growth and income effectively.
KKR & Co. Inc.
KKR shows moderate profitability, with a 13.0% ROE and 14.2% net margin, indicating stable but less efficient operations. Its valuation is also expensive, with a P/E of 42.7 and a lower P/B of 5.6. Dividend yield is weak at 0.5%, suggesting limited direct shareholder returns and a possible focus on reinvestment.
Premium Valuation vs. Operational Safety
Blackstone offers a better balance of high returns with a reasonable dividend, despite valuation stretch. KKR’s weaker profitability and lower yield raise risk concerns. Investors seeking operational strength and income may prefer Blackstone, while those targeting growth through reinvestment might consider KKR’s profile.
Which one offers the Superior Shareholder Reward?
I see Blackstone (BX) delivers a higher dividend yield around 3.0–4.4% with payout ratios often exceeding 100%, signaling aggressive shareholder returns but potential sustainability risks. KKR yields under 1%, maintaining low payout ratios near 20%, favoring reinvestment and buybacks. Both deploy buybacks, yet BX’s higher dividend and solid free cash flow coverage better reward shareholders in 2026. I judge BX’s distribution more attractive for total return despite leverage concerns, as KKR’s conservative payouts limit immediate income growth.
Comparative Score Analysis: The Strategic Profile
The radar chart reveals the fundamental DNA and trade-offs of Blackstone Inc. and KKR & Co. Inc., highlighting their distinct financial strengths and weaknesses:
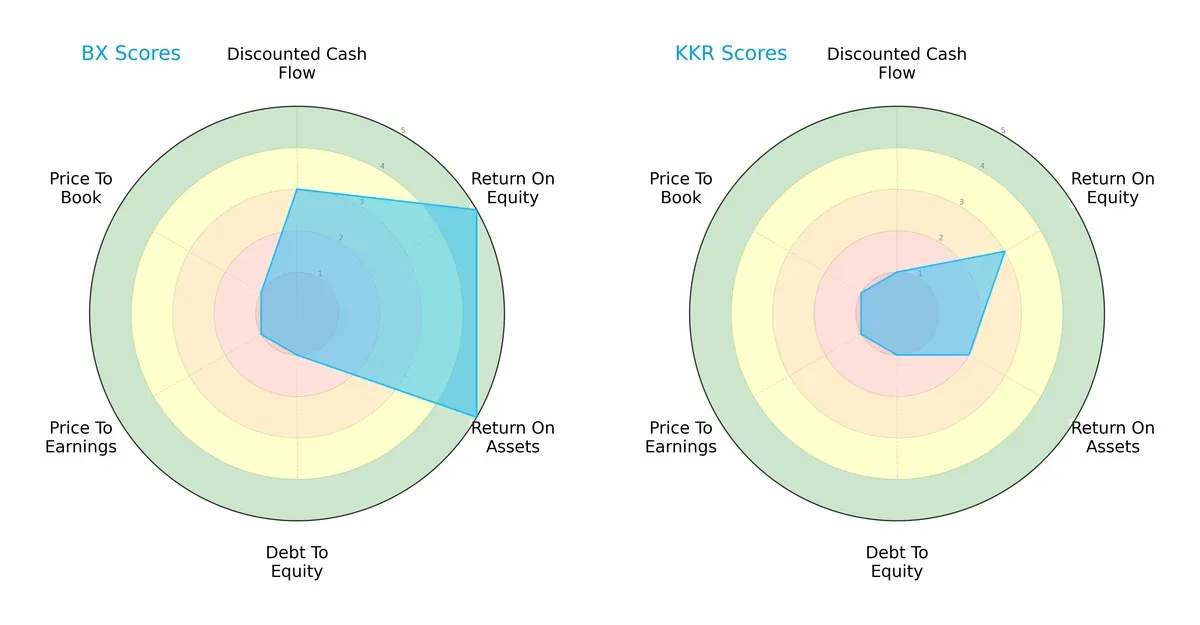
Blackstone leads with strong returns on equity (5) and assets (5), showing operational efficiency. KKR lags with moderate ROE (3) and weaker ROA (2). Both share very unfavorable debt-to-equity and valuation scores (1), signaling high leverage and rich pricing. Blackstone presents a more balanced profile, while KKR relies more on its moderate profitability edge.
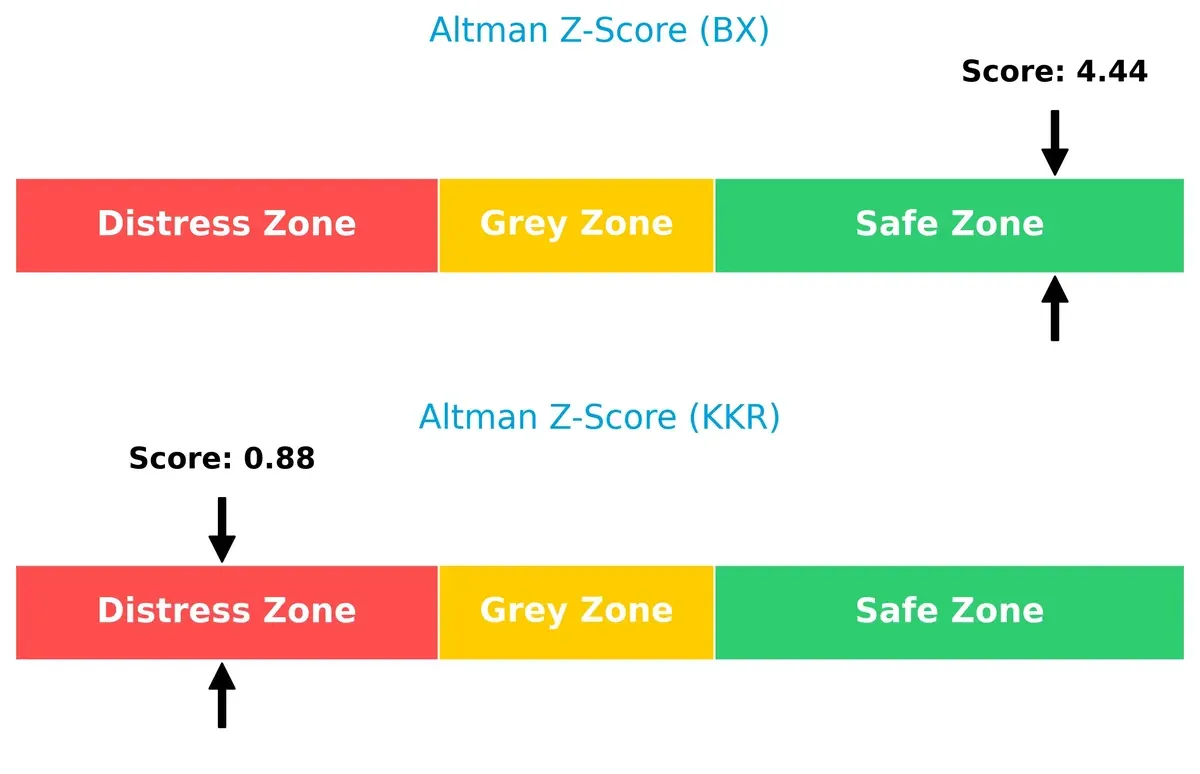
Bankruptcy Risk: Solvency Showdown
Blackstone’s Altman Z-Score of 4.44 places it securely in the safe zone, signaling robust long-term solvency. KKR’s 0.88 score falls into distress territory, indicating significant bankruptcy risk in this cycle:
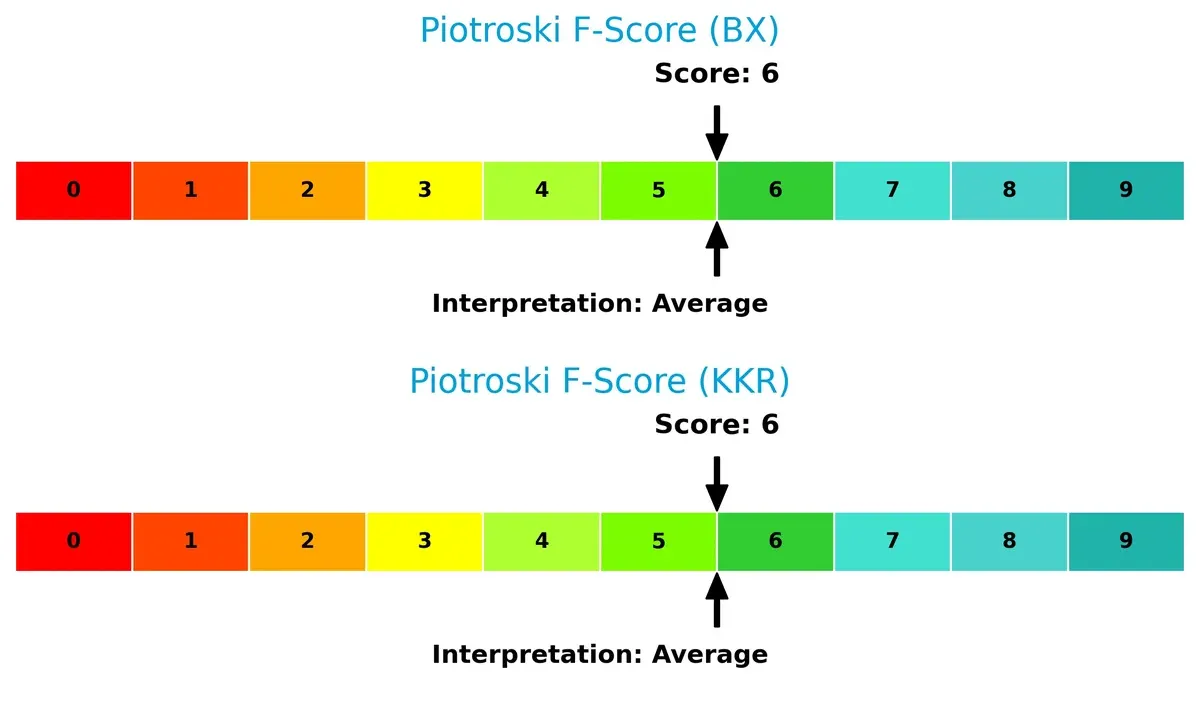
Financial Health: Quality of Operations
Both firms share an average Piotroski F-Score of 6, reflecting decent but not peak financial health. Neither shows glaring red flags, though there is room for improvement in operational efficiency and balance sheet quality:
How are the two companies positioned?
This section dissects the operational DNA of Blackstone (BX) and KKR by comparing revenue distribution and internal strengths and weaknesses. The goal is to confront their economic moats and determine which model offers the most resilient, sustainable advantage today.
Revenue Segmentation: The Strategic Mix
This visual comparison dissects how Blackstone Inc. and KKR & Co. Inc. diversify their income streams and where their primary sector bets lie:
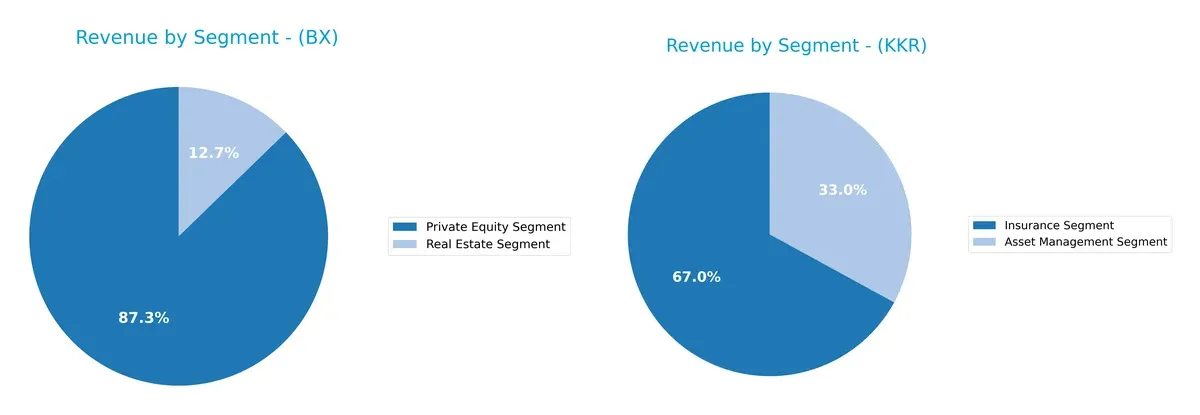
Blackstone anchors revenue in Private Equity with $1.39B and Real Estate at $203M in 2024, showing moderate diversification. KKR dwarfs with $14.7B in Insurance and $7.2B in Asset Management, heavily concentrated yet balanced between two dominant segments. Blackstone’s mix signals exposure to private market cycles, while KKR’s insurance dominance suggests a strategic pivot to stable, recurring premiums, reducing volatility but raising concentration risk.
Strengths and Weaknesses Comparison
This table compares the Strengths and Weaknesses of Blackstone Inc. and KKR & Co. Inc.:
Blackstone Inc. Strengths
- Favorable net margin and ROE reflect strong profitability
- Solid ROIC well above WACC shows efficient capital allocation
- Low debt-to-assets ratio reduces financial risk
- High interest coverage supports debt servicing
- Diverse revenue streams across Private Equity, Real Estate, Credit, and Hedge Funds
KKR & Co. Inc. Strengths
- Favorable net margin indicates profitability
- Strong quick ratio signals comfortable liquidity
- Low debt-to-assets ratio limits leverage risk
- Revenue diversification between Asset Management and Insurance segments
- Consistent fixed asset turnover demonstrates asset utilization
Blackstone Inc. Weaknesses
- Low current ratio below 1 signals liquidity pressure
- High price-to-earnings and price-to-book ratios may indicate overvaluation
- Elevated debt-to-equity ratio increases leverage concerns
- Asset turnover below sector averages points to operational inefficiency
KKR & Co. Inc. Weaknesses
- Unfavorable ROIC near zero suggests poor capital returns
- High debt-to-equity ratio increases financial risk
- Unfavorable current ratio despite strong quick ratio hints at working capital imbalance
- Low dividend yield reduces income appeal
- Higher proportion of unfavorable financial ratios than favorable
Blackstone’s strengths hinge on high profitability and efficient capital use despite leverage and liquidity concerns. KKR’s diversified revenue and liquidity are offset by weak returns on invested capital and valuation risks. Both firms must navigate trade-offs between growth, risk, and capital efficiency in their strategies.
The Moat Duel: Analyzing Competitive Defensibility
A structural moat protects long-term profits from competition’s relentless erosion. Only firms with durable moats sustain economic value over decades:
Blackstone Inc.: Diversified Asset Mastery with Capital Efficiency
Blackstone’s moat stems from diversified alternative asset management and strong capital allocation. Its ROIC exceeds WACC by 6.4%, signaling value creation despite a declining trend. New market expansions in Asia and green energy may deepen this moat in 2026.
KKR & Co. Inc.: Broad Sector Reach with Turnaround Expertise
KKR relies on sector diversity and turnaround investments, contrasting Blackstone’s capital efficiency. KKR’s ROIC trend declines sharply, and ROIC vs. WACC data is unavailable, raising questions on value creation. Growth hinges on its ability to leverage emerging tech and infrastructure.
Value Creation vs. Sector Breadth: Which Moat Defends Best?
Blackstone holds a wider, more quantifiable moat through consistent capital efficiency and high margins. KKR’s broader sector exposure offers potential but lacks clear ROIC advantage. Blackstone stands better poised to defend market share amid rising competition.
Which stock offers better returns?
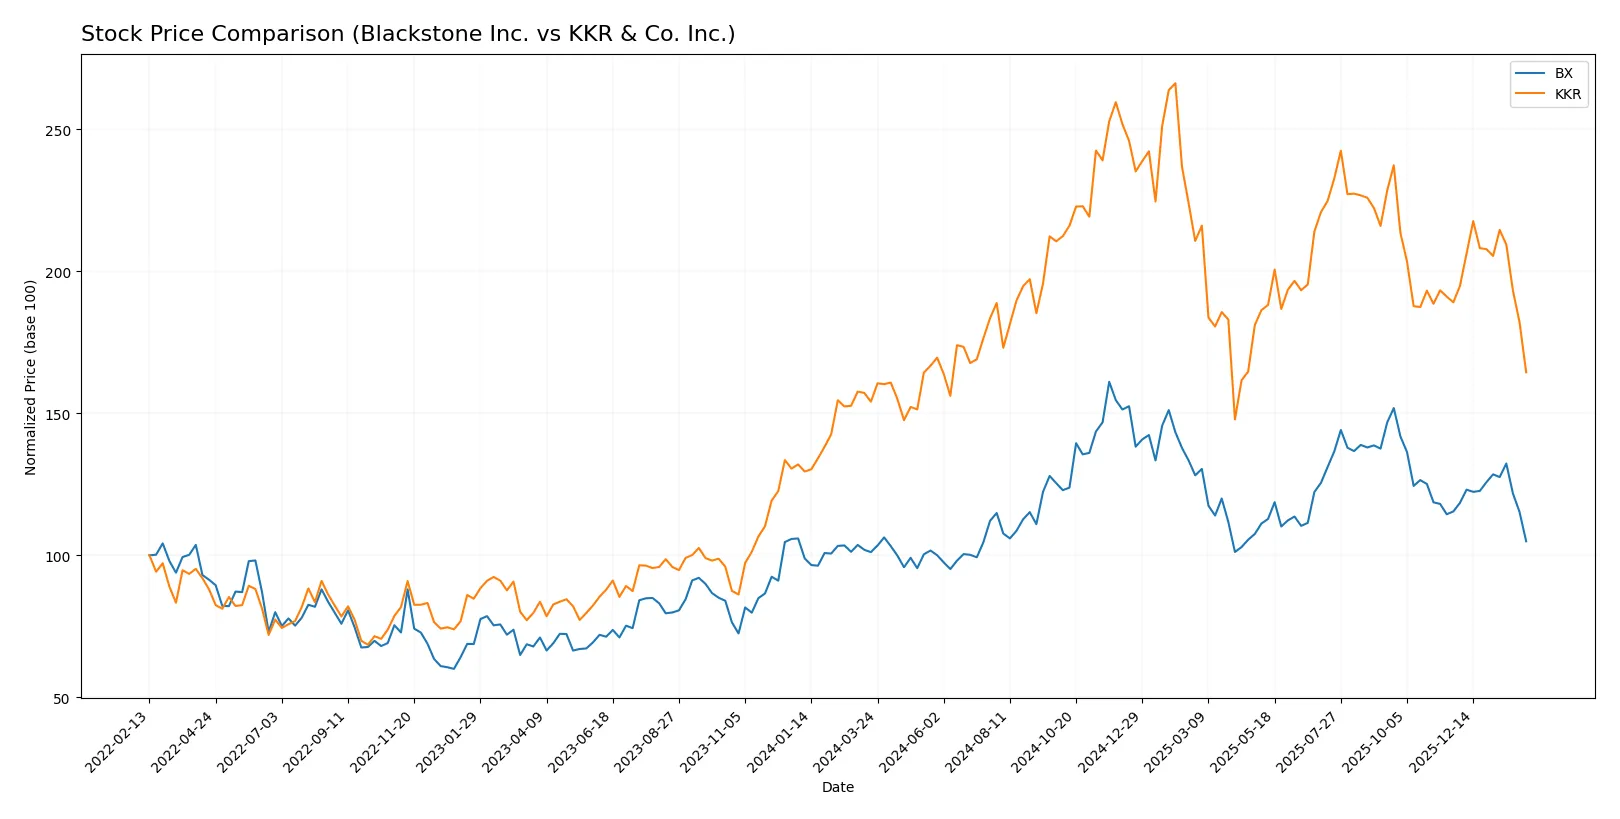
Over the past 12 months, Blackstone Inc. and KKR & Co. Inc. showed bullish trends with decelerating momentum, despite recent price declines and shifting buyer-seller dynamics.
Trend Comparison
Blackstone Inc. gained 3.78% over the past year, signaling a bullish but decelerating trend. The stock ranged from $117.62 to $199.05, with recent slight seller dominance.
KKR & Co. Inc. rose 6.72% in the last 12 months, also bullish with deceleration. It traded between $92.62 and $167.07 but showed stronger recent selling pressure and higher recent losses.
KKR outperformed Blackstone with a higher annual gain despite both facing recent downward pressure and seller dominance in late 2025 to early 2026.
Target Prices
Analysts present a cautiously optimistic consensus for Blackstone Inc. and KKR & Co. Inc.
| Company | Target Low | Target High | Consensus |
|---|---|---|---|
| Blackstone Inc. | 158 | 215 | 178.17 |
| KKR & Co. Inc. | 125 | 187 | 156 |
The target consensus for Blackstone sits 37% above its current price of $129.69, signaling strong upside potential. KKR’s consensus target similarly exceeds its $103.20 price by about 51%, reflecting robust analyst expectations.

Don’t Let Luck Decide Your Entry Point
Optimize your entry points with our advanced ProRealTime indicators. You’ll get efficient buy signals with precise price targets for maximum performance. Start outperforming now!
How do institutions grade them?
Blackstone Inc. Grades
The table below summarizes recent grades from major financial institutions for Blackstone Inc.:
| Grading Company | Action | New Grade | Date |
|---|---|---|---|
| Piper Sandler | Maintain | Neutral | 2026-02-02 |
| TD Cowen | Maintain | Buy | 2026-01-30 |
| JP Morgan | Maintain | Neutral | 2026-01-30 |
| Citizens | Maintain | Market Outperform | 2026-01-30 |
| Barclays | Maintain | Equal Weight | 2026-01-30 |
| TD Cowen | Maintain | Buy | 2026-01-14 |
| UBS | Maintain | Neutral | 2026-01-13 |
| Barclays | Maintain | Equal Weight | 2026-01-09 |
| Barclays | Maintain | Equal Weight | 2025-12-12 |
| JP Morgan | Maintain | Neutral | 2025-10-24 |
KKR & Co. Inc. Grades
Below are recent institutional grades for KKR & Co. Inc. from reputable sources:
| Grading Company | Action | New Grade | Date |
|---|---|---|---|
| Oppenheimer | Maintain | Outperform | 2026-02-06 |
| Barclays | Maintain | Overweight | 2026-02-06 |
| TD Cowen | Downgrade | Hold | 2026-01-14 |
| UBS | Maintain | Buy | 2026-01-13 |
| Barclays | Maintain | Overweight | 2026-01-09 |
| Barclays | Maintain | Overweight | 2025-12-12 |
| Barclays | Maintain | Overweight | 2025-11-11 |
| Oppenheimer | Maintain | Outperform | 2025-11-10 |
| TD Cowen | Maintain | Buy | 2025-11-10 |
| Morgan Stanley | Maintain | Overweight | 2025-10-21 |
Which company has the best grades?
KKR & Co. Inc. consistently receives higher grades such as Outperform and Overweight compared to Blackstone’s Neutral and Equal Weight ratings. This suggests stronger analyst conviction in KKR’s near-term prospects, potentially influencing investor confidence.
Risks specific to each company
The following categories identify critical pressure points and systemic threats facing Blackstone Inc. and KKR & Co. Inc. in the 2026 market environment:
1. Market & Competition
Blackstone Inc.
- Dominates with broad alternative asset management segments and global reach.
KKR & Co. Inc.
- Highly diversified but faces intense competition in mid to large buyouts across multiple sectors.
2. Capital Structure & Debt
Blackstone Inc.
- Moderate debt-to-assets at 26%, but high debt-to-equity ratio of 1.44 is a red flag.
KKR & Co. Inc.
- Lower debt-to-assets at 14%, but higher debt-to-equity at 2.15 signals significant leverage risk.
3. Stock Volatility
Blackstone Inc.
- Beta of 1.76 indicates above-market volatility, with a stable dividend yield of 3.04%.
KKR & Co. Inc.
- Higher beta at 1.99 signals greater volatility and a lower dividend yield of 0.47%.
4. Regulatory & Legal
Blackstone Inc.
- Operates globally with exposure to complex regulations, especially in real estate and credit markets.
KKR & Co. Inc.
- Broad sector exposure increases regulatory scrutiny, especially in energy and financial services.
5. Supply Chain & Operations
Blackstone Inc.
- Focus on real estate and credit markets reduces direct supply chain risks.
KKR & Co. Inc.
- Diverse investments in manufacturing and logistics sectors face higher operational risks.
6. ESG & Climate Transition
Blackstone Inc.
- Invests in greenfield alternative energy projects, aligning with climate transition goals.
KKR & Co. Inc.
- Impact investing focus on social and environmental positives, but broad industrial exposure adds complexity.
7. Geopolitical Exposure
Blackstone Inc.
- Global presence in Asia, Europe, and Americas exposes it to geopolitical tensions and currency risks.
KKR & Co. Inc.
- Extensive geographic footprint including emerging markets increases exposure to geopolitical uncertainties.
Which company shows a better risk-adjusted profile?
Blackstone’s strongest risk is its leveraged capital structure, with a debt-to-equity ratio that raises caution. KKR’s most significant risk lies in its distressed financial health, reflected in a low Altman Z-score signaling bankruptcy risk. Blackstone shows a better risk-adjusted profile supported by superior profitability and financial stability. Its Altman Z-score in the safe zone contrasts sharply with KKR’s distress zone reading. This gap underlines Blackstone’s more resilient capital allocation and operational performance in the current market cycle.
Final Verdict: Which stock to choose?
Blackstone Inc. (BX) stands out as a cash-generating powerhouse with a proven ability to create value above its cost of capital. Its high return on equity signals operational excellence. However, a low current ratio flags short-term liquidity risks. BX suits investors targeting aggressive growth with a tolerance for leverage nuances.
KKR & Co. Inc. (KKR) offers a strategic moat grounded in diversified asset management and recurring fee income. Its stronger liquidity profile relative to BX reduces immediate financial stress. Yet, a sharply declining ROIC indicates caution. KKR fits investors favoring GARP strategies seeking stability with moderate growth.
If you prioritize value creation and robust profitability, Blackstone outshines due to its superior returns and operational efficiency despite liquidity concerns. However, if you seek portfolio stability with a focus on recurring revenue, KKR offers better safety but demands vigilance on declining capital returns. Both present analytical scenarios for distinct investor profiles.
Disclaimer: Investment carries a risk of loss of initial capital. The past performance is not a reliable indicator of future results. Be sure to understand risks before making an investment decision.
Go Further
I encourage you to read the complete analyses of Blackstone Inc. and KKR & Co. Inc. to enhance your investment decisions: