Home > Comparison > Financial Services > BX vs IVZ
The strategic rivalry between Blackstone Inc. and Invesco Ltd. shapes the competitive landscape of financial services. Blackstone operates as a capital-intensive alternative asset manager focused on private equity and real estate. In contrast, Invesco specializes in diversified investment management with a retail and institutional client base. This analysis evaluates which firm’s operational model and capital allocation offer the superior risk-adjusted return for a diversified portfolio in 2026.
Table of contents
Companies Overview
Blackstone Inc. and Invesco Ltd. command significant influence in asset management with distinct strategic priorities and scale.
Blackstone Inc.: Alternative Asset Powerhouse
Blackstone excels as a leader in alternative asset management, generating revenue from real estate, private equity, hedge funds, and credit products. Its 2026 focus remains on opportunistic, core+ real estate investments and global private equity buyouts. The firm leverages a multi-asset class strategy across North America, Europe, and Asia, emphasizing large-scale transactions and diversified growth platforms.
Invesco Ltd.: Diverse Investment Manager
Invesco operates as a broad-based investment manager serving retail and institutional clients worldwide. It earns revenue by managing equity, fixed income, commodity, and multi-asset portfolios, including mutual and exchange-traded funds. In 2026, Invesco prioritizes quantitative strategies and diversified asset allocation, balancing public equity and fixed income markets with alternative investments for client-specific mandates.
Strategic Collision: Similarities & Divergences
Blackstone and Invesco both dominate asset management but diverge sharply in philosophy. Blackstone focuses on a closed ecosystem of alternative and private market assets, while Invesco embraces an open infrastructure across public markets and ETFs. Their primary battleground is institutional capital, with Blackstone targeting large-scale private deals and Invesco emphasizing liquid, diversified portfolios. This contrast defines their distinct risk and growth profiles for investors.
Income Statement Comparison
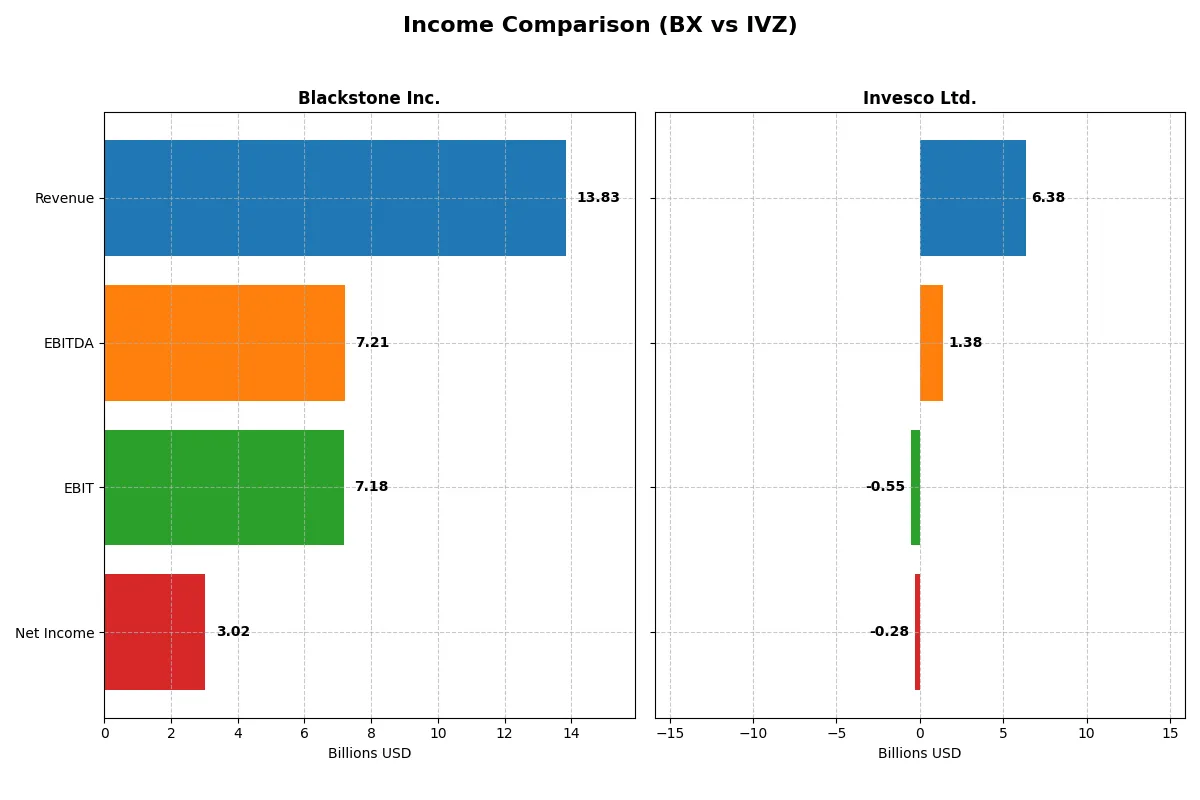
This comparison dissects the core profitability and scalability of both corporate engines to reveal who dominates the bottom line:
| Metric | Blackstone Inc. (BX) | Invesco Ltd. (IVZ) |
|---|---|---|
| Revenue | 13.8B | 6.38B |
| Cost of Revenue | 1.93B | 3.62B |
| Operating Expenses | 4.72B | 3.45B |
| Gross Profit | 11.9B | 2.75B |
| EBITDA | 7.21B | 1.38B |
| EBIT | 7.18B | -547M |
| Interest Expense | 508M | 82.5M |
| Net Income | 3.02B | -281.7M |
| EPS | 3.88 | -1.61 |
| Fiscal Year | 2025 | 2025 |
Income Statement Analysis: The Bottom-Line Duel
The income statement comparison reveals which company runs a more efficient and profitable corporate engine through margins and growth dynamics.
Blackstone Inc. Analysis
Blackstone’s revenue climbed from 7.4B in 2023 to 13.8B in 2025, showing strong momentum. Its gross margin holds steady above 86%, revealing excellent cost control. Despite a slight dip in net margin last year, Blackstone maintains a robust 21.8% net margin in 2025, reflecting operational efficiency and solid bottom-line growth.
Invesco Ltd. Analysis
Invesco’s revenue grew modestly from 5.7B in 2023 to 6.4B in 2025, but its profitability struggles. The gross margin at 43.2% is respectable, yet the EBIT margin plunged to -8.6% in 2025, signaling operational challenges. Negative net margins and losses in 2025 highlight ongoing inefficiencies and deteriorating earnings quality.
Margin Excellence vs. Profitability Struggles
Blackstone outperforms Invesco decisively with superior margin profiles and profitable growth. Blackstone’s high gross and net margins show disciplined cost management and strong earnings resilience. Invesco’s persistently negative net income and EBIT margin raise caution about its operational effectiveness. For investors, Blackstone’s profile offers a more attractive combination of scale and profitability.
Financial Ratios Comparison
These vital ratios act as a diagnostic tool to expose underlying fiscal health, valuation premiums, and capital efficiency of the companies compared below:
| Ratios | Blackstone Inc. (BX) | Invesco Ltd. (IVZ) |
|---|---|---|
| ROE | 33.8% (2024) | 5.3% (2024) |
| ROIC | 12.5% (2024) | 2.4% (2024) |
| P/E | 47.6 (2024) | 10.3 (2024) |
| P/B | 16.1 (2024) | 0.55 (2024) |
| Current Ratio | N/A (0 in 2024) | 3.14 (2024) |
| Quick Ratio | N/A (0 in 2024) | 3.14 (2024) |
| D/E | 1.50 (2024) | 0.52 (2024) |
| Debt-to-Assets | 28.3% (2024) | 27.9% (2024) |
| Interest Coverage | 14.6 (2024) | 14.3 (2024) |
| Asset Turnover | 0.26 (2024) | 0.22 (2024) |
| Fixed Asset Turnover | 8.46 (2024) | 12.7 (2024) |
| Payout ratio | 159% (2024) | 79% (2024) |
| Dividend yield | 3.35% (2024) | 7.61% (2024) |
| Fiscal Year | 2024 | 2024 |
Efficiency & Valuation Duel: The Vital Signs
Ratios act as a company’s DNA, exposing hidden risks and operational strengths behind headline numbers.
Blackstone Inc.
Blackstone shows a strong net margin of 21.8%, signaling operational efficiency. However, its high P/E of 39.9 suggests the stock trades at a premium. Despite unfavorable returns on equity and invested capital, the firm supports shareholders with a 3.04% dividend yield, balancing growth with income.
Invesco Ltd.
Invesco struggles with a negative net margin of -11.4%, reflecting profitability challenges. Its negative P/E of -16.4 indicates earnings distress but a dividend yield of 3.18% offers some return. The company’s unfavorable interest coverage ratio raises caution on financial stability and operational risks.
Premium Valuation vs. Operational Safety
Blackstone commands a premium valuation backed by solid profitability and steady dividends, while Invesco faces profitability and financial risks despite dividend income. Blackstone suits investors seeking operational strength; Invesco may appeal to those prioritizing income amid uncertainty.
Which one offers the Superior Shareholder Reward?
I compare Blackstone Inc. (BX) and Invesco Ltd. (IVZ) by their dividend yields, payout ratios, and buyback intensity to assess total shareholder return sustainability. BX yields around 3%, with a payout ratio above 100%, signaling aggressive dividends likely funded by cash flow or debt. Its buyback activity is less clear but historically significant. IVZ pays a modest 3.2% yield with a lower payout ratio and a clear reinvestment strategy in free cash flow, reflecting a cautious capital allocation amid profitability swings. BX’s model offers higher immediate income but risks sustainability. IVZ focuses on balance sheet strength and operational turnaround, favoring long-term growth. For 2026, I find BX’s shareholder reward superior for income-focused investors, but IVZ’s approach may appeal to those prioritizing stability and recovery.
Comparative Score Analysis: The Strategic Profile
The radar chart reveals the fundamental DNA and trade-offs of Blackstone Inc. and Invesco Ltd., highlighting their core financial strengths and weaknesses:
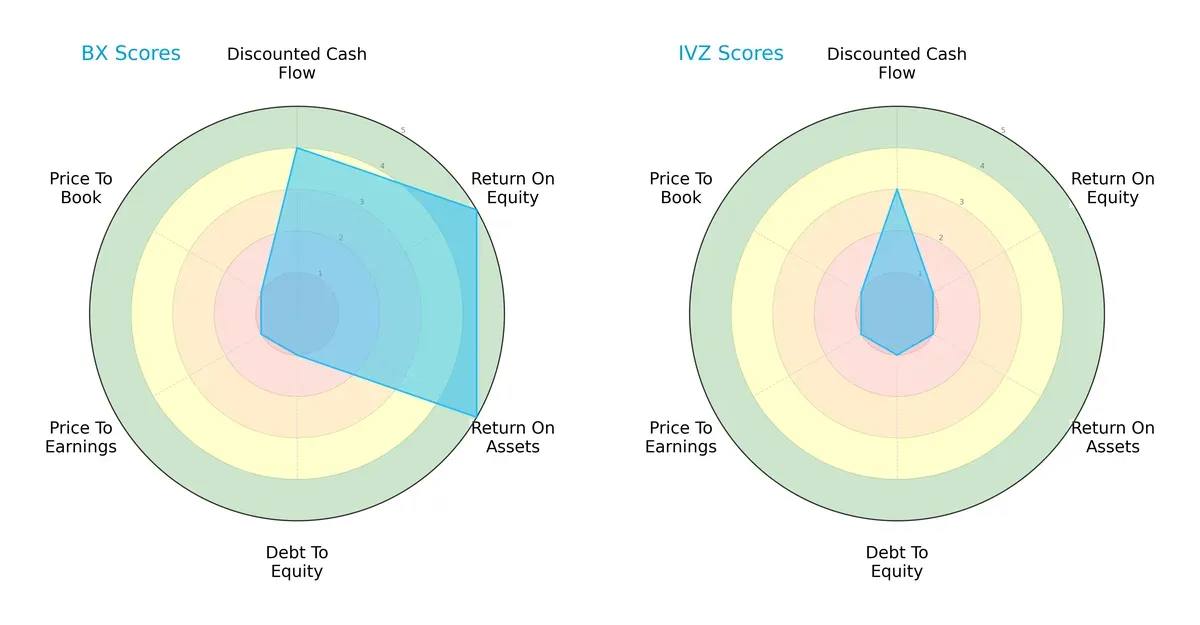
Blackstone dominates in profitability metrics with high ROE and ROA scores (5 each), signaling efficient capital and asset use. Invesco, by contrast, struggles with very low ROE and ROA scores (1 each), reflecting weaker operational efficiency. Both firms share weak valuations and debt-to-equity scores, indicating overvaluation risks and leverage concerns. Blackstone offers a more balanced profile, leveraging strong cash flow and returns despite debt risks, while Invesco relies on limited strengths without clear edges.
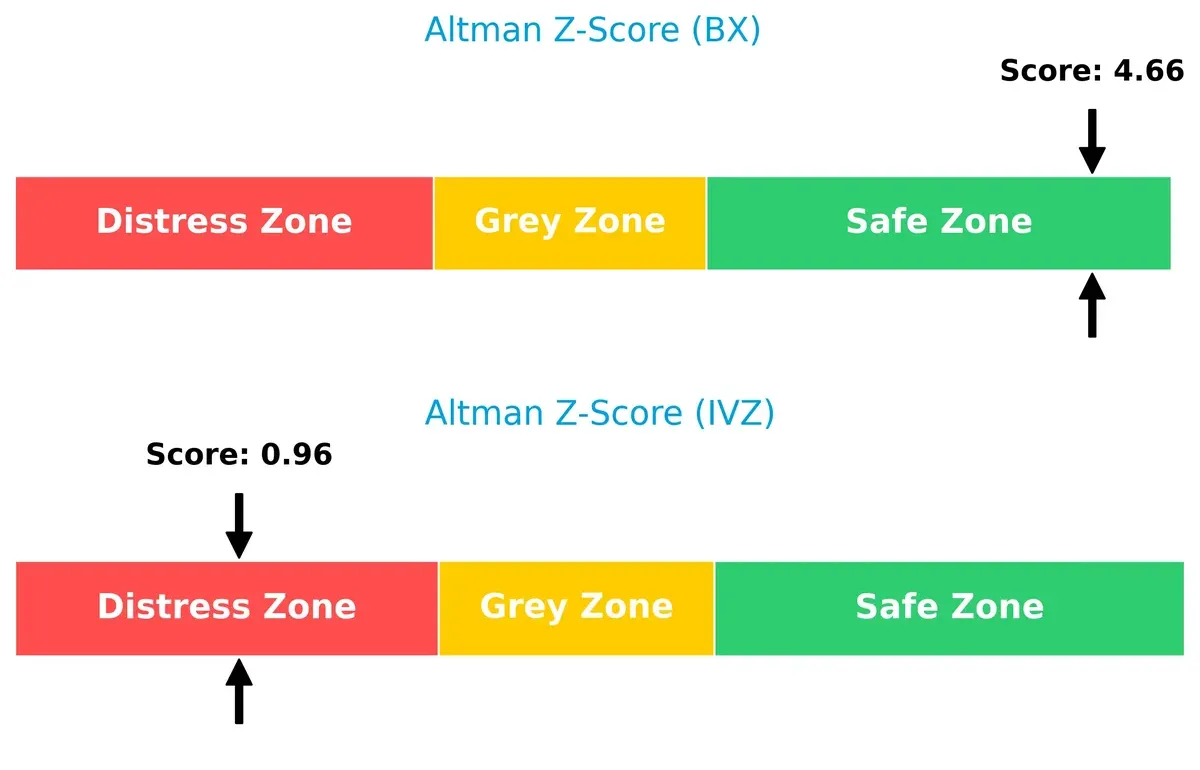
Bankruptcy Risk: Solvency Showdown
Blackstone’s Altman Z-Score (4.66) places it firmly in the safe zone, while Invesco’s low score (0.96) signals distress. This stark delta implies Blackstone is well-positioned to survive downturns, whereas Invesco faces significant bankruptcy risk in this cycle:
Financial Health: Quality of Operations
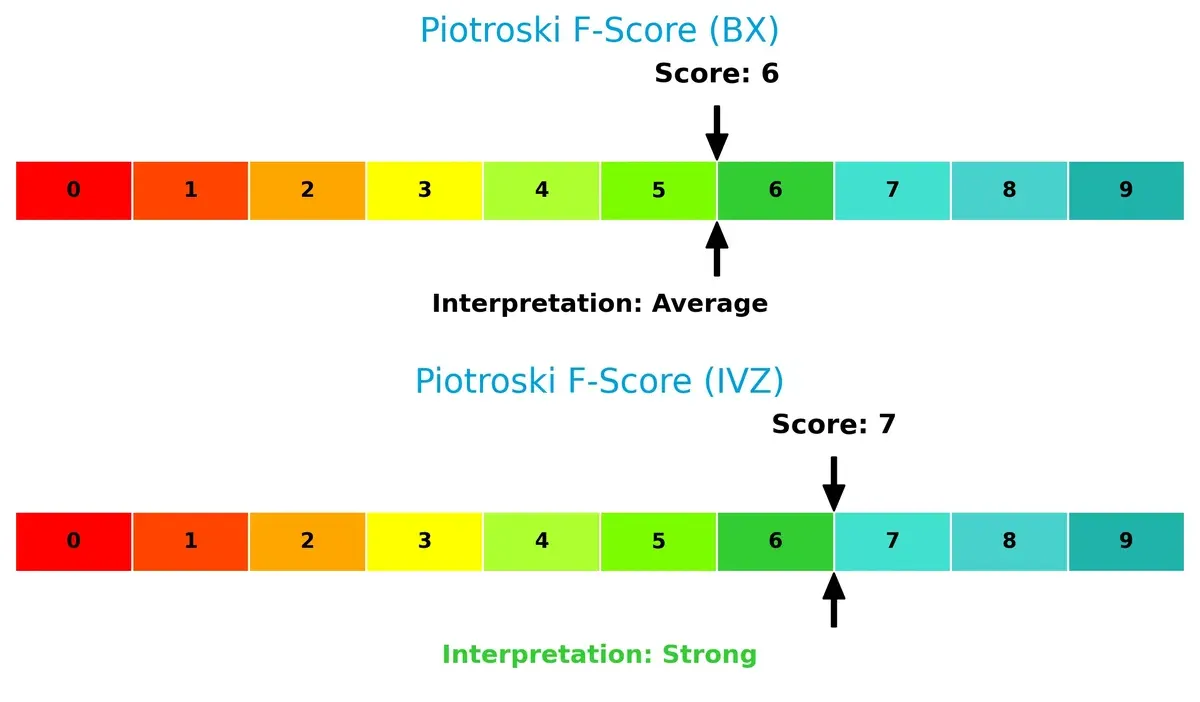
Invesco’s Piotroski F-Score of 7 indicates stronger internal financial health than Blackstone’s 6, suggesting more resilient operations despite its distress signals. Blackstone’s average score reveals some red flags in operational metrics relative to Invesco:
How are the two companies positioned?
This section dissects the operational DNA of BX and IVZ by comparing their revenue distribution and internal strengths and weaknesses. The goal is to confront their economic moats and identify which model offers the most resilient, sustainable competitive advantage today.
Revenue Segmentation: The Strategic Mix
This comparison dissects how Blackstone Inc. and Invesco Ltd. diversify their income streams and highlights their primary sector bets:
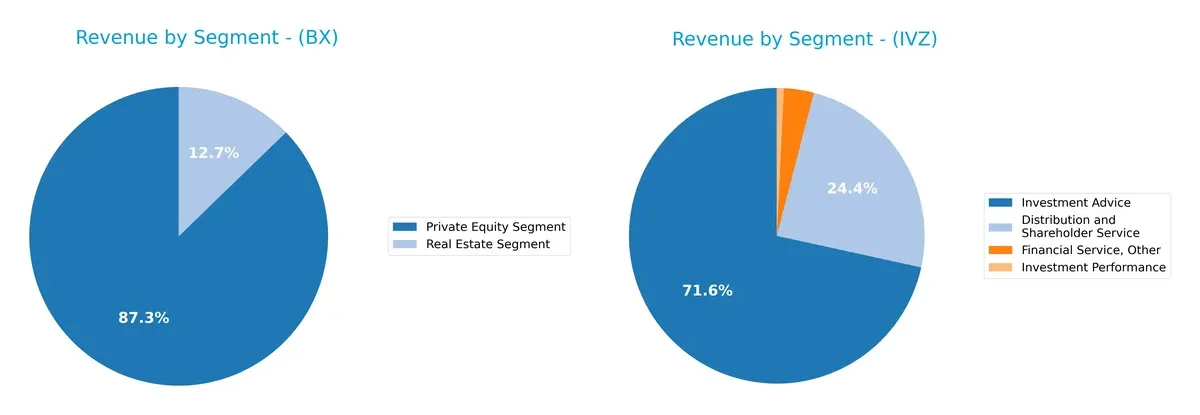
Blackstone pivots around Private Equity with $1.39B and a smaller Real Estate segment at $203M in 2024, showing moderate concentration risk. Invesco dwarfs Blackstone in Investment Advice at $4.34B, anchoring its revenue with Distribution and Shareholder Service at $1.48B, reflecting a more diversified asset management ecosystem. Blackstone’s reliance on fewer segments signals higher exposure to market cycles in private assets.
Strengths and Weaknesses Comparison
This table compares the strengths and weaknesses of Blackstone Inc. and Invesco Ltd.:
Blackstone Inc. Strengths
- Diversified revenue streams across Private Equity, Real Estate, Credit, and Hedge Funds
- Favorable net margin at 21.83%
- Low debt-to-assets ratio with strong interest coverage at 14.12
- Consistent dividend yield around 3.04%
Invesco Ltd. Strengths
- Broad global presence with substantial revenues from Americas, EMEA, Asia
- Favorable price-to-book and price-to-earnings ratios despite negative net margin
- Maintains dividend yield near 3.18%
- Diverse financial services including Distribution and Shareholder Service
Blackstone Inc. Weaknesses
- Unfavorable return on equity and invested capital at 0%
- Poor liquidity ratios with zero current and quick ratios
- High price-to-earnings ratio at 39.87 signals possible overvaluation
- Asset turnover ratios unavailable, limiting operational efficiency insight
Invesco Ltd. Weaknesses
- Negative net margin at -11.39% indicating profitability challenges
- Unfavorable return on equity and invested capital at 0%
- Negative interest coverage at -6.63 signals financial stress
- Weak liquidity with zero current and quick ratios
Blackstone demonstrates strength in diversified revenue and solid profitability metrics but faces liquidity and valuation concerns. Invesco shows broad geographic reach and valuation strengths, yet struggles with profitability and financial stability. These contrasts highlight differing strategic challenges each company must address moving forward.
The Moat Duel: Analyzing Competitive Defensibility
A structural moat is the sole barrier protecting long-term profits from competitive erosion. Let’s dissect the unique moats of two asset managers:
Blackstone Inc.: Diversified Alternative Asset Moat
Blackstone’s moat stems from its broad alternative asset portfolio and strong brand. This translates into high gross margins (86%) and stable EBIT margins (52%). Growth in private equity and real estate deepens its competitive edge in 2026.
Invesco Ltd.: Public Market Scale and Distribution Moat
Invesco relies on scale in public equity and fixed income funds, contrasting Blackstone’s alternatives focus. However, its negative EBIT and net margins signal weaker pricing power. Expansion into ETFs and international markets offers growth but also exposes it to margin pressure.
Alternatives Depth vs. Public Market Breadth
Blackstone’s diverse alternatives portfolio creates a deeper moat with superior profitability and margin stability. Invesco’s moat is narrower, challenged by weaker margins and slower growth. Blackstone stands better poised to defend market share amid rising competition.
Which stock offers better returns?
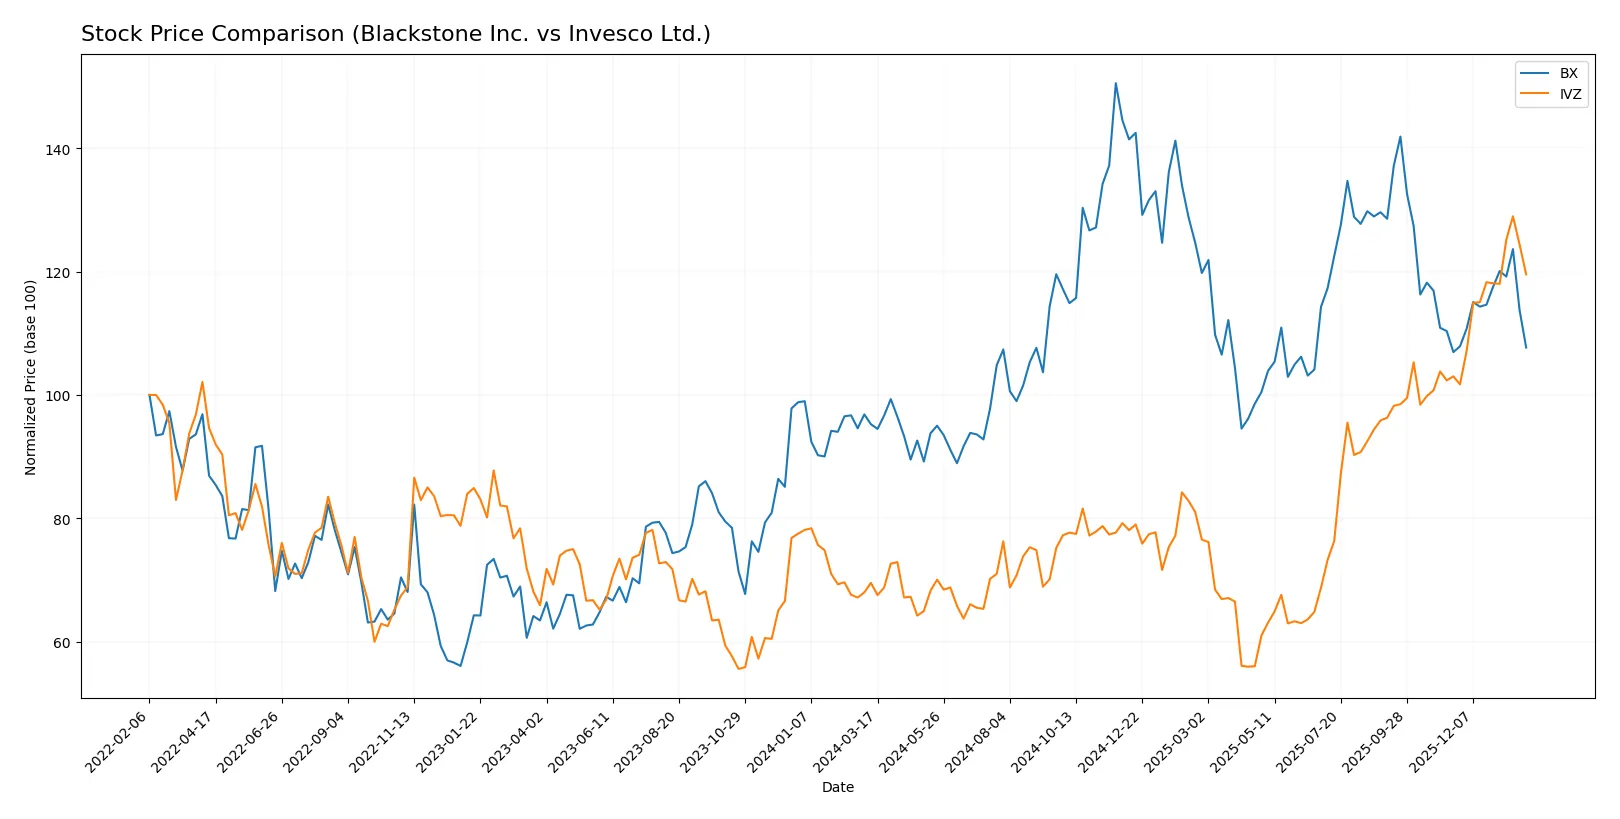
The past year shows distinct price movements for Blackstone Inc. and Invesco Ltd., with Invesco demonstrating stronger gains and higher buyer dominance.
Trend Comparison
Blackstone Inc. (BX) delivered a 13.04% price increase over 12 months, confirming a bullish trend with accelerating momentum and significant volatility (20.31 std deviation).
Invesco Ltd. (IVZ) outperformed with a 71.85% rise over the same period, also bullish and accelerating but with lower volatility (3.99 std deviation), reflecting steadier gains.
IVZ’s stock clearly outpaces BX in market performance, showing stronger returns and more dominant buyer activity throughout the year.
Target Prices
Analysts present a cautiously optimistic consensus on Blackstone Inc. and Invesco Ltd.
| Company | Target Low | Target High | Consensus |
|---|---|---|---|
| Blackstone Inc. | 164 | 215 | 179.83 |
| Invesco Ltd. | 24 | 34.5 | 29.8 |
The consensus target prices for both firms exceed current market prices, signaling upside potential. Blackstone’s premium targets reflect its strong asset management franchise versus Invesco’s more modest projections.

Don’t Let Luck Decide Your Entry Point
Optimize your entry points with our advanced ProRealTime indicators. You’ll get efficient buy signals with precise price targets for maximum performance. Start outperforming now!
How do institutions grade them?
The following tables summarize recent institutional grades for Blackstone Inc. and Invesco Ltd.:
Blackstone Inc. Grades
This table shows the latest grades from major financial institutions for Blackstone Inc.:
| Grading Company | Action | New Grade | Date |
|---|---|---|---|
| TD Cowen | Maintain | Buy | 2026-01-30 |
| JP Morgan | Maintain | Neutral | 2026-01-30 |
| Citizens | Maintain | Market Outperform | 2026-01-30 |
| Barclays | Maintain | Equal Weight | 2026-01-30 |
| UBS | Maintain | Neutral | 2026-01-13 |
Invesco Ltd. Grades
This table presents recent institutional grades for Invesco Ltd.:
| Grading Company | Action | New Grade | Date |
|---|---|---|---|
| Goldman Sachs | Maintain | Neutral | 2026-01-28 |
| Barclays | Maintain | Equal Weight | 2026-01-28 |
| RBC Capital | Maintain | Outperform | 2026-01-28 |
| Argus Research | Maintain | Buy | 2026-01-28 |
| JP Morgan | Maintain | Neutral | 2026-01-20 |
| Deutsche Bank | Upgrade | Buy | 2025-12-17 |
Which company has the best grades?
Invesco Ltd. holds a broader range of positive upgrades and outperform ratings, signaling stronger institutional conviction. Blackstone Inc. maintains steady but more neutral-to-equal weight grades. This contrast could influence investor sentiment and portfolio positioning.
Risks specific to each company
The following categories identify the critical pressure points and systemic threats facing both firms in the challenging 2026 market environment:
1. Market & Competition
Blackstone Inc.
- Strong market presence in alternative asset management but faces intense competition from private equity and hedge fund firms.
Invesco Ltd.
- Competes mainly in retail and institutional asset management with pressure from low-cost ETFs and active management underperformance.
2. Capital Structure & Debt
Blackstone Inc.
- Favorable debt metrics with solid interest coverage (14.12x), indicating manageable leverage risk.
Invesco Ltd.
- Weak interest coverage (-6.63x) signals financial stress and higher default risk.
3. Stock Volatility
Blackstone Inc.
- Beta of 1.75 suggests higher-than-market volatility, typical for asset managers sensitive to economic cycles.
Invesco Ltd.
- Beta of 1.63 also reflects elevated volatility, but slightly lower than Blackstone’s.
4. Regulatory & Legal
Blackstone Inc.
- Subject to complex regulations in multiple jurisdictions due to global alternative investments.
Invesco Ltd.
- Faces regulatory scrutiny in retail and institutional markets, including compliance challenges from evolving fund regulations.
5. Supply Chain & Operations
Blackstone Inc.
- Diverse global operations with operational risk in managing multiple asset classes and geographies.
Invesco Ltd.
- Operational complexity from managing diverse public and private funds, exposing it to technology and client retention risks.
6. ESG & Climate Transition
Blackstone Inc.
- Increasing exposure to ESG risks but actively investing in green energy and sustainable assets.
Invesco Ltd.
- ESG integration improving but lagging behind peers, which may impact investor appeal in 2026.
7. Geopolitical Exposure
Blackstone Inc.
- Significant exposure to Asia, Europe, and Latin America, subject to geopolitical tensions and market instability.
Invesco Ltd.
- Primarily US-focused with some exposure to Bermuda and international markets, less diversified geopolitically.
Which company shows a better risk-adjusted profile?
Blackstone’s most impactful risk is its exposure to intense competition in alternative assets but offset by strong capital structure and diversification. Invesco’s critical risk lies in its strained financial health, highlighted by negative net margin and poor interest coverage. Blackstone’s Altman Z-Score (4.66) places it safely above distress risk, while Invesco’s score (0.96) signals financial distress. Therefore, Blackstone offers a superior risk-adjusted profile, underpinned by robust financial stability despite market volatility.
Final Verdict: Which stock to choose?
Blackstone Inc. excels as a cash-generating powerhouse with a proven ability to sustain robust profitability. Its key point of vigilance lies in the declining return on invested capital, signaling caution on capital efficiency. This makes it suited for investors targeting aggressive growth with tolerance for cyclical shifts.
Invesco Ltd. offers a strategic moat through its recurring revenue model and cost discipline, providing a safety cushion relative to Blackstone. Despite weaker profitability metrics, its lower valuation and steady cash flow appeal to those seeking growth at a reasonable price with moderated risk.
If you prioritize strong cash flow and market leadership, Blackstone outshines by generating consistent returns despite some efficiency headwinds. However, if you seek stability with value upside, Invesco offers better safety and margin for error in turbulent markets. Each fits a distinct investor profile balancing growth and risk prudently.
Disclaimer: Investment carries a risk of loss of initial capital. The past performance is not a reliable indicator of future results. Be sure to understand risks before making an investment decision.
Go Further
I encourage you to read the complete analyses of Blackstone Inc. and Invesco Ltd. to enhance your investment decisions: