Home > Comparison > Financial Services > BX vs BEN
The strategic rivalry between Blackstone Inc. and Franklin Resources, Inc. shapes the financial services asset management landscape. Blackstone operates as a diversified alternative asset manager focused on private equity and opportunistic real estate investments. Franklin Resources, by contrast, is a traditional asset management firm emphasizing public equity and fixed income mutual funds. This analysis will reveal which business model offers superior risk-adjusted returns for a diversified portfolio in today’s evolving market environment.

Table of contents
Companies Overview
Blackstone Inc. and Franklin Resources, Inc. stand as influential pillars in the asset management landscape.
Blackstone Inc.: Alternative Asset Powerhouse
Blackstone dominates the alternative asset management sector, generating revenue through real estate, private equity, hedge funds, and credit. Its strategy in 2026 centers on opportunistic and core+ real estate investments across global markets. Blackstone’s diverse portfolio includes debt investments and growth equity projects, emphasizing large buyouts and multi-asset class strategies.
Franklin Resources, Inc.: Traditional Asset Manager
Franklin Resources focuses on traditional public equity and fixed income asset management. It primarily earns from mutual fund launches targeting individuals and institutions worldwide. In 2026, Franklin emphasizes expanding its multi-asset offerings and strengthening global distribution, maintaining a broad client base including pension plans and trusts.
Strategic Collision: Similarities & Divergences
Both firms compete in asset management but diverge sharply in philosophy. Blackstone pursues a closed ecosystem with alternative assets and private equity, while Franklin follows an open, public-market mutual fund model. Their primary battleground is market share in institutional and retail investments. Blackstone offers high-growth, complex strategies; Franklin delivers steady, diversified public market exposure.
Income Statement Comparison
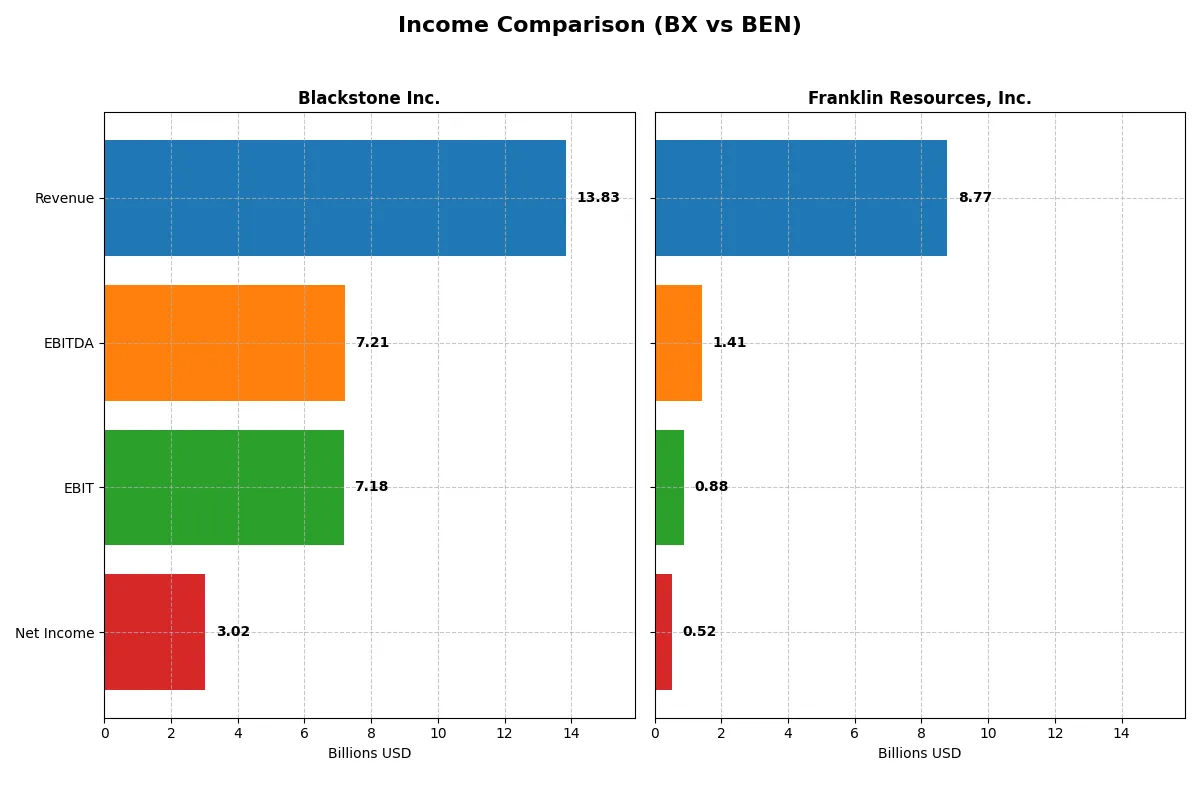
This data dissects the core profitability and scalability of both corporate engines to reveal who dominates the bottom line:
| Metric | Blackstone Inc. (BX) | Franklin Resources, Inc. (BEN) |
|---|---|---|
| Revenue | 13.8B | 8.8B |
| Cost of Revenue | 1.9B | 1.7B |
| Operating Expenses | 4.7B | 6.4B |
| Gross Profit | 11.9B | 7.0B |
| EBITDA | 7.2B | 1.4B |
| EBIT | 7.2B | 882M |
| Interest Expense | 508M | 95M |
| Net Income | 3.0B | 525M |
| EPS | 3.88 | 0.91 |
| Fiscal Year | 2025 | 2025 |
Income Statement Analysis: The Bottom-Line Duel
This income statement comparison exposes each firm’s core efficiency and profitability amid evolving market conditions.
Blackstone Inc. Analysis
Blackstone’s revenue climbed from $7.4B in 2023 to $13.8B in 2025, showing strong top-line momentum. Its gross margin stays robust above 86%, while net margin hovers near 22%, reflecting tight cost controls. The 2025 net income surged to $3B, boosted by efficient expense management and expanding EBITDA, signaling resilient operational strength.
Franklin Resources, Inc. Analysis
Franklin Resources delivered steady revenue growth from $7.8B in 2023 to $8.8B in 2025, with a stable gross margin around 80%. Net margin remains modest at about 6%, indicating higher operating costs relative to sales. The 2025 net income of $525M reflects moderate profitability, tempered by increased expenses and weaker EBIT, highlighting margin pressure despite revenue gains.
Margin Leadership vs. Steady Scale
Blackstone dominates with superior margins and accelerating earnings, outpacing Franklin in absolute net income and profitability ratios. Franklin’s stable revenue and moderate margin improvements appeal to conservative profiles, but Blackstone’s efficiency and higher returns present a more compelling growth and profitability equation for investors seeking robust bottom-line performance.
Financial Ratios Comparison
These vital ratios act as a diagnostic tool to expose the underlying fiscal health, valuation premiums, and capital efficiency of the companies analyzed:
| Ratios | Blackstone Inc. (BX) | Franklin Resources, Inc. (BEN) |
|---|---|---|
| ROE | 33.8% (2024) | 4.3% (2025) |
| ROIC | 12.5% (2024) | 1.4% (2025) |
| P/E | 47.6 (2024) | 22.7 (2025) |
| P/B | 16.1 (2024) | 1.0 (2025) |
| Current Ratio | 0.0 (2024) | 2.7 (2025) |
| Quick Ratio | 0.0 (2024) | 2.7 (2025) |
| D/E | 1.50 (2024) | 1.10 (2025) |
| Debt-to-Assets | 28.3% (2024) | 41.1% (2025) |
| Interest Coverage | 14.6 (2024) | 6.4 (2025) |
| Asset Turnover | 0.26 (2024) | 0.27 (2025) |
| Fixed Asset Turnover | 8.5 (2024) | 5.1 (2025) |
| Payout ratio | 159% (2024) | 130% (2025) |
| Dividend yield | 3.3% (2024) | 5.7% (2025) |
| Fiscal Year | 2024 | 2025 |
Efficiency & Valuation Duel: The Vital Signs
Ratios act as a company’s DNA, unveiling hidden risks and operational strengths that raw numbers often obscure in financial analysis.
Blackstone Inc.
Blackstone exhibits a strong net margin of 21.8%, signaling solid profitability, but its ROE and ROIC are unavailable, raising questions about capital efficiency. The P/E ratio of 39.9 suggests an expensive valuation compared to the market average. A 3.04% dividend yield supports steady shareholder returns, reflecting confidence in cash flow distribution.
Franklin Resources, Inc.
Franklin Resources posts a modest net margin of 6.0% and a lower ROE of 4.35%, indicating less robust profitability and capital returns. Its P/E ratio at 22.7 reflects a more reasonable valuation. The firm delivers a 5.75% dividend yield, emphasizing income distribution over aggressive reinvestment or growth strategies.
Premium Valuation vs. Income Stability
Blackstone trades at a premium with strong profit margins but lacks clarity on return metrics, increasing risk. Franklin Resources offers a more balanced valuation with consistent dividend income. Investors seeking growth may lean toward Blackstone, while those prioritizing income stability might prefer Franklin Resources.
Which one offers the Superior Shareholder Reward?
Blackstone (BX) and Franklin Resources (BEN) present contrasting distribution strategies. BX yields around 3%, with payout ratios exceeding 120%, indicating heavy dividend commitment but potential strain on free cash flow. BX’s buybacks are aggressive, fueling total returns alongside dividends. BEN offers a higher dividend yield near 5-6%, with payout ratios mostly below 150%, supported by steady free cash flow. BEN’s buyback activity appears more moderate but consistent. BX’s high leverage and payout ratio pose sustainability risks, while BEN’s disciplined capital allocation suggests steadier long-term value. I find BEN offers a more balanced and sustainable shareholder reward profile in 2026.
Comparative Score Analysis: The Strategic Profile
The radar chart reveals the fundamental DNA and trade-offs of Blackstone Inc. and Franklin Resources, Inc., highlighting their core financial strengths and weaknesses:
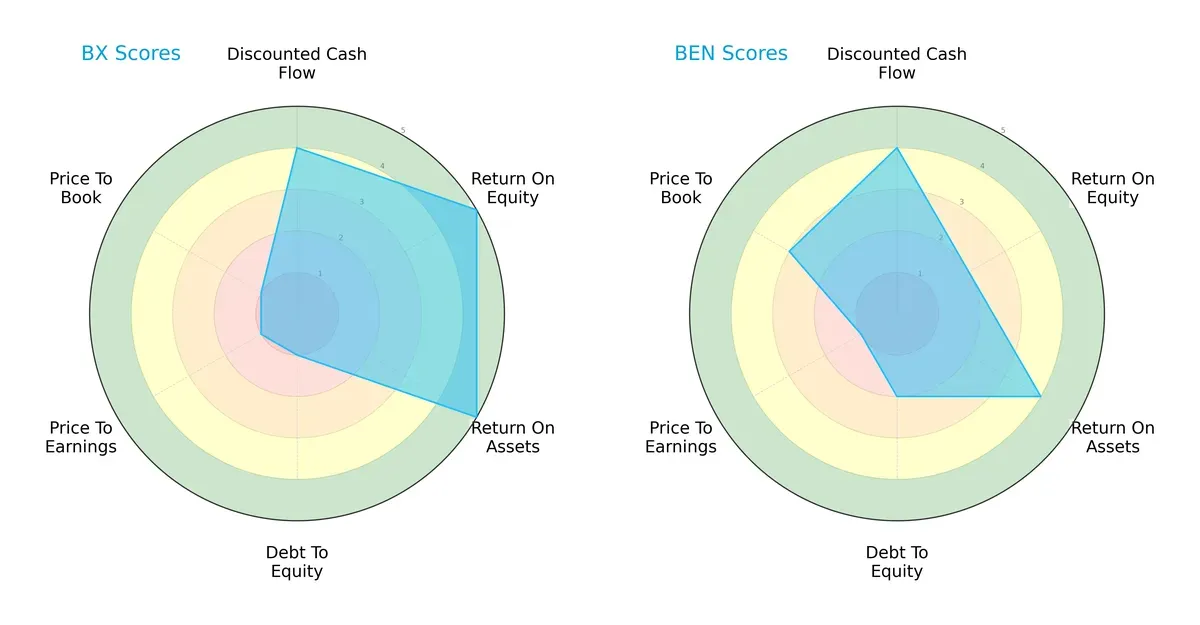
Blackstone shows superior profitability metrics with very favorable ROE and ROA scores of 5 each, compared to Franklin’s moderate 2 and favorable 4. However, Blackstone’s balance sheet is stretched, scoring 1 on debt-to-equity versus Franklin’s moderate 2. Valuation metrics strongly favor Franklin, which scores a moderate 3 on price-to-book, while Blackstone scores a very unfavorable 1 on all valuation ratios. Overall, Blackstone relies on operational efficiency but carries higher financial risk, whereas Franklin presents a more balanced financial profile.
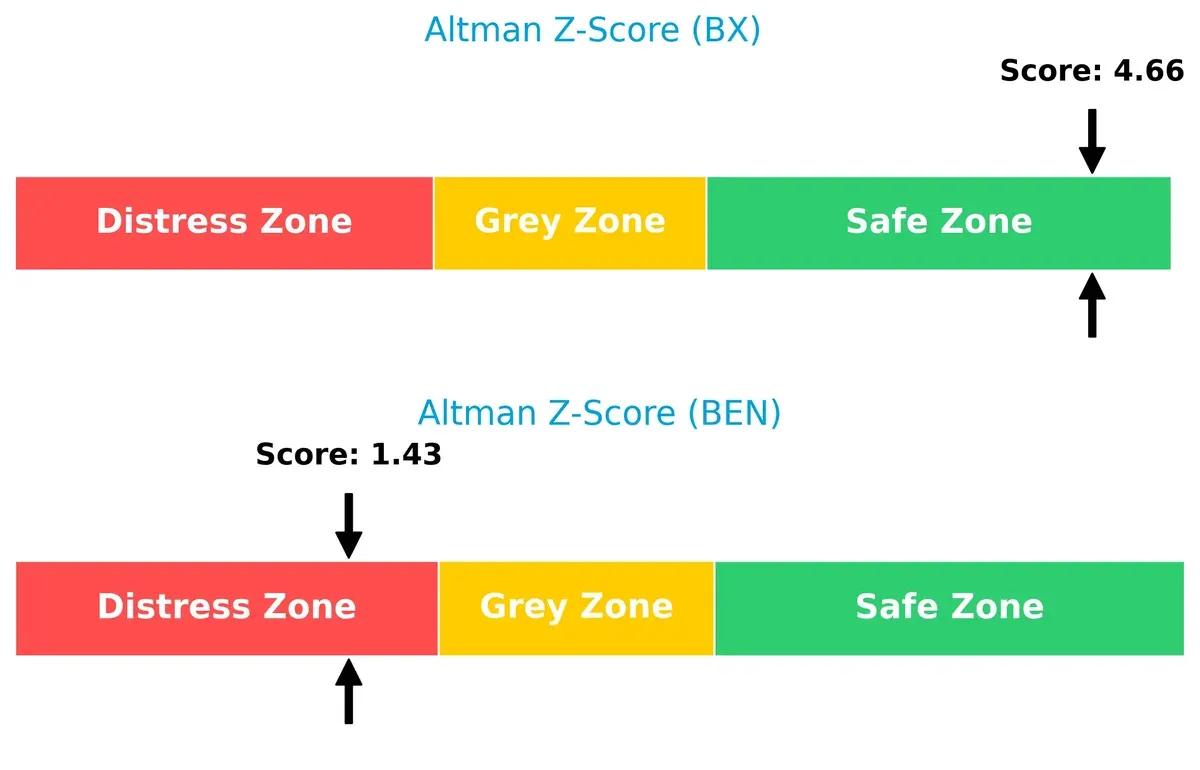
Bankruptcy Risk: Solvency Showdown
Blackstone’s Altman Z-Score of 4.66 places it firmly in the safe zone, signaling strong long-term solvency. Franklin’s score of 1.43 falls in the distress zone, raising red flags for financial distress and bankruptcy risk in this cycle:
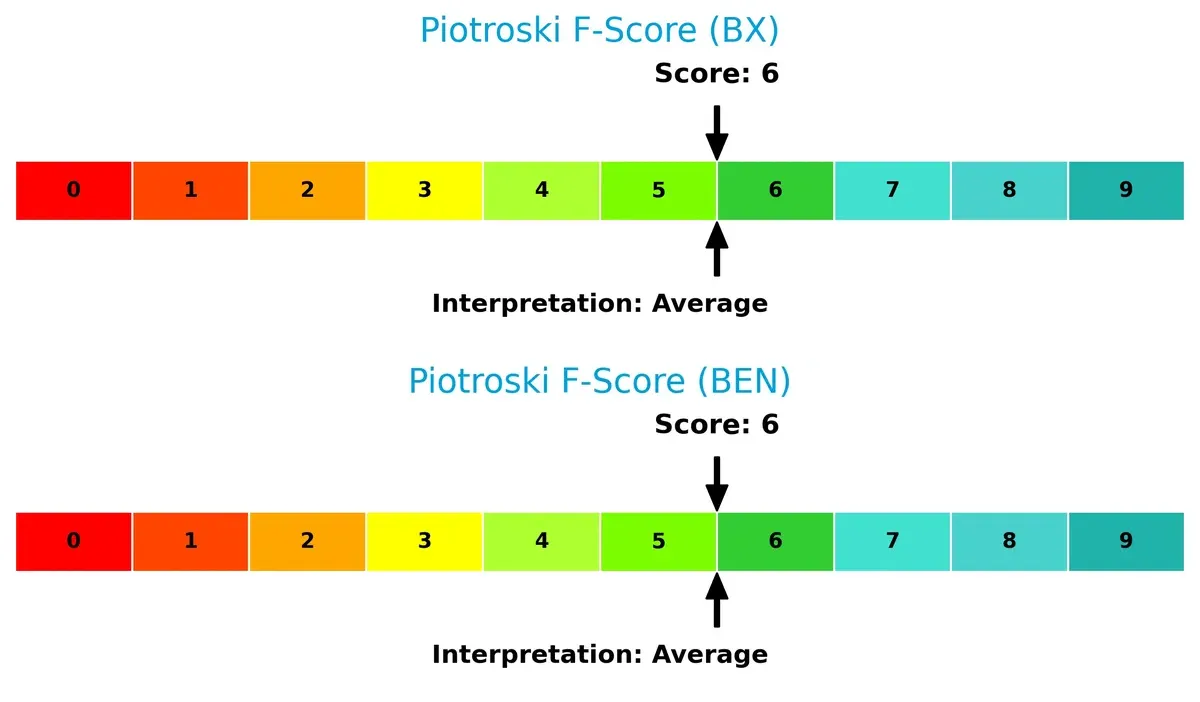
Financial Health: Quality of Operations
Both firms score 6 on the Piotroski F-Score, indicating average financial health. Neither shows acute red flags, but neither achieves peak operational strength either, suggesting room for improvement in internal financial metrics:
How are the two companies positioned?
This section dissects BX and BEN’s operational DNA by comparing revenue distribution and internal strengths and weaknesses. The goal is to confront their economic moats and identify which model offers the most resilient competitive advantage today.
Revenue Segmentation: The Strategic Mix
This visual comparison dissects how Blackstone Inc. and Franklin Resources, Inc. diversify their income streams and where their primary sector bets lie:
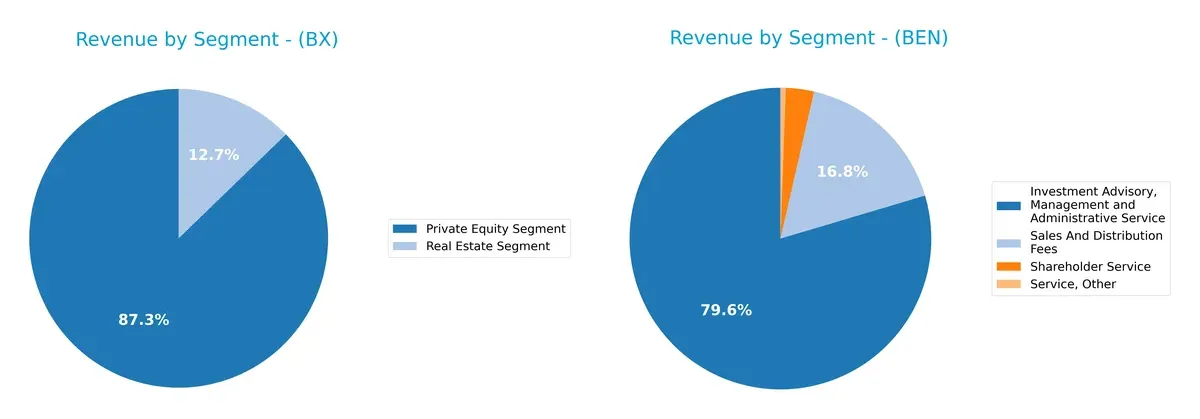
Blackstone anchors revenue in Private Equity with $1.39B (2024), supported modestly by Real Estate at $203M, showing moderate diversification. Franklin Resources pivots heavily on Investment Advisory, Management, and Administrative Service, generating $6.82B (2024), dwarfing other segments like Sales and Distribution Fees at $1.38B. Blackstone’s mix suggests exposure to market cycles in alternative assets, while Franklin’s concentration reflects steady fee-based asset management but carries client retention risk.
Strengths and Weaknesses Comparison
This table compares the strengths and weaknesses of Blackstone Inc. and Franklin Resources, Inc.:
Blackstone Inc. Strengths
- Diversified revenue across Private Equity, Real Estate, Credit, Hedge Funds
- Favorable net margin at 21.83%
- Strong interest coverage ratio at 14.12
- Conservative debt-to-assets ratio at 0%
- Dividend yield of 3.04% supports shareholder returns
Franklin Resources, Inc. Strengths
- Favorable weighted average cost of capital at 6.7%
- Healthy current and quick ratios at 2.71 each
- Strong fixed asset turnover at 5.12
- Favorable price-to-book ratio near 1.0
- Global revenue presence across Americas, Asia Pacific, and Europe
Blackstone Inc. Weaknesses
- Unavailable WACC data limits capital efficiency analysis
- Unfavorable ROE and ROIC at 0% raise profitability concerns
- Unfavorable P/E ratio at 39.87 suggests possible overvaluation
- Low current and quick ratios signal liquidity risk
- Poor asset and fixed asset turnover point to operational inefficiency
Franklin Resources, Inc. Weaknesses
- Unfavorable debt-to-equity at 1.1 increases leverage risk
- Lower net margin at 5.98% compared to peers
- ROE and ROIC remain unfavorable, indicating weak returns
- Moderate dividend yield at 5.75% marked neutral
- Asset turnover at 0.27 indicates low asset utilization
Both companies show balanced strengths but also distinct weaknesses. Blackstone excels in profitability and low leverage but struggles with liquidity and operational efficiency. Franklin Resources demonstrates solid liquidity and capital cost management but faces challenges in profitability and leverage. These factors will influence each firm’s strategic focus on improving returns and operational metrics.
The Moat Duel: Analyzing Competitive Defensibility
A structural moat is the only reliable shield against the relentless erosion of long-term profits by competitors. Let’s examine the distinct moats of Blackstone and Franklin Resources:
Blackstone Inc.: Opportunistic Asset Mastery
Blackstone’s moat stems from its diversified alternative asset platform and scale-driven cost advantage. Its financials show high gross (86%) and EBIT (52%) margins, reflecting robust operational control. In 2026, expansion into emerging markets and green energy could deepen its competitive edge.
Franklin Resources, Inc.: Traditional Asset Management Under Pressure
Franklin relies on brand reputation and global distribution, but its narrower moat contrasts Blackstone’s scale. EBIT margin at 10% signals weaker profitability, and a steeply declining ROIC warns of value destruction. Growth opportunities lie in expanding Asia-Pacific reach, yet margin pressures persist.
Scale and Diversification vs. Brand and Reach: Who’s Moat Holds?
Blackstone’s wider moat benefits from scale, diversification, and margin dominance, while Franklin struggles with shrinking returns and profitability. I see Blackstone better positioned to defend profits amid rising competition and market shifts.
Which stock offers better returns?
Over the past 12 months, Blackstone Inc. gained 13.04%, showing accelerating bullish momentum, while Franklin Resources, Inc. declined 5.1%, despite recent upward acceleration since November 2025.
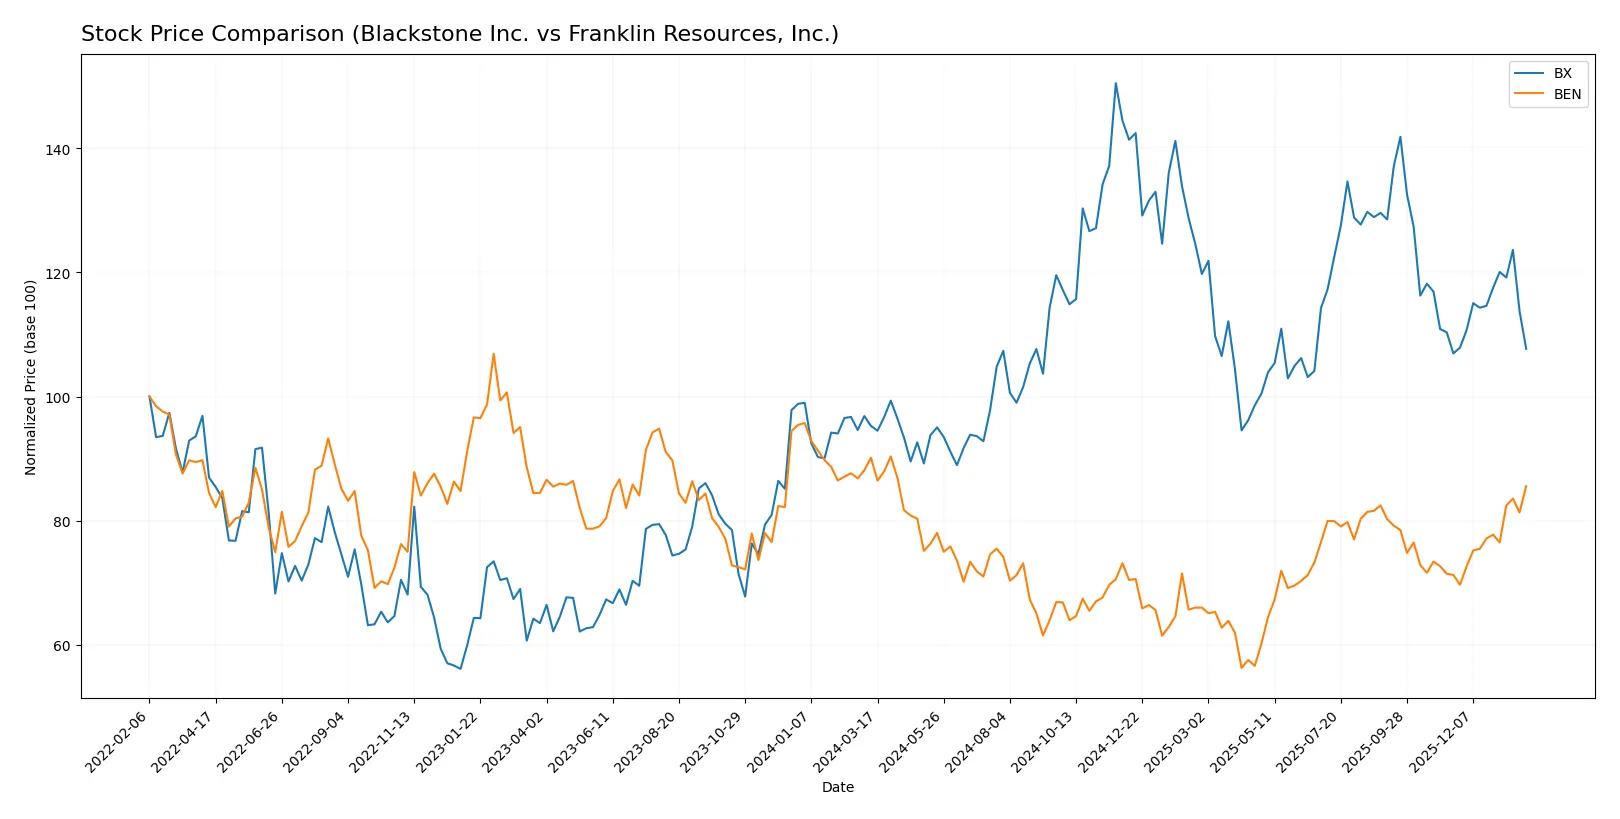
Trend Comparison
Blackstone Inc. exhibits a 13.04% price increase over the past year with accelerating bullish momentum and notable volatility (20.31 std dev). Its highest price reached 199.05, lowest 117.62. Franklin Resources, Inc. shows a 5.1% decline over the year, marking a bearish trend with accelerating downside but low volatility (2.3 std dev). Its price ranged between 17.51 and 28.11. Blackstone outperformed Franklin Resources during the period, delivering the highest market return with clear bullish acceleration versus Franklin’s overall bearish trend.
Target Prices
Analysts present a mixed but generally optimistic target consensus for these asset management firms.
| Company | Target Low | Target High | Consensus |
|---|---|---|---|
| Blackstone Inc. | 164 | 215 | 179.83 |
| Franklin Resources, Inc. | 25 | 25 | 25 |
Blackstone’s target consensus at 179.83 suggests a 26% upside from its current 142.42 price, reflecting strong analyst confidence. Franklin Resources’ fixed target of 25 implies a slight downside versus its current 26.62, signaling cautious market sentiment.

Don’t Let Luck Decide Your Entry Point
Optimize your entry points with our advanced ProRealTime indicators. You’ll get efficient buy signals with precise price targets for maximum performance. Start outperforming now!
How do institutions grade them?
Blackstone Inc. Grades
The following table summarizes recent institutional grades for Blackstone Inc.:
| Grading Company | Action | New Grade | Date |
|---|---|---|---|
| Citizens | Maintain | Market Outperform | 2026-01-30 |
| TD Cowen | Maintain | Buy | 2026-01-30 |
| JP Morgan | Maintain | Neutral | 2026-01-30 |
| Barclays | Maintain | Equal Weight | 2026-01-30 |
| TD Cowen | Maintain | Buy | 2026-01-14 |
| UBS | Maintain | Neutral | 2026-01-13 |
| Barclays | Maintain | Equal Weight | 2026-01-09 |
| Barclays | Maintain | Equal Weight | 2025-12-12 |
| JP Morgan | Maintain | Neutral | 2025-10-24 |
| JMP Securities | Maintain | Market Outperform | 2025-10-24 |
Franklin Resources, Inc. Grades
Here are the latest grades issued by major institutions for Franklin Resources, Inc.:
| Grading Company | Action | New Grade | Date |
|---|---|---|---|
| Barclays | Maintain | Underweight | 2026-01-15 |
| TD Cowen | Maintain | Buy | 2026-01-14 |
| Barclays | Maintain | Underweight | 2025-12-12 |
| JP Morgan | Maintain | Neutral | 2025-11-10 |
| Barclays | Maintain | Underweight | 2025-10-21 |
| Evercore ISI Group | Maintain | Underperform | 2025-10-09 |
| B of A Securities | Maintain | Underperform | 2025-10-02 |
| Morgan Stanley | Maintain | Underweight | 2025-08-12 |
| JP Morgan | Maintain | Neutral | 2025-08-04 |
| Barclays | Maintain | Underweight | 2025-08-04 |
Which company has the best grades?
Blackstone Inc. holds consistently higher grades, including multiple “Buy” and “Market Outperform” ratings. Franklin Resources, Inc. mostly receives “Underweight” and “Underperform” grades. This divergence suggests stronger institutional confidence in Blackstone, possibly affecting investor sentiment and portfolio positioning.
Risks specific to each company
The following categories identify the critical pressure points and systemic threats facing both firms in the 2026 market environment:
1. Market & Competition
Blackstone Inc.
- Operates across diverse alternative asset classes, facing fierce competition in private equity and real estate globally.
Franklin Resources, Inc.
- Competes mainly in traditional asset management with pressure from passive funds and fee compression.
2. Capital Structure & Debt
Blackstone Inc.
- Strong interest coverage (14.12) but very unfavorable debt-to-equity metrics indicate high leverage risk.
Franklin Resources, Inc.
- Moderate debt-to-equity (1.1) with favorable liquidity ratios (current ratio 2.71) suggests better balance sheet management.
3. Stock Volatility
Blackstone Inc.
- Higher beta (1.75) signals elevated stock price volatility compared to market benchmarks.
Franklin Resources, Inc.
- Lower beta (1.47) indicates relatively less price fluctuation and volatility risk.
4. Regulatory & Legal
Blackstone Inc.
- Exposure to complex regulations across multiple jurisdictions in alternative asset segments.
Franklin Resources, Inc.
- Faces regulatory scrutiny primarily in public equity and mutual fund management.
5. Supply Chain & Operations
Blackstone Inc.
- Operations rely on global deal flow and asset management infrastructure, vulnerable to geopolitical and economic shifts.
Franklin Resources, Inc.
- Operational risks center on fund performance and client retention amid evolving investor preferences.
6. ESG & Climate Transition
Blackstone Inc.
- Invests in alternative energy and greenfield development, facing transition risks and opportunities in ESG integration.
Franklin Resources, Inc.
- ESG adoption lags peers, with pressure to enhance sustainable investment strategies.
7. Geopolitical Exposure
Blackstone Inc.
- Significant exposure to Asia, Europe, and Latin America markets, subject to geopolitical tensions and market instability.
Franklin Resources, Inc.
- Primarily US and India focused, with less direct exposure to volatile geopolitical regions.
Which company shows a better risk-adjusted profile?
Blackstone’s greatest risk lies in its high leverage, despite strong interest coverage. Franklin Resources faces valuation and regulatory pressures but maintains a healthier liquidity position. Franklin’s lower beta and stronger current ratios suggest a better risk-adjusted profile. Blackstone’s Altman Z-score in the safe zone contrasts sharply with Franklin’s distress zone, underlining financial stability concerns. The widening valuation gap and Blackstone’s unfavorable debt metrics justify cautious positioning.
Final Verdict: Which stock to choose?
Blackstone Inc. (BX) wields a formidable superpower in generating robust operating margins and strong earnings quality, making it a cash-generating powerhouse in the alternative asset management space. However, its high valuation multiples and some liquidity concerns serve as points of vigilance. BX suits investors targeting aggressive growth with a tolerance for valuation risk.
Franklin Resources, Inc. (BEN) benefits from a strategic moat rooted in stable asset management fees and a conservative capital structure. It offers a safer profile than BX, reflected in stronger liquidity ratios and less volatile price movements. BEN fits well within GARP portfolios that seek steady income with moderated growth expectations.
If you prioritize growth and can endure valuation premiums, Blackstone outshines with operational efficiency and scalable cash flows. However, if you seek relative stability and a more defensive stance, Franklin Resources offers better balance sheet resilience and income reliability. Each scenario caters to distinct investor profiles navigating 2026’s evolving market uncertainties.
Disclaimer: Investment carries a risk of loss of initial capital. The past performance is not a reliable indicator of future results. Be sure to understand risks before making an investment decision.
Go Further
I encourage you to read the complete analyses of Blackstone Inc. and Franklin Resources, Inc. to enhance your investment decisions: