Home > Comparison > Financial Services > BLK vs BK
The strategic rivalry between BlackRock, Inc. and The Bank of New York Mellon Corporation shapes the evolution of the financial services sector. BlackRock operates as a global asset management powerhouse focused on investment management and advisory services. In contrast, BNY Mellon emphasizes custody, clearing, and wealth management solutions. This analysis explores their distinct operational models to identify which firm presents the superior risk-adjusted opportunity for a diversified portfolio.

Table of contents
Companies Overview
BlackRock and Bank of New York Mellon stand as titans in asset management, shaping global financial markets.
BlackRock, Inc.: The Global Investment Powerhouse
BlackRock dominates as a public investment manager with $174B market cap. It earns primarily through managing diverse portfolios including equities, fixed income, and alternative assets. In 2026, BlackRock sharpens its focus on global risk management and real estate investments in Europe, emphasizing a blend of fundamental and quantitative strategies.
The Bank of New York Mellon Corporation: Custodian and Wealth Services Leader
BK serves as a major financial services provider with $84B market cap. Its revenue streams stem from custody, clearing, wealth management, and securities services. The company’s 2026 strategy centers on expanding integrated cash management solutions and enhancing technology-driven market services to support institutional and high-net-worth clients.
Strategic Collision: Similarities & Divergences
Both firms excel in asset management but diverge in approach. BlackRock pursues a direct investment vehicle model, focusing on portfolio management and product innovation. BK operates a more infrastructure-oriented business, excelling in custody and clearing services. Their primary battleground is institutional clients seeking comprehensive financial solutions. Investors face distinct profiles: BlackRock offers growth via active asset management; BK delivers steady income through service-oriented scale.
Income Statement Comparison
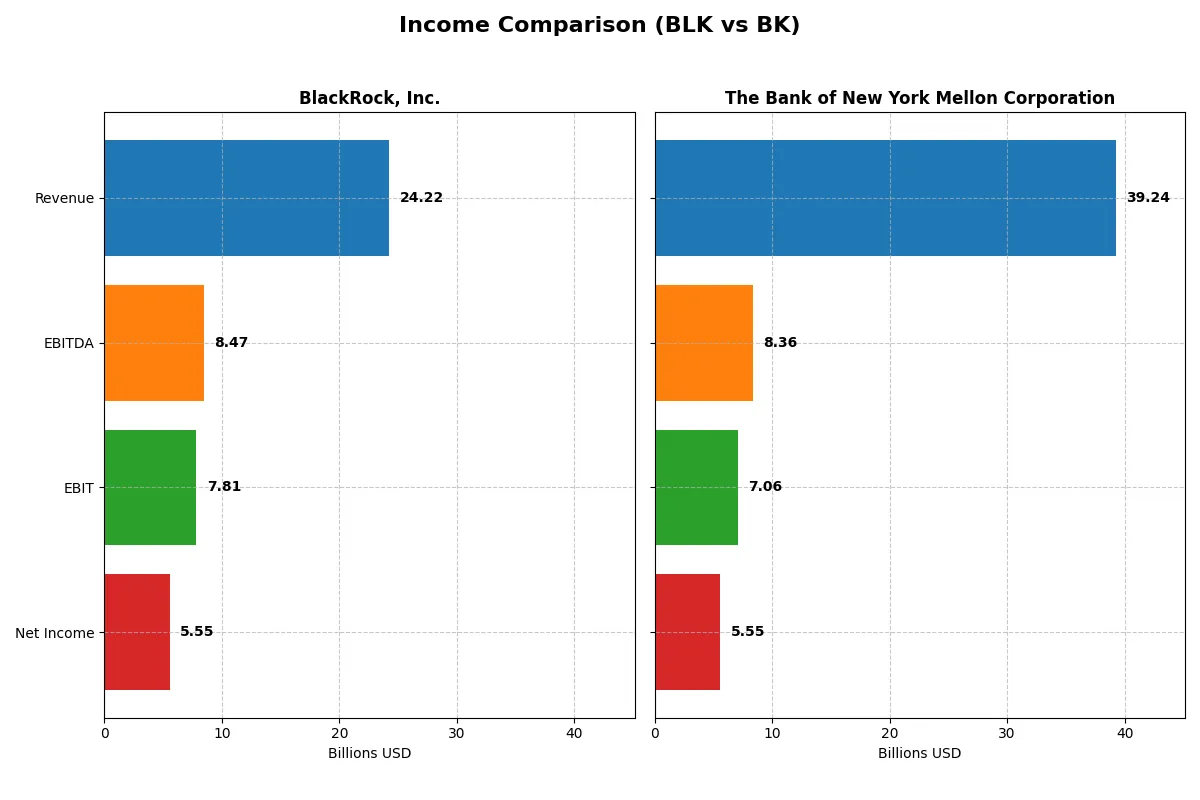
This data dissects the core profitability and scalability of both corporate engines to reveal who dominates the bottom line:
| Metric | BlackRock, Inc. (BLK) | The Bank of New York Mellon Corporation (BK) |
|---|---|---|
| Revenue | 24.2B | 39.2B |
| Cost of Revenue | 10.8B | 19.4B |
| Operating Expenses | 6.4B | 12.8B |
| Gross Profit | 13.4B | 19.9B |
| EBITDA | 8.5B | 8.4B |
| EBIT | 7.8B | 7.1B |
| Interest Expense | 706M | 20.7B |
| Net Income | 5.6B | 5.5B |
| EPS | 35.84 | 7.46 |
| Fiscal Year | 2025 | 2025 |
Income Statement Analysis: The Bottom-Line Duel
This income statement comparison will reveal which company runs its corporate engine with greater efficiency and sustainable profitability.
BlackRock, Inc. Analysis
BlackRock’s revenue climbed steadily from 17.9B in 2023 to 24.2B in 2025, reflecting solid top-line growth. Its gross margin remained strong at 55.5% in 2025, while net margin held at a healthy 22.9%. Despite a slight net income decline to 5.55B in 2025, BlackRock maintains impressive operational efficiency and a resilient earnings base.
The Bank of New York Mellon Corporation Analysis
Bank of New York Mellon posted higher revenue, peaking at 39.2B in 2025, but with a lower gross margin of 50.6%. Net income grew to 5.55B in 2025, boosted by a 20.7% EBIT increase and a 27.8% EPS surge over the past year. However, its interest expense ratio remains elevated at 52.7%, weighing on net margin efficiency.
Margin Strength vs. Revenue Expansion
BlackRock leads with superior margin control and stable profitability despite slower revenue growth. In contrast, Bank of New York Mellon shows robust revenue and earnings momentum but struggles with high interest costs that compress margins. For investors prioritizing margin quality and operational discipline, BlackRock’s profile stands out as more attractive.
Financial Ratios Comparison
These vital ratios act as a diagnostic tool to expose the underlying fiscal health, valuation premiums, and capital efficiency for the companies analyzed:
| Ratios | BlackRock, Inc. (BLK) | The Bank of New York Mellon Corporation (BK) |
|---|---|---|
| ROE | 13.41% (2024) | 12.52% (2025) |
| ROIC | 4.34% (2024) | 6.38% (2025) |
| P/E | 24.15 (2024) | 14.74 (2025) |
| P/B | 3.24 (2024) | 1.85 (2025) |
| Current Ratio | 16.40 (2024) | 0.70 (2025) |
| Quick Ratio | 16.40 (2024) | 0.70 (2025) |
| D/E | 0.30 (2024) | 0.76 (2025) |
| Debt-to-Assets | 10.26% (2024) | 7.17% (2025) |
| Interest Coverage | 14.08 (2024) | 0.34 (2025) |
| Asset Turnover | 0.15 (2024) | 0.08 (2025) |
| Fixed Asset Turnover | 7.78 (2024) | 10.96 (2025) |
| Payout ratio | 48.69% (2024) | 25.40% (2025) |
| Dividend yield | 2.02% (2024) | 1.72% (2025) |
| Fiscal Year | 2024 | 2025 |
Efficiency & Valuation Duel: The Vital Signs
Ratios act as a company’s DNA, unveiling hidden risks and operational strengths crucial for informed investment decisions.
BlackRock, Inc.
BlackRock shows a strong net margin at 22.93%, signaling operational efficiency. However, its 29.9 P/E ratio suggests the stock is stretched compared to sector averages. The company delivers a 1.95% dividend yield, balancing shareholder returns while reinvesting modestly in R&D at 3.3% of revenue, indicating measured growth focus.
The Bank of New York Mellon Corporation
Bank of New York Mellon posts a lower but favorable 14.14% net margin and a 14.74 P/E ratio, reflecting a more moderate valuation. Its 1.72% dividend yield supports income-oriented investors, while neutral ROE and ROIC imply stable profitability. The firm’s quick ratio of 0.7 flags liquidity concerns, a risk factor for operational resilience.
Valuation Stretch vs. Balanced Stability
BlackRock trades at a premium with superior margins but stretched valuation metrics. Bank of New York Mellon offers a more balanced valuation and stable profitability but shows liquidity risks. Investors seeking growth may lean toward BlackRock, while those favoring income stability might prefer Bank of New York Mellon.
Which one offers the Superior Shareholder Reward?
I compare BlackRock’s (BLK) and BNY Mellon’s (BK) shareholder return strategies through dividends and buybacks. BlackRock delivers a 2.0% dividend yield with a 49% payout ratio, backed by strong free cash flow coverage. It also maintains consistent, significant buybacks, enhancing total returns. BNY Mellon yields slightly more at 2.7% but with a lower payout ratio near 34%, reflecting restrained dividend commitment amid weak cash flow metrics. Its buyback activity lags, constrained by high leverage and weak operating cash flow. Historically, BlackRock’s balanced distribution and aggressive buybacks offer more sustainable, superior shareholder reward in 2026.
Comparative Score Analysis: The Strategic Profile
The radar chart reveals the fundamental DNA and trade-offs of BlackRock, Inc. and The Bank of New York Mellon Corporation:
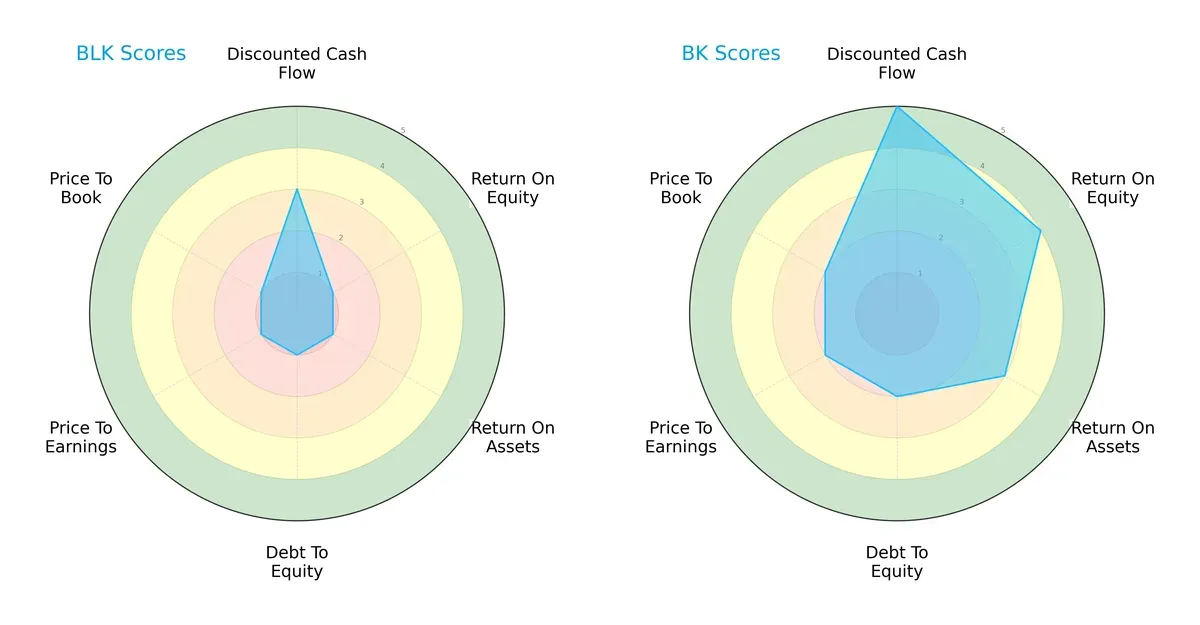
BlackRock shows a heavily skewed profile with very low scores in ROE, ROA, debt-to-equity, and valuation metrics, reflecting significant weaknesses. In contrast, Bank of New York Mellon offers a more balanced and healthier score distribution, excelling in discounted cash flow and profitability ratios. Bank of New York Mellon clearly relies on diversified strengths, while BlackRock depends on a moderate DCF score amid broad financial challenges.
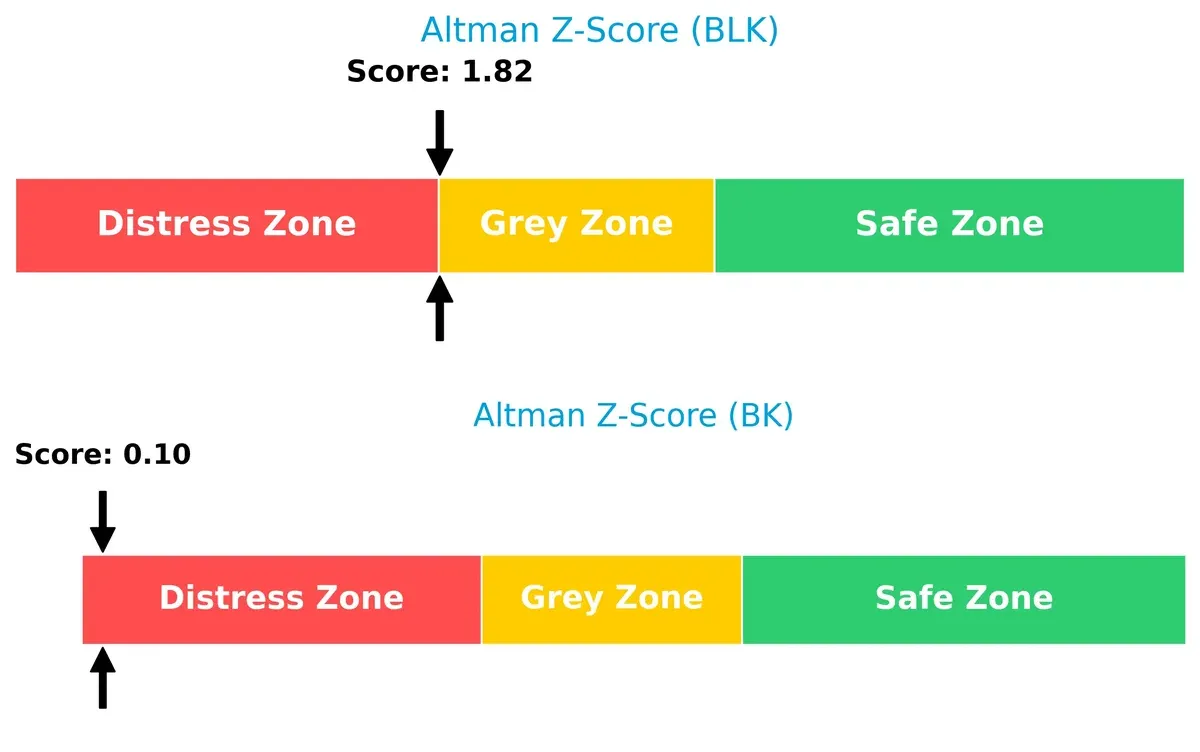
Bankruptcy Risk: Solvency Showdown
Bank of New York Mellon’s Altman Z-Score plunges into the distress zone, signaling elevated bankruptcy risk. BlackRock, barely in the grey zone, exhibits a more stable solvency outlook for long-term survival in this cycle:
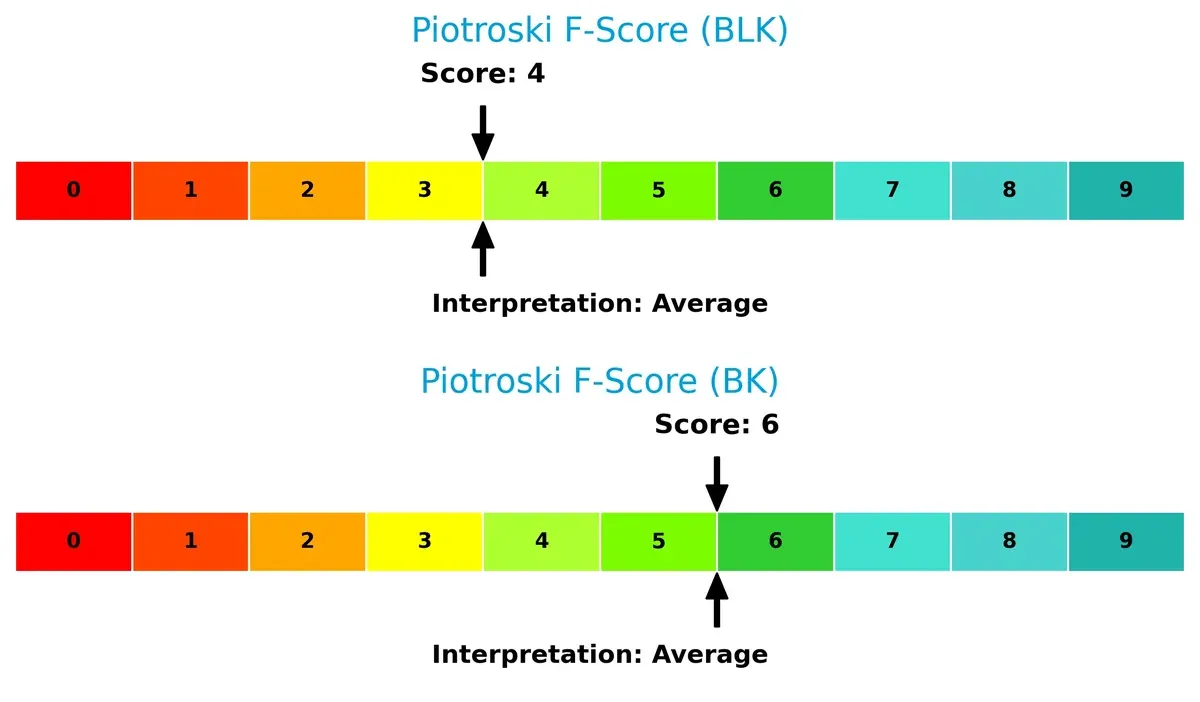
Financial Health: Quality of Operations
Both firms show average Piotroski F-Scores, with Bank of New York Mellon scoring 6 and BlackRock 4. This suggests Bank of New York Mellon maintains relatively stronger operational health, while BlackRock’s lower score hints at some internal red flags:
How are the two companies positioned?
This section dissects the operational DNA of BlackRock and BNY Mellon by comparing their revenue distribution and internal strengths and weaknesses. The goal is to confront their economic moats and identify which model offers the most resilient competitive advantage today.
Revenue Segmentation: The Strategic Mix
This visual comparison dissects how BlackRock, Inc. and The Bank of New York Mellon Corporation diversify their income streams and where their primary sector bets lie:
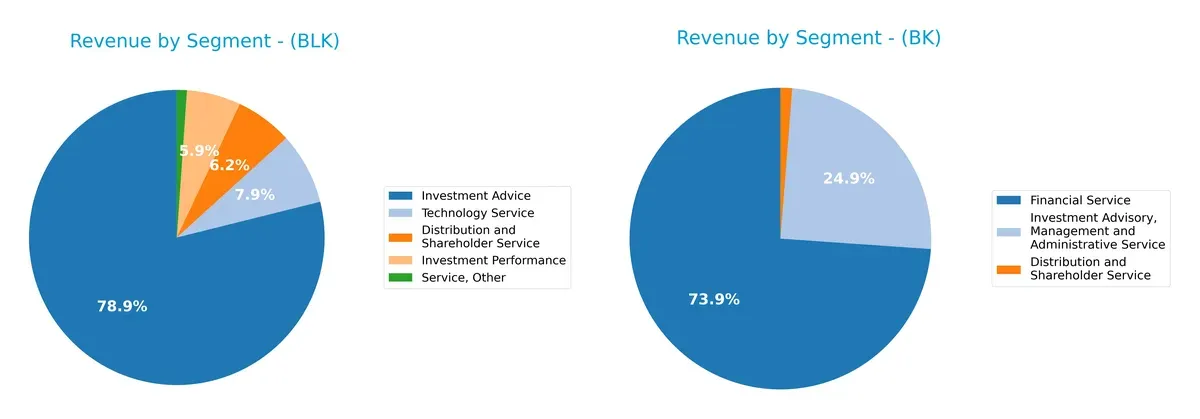
BlackRock anchors its revenue with $16.1B from Investment Advice, dwarfing other segments like Distribution and Shareholder Service at $1.27B. This signals a strong ecosystem lock-in around advisory services. In contrast, BNY Mellon shows a more diversified mix with $9.34B in Financial Service and $3.14B in Investment Advisory, suggesting balanced exposure but less dominance in any single segment. BlackRock’s heavy concentration heightens risk but leverages its advisory moat.
Strengths and Weaknesses Comparison
This table compares the Strengths and Weaknesses of BlackRock, Inc. and The Bank of New York Mellon Corporation:
BlackRock, Inc. Strengths
- Strong net margin at 22.93%
- Favorable debt to equity and debt to assets ratios
- High interest coverage ratio at 11.06
- Diverse revenue streams including investment advice and technology services
- Significant global presence with $13.4B Americas revenue
The Bank of New York Mellon Corporation Strengths
- Favorable net margin at 14.14%
- Positive fixed asset turnover at 10.96
- Favorable PE ratio at 14.74
- Diversified revenue including financial and investment advisory services
- Broad global footprint with $12.1B US revenue and significant EMEA and Asia Pacific presence
BlackRock, Inc. Weaknesses
- Unfavorable ROE and ROIC metrics at 0%
- Unavailable WACC data limiting cost of capital analysis
- Low liquidity ratios (current and quick ratio at 0)
- High PE ratio at 29.9 indicating possible overvaluation
- Unfavorable asset and fixed asset turnover
The Bank of New York Mellon Corporation Weaknesses
- Neutral ROE and ROIC, but with unfavorable WACC at 19.98%
- Low current and quick ratios at 0.7 indicating liquidity risk
- Low interest coverage ratio at 0.34
- Higher debt to equity ratio at 0.76 (neutral)
- Unfavorable asset turnover at 0.08
Both companies exhibit diversified revenue streams and strong global reach. BlackRock excels in profitability and debt management but shows liquidity and efficiency weaknesses. BNY Mellon maintains a balanced asset utilization and valuation but faces liquidity and cost of capital challenges. These factors shape their strategic priorities in financial management and growth.
The Moat Duel: Analyzing Competitive Defensibility
A structural moat shields long-term profits from relentless competitive pressure. Without it, earnings erode swiftly. Let’s dissect the moats of BlackRock and BNY Mellon:
BlackRock, Inc.: Intangible Asset Moat through Brand and Scale
BlackRock’s competitive edge stems from its unrivaled brand and scale in asset management. This manifests in stable, high margins and consistent revenue growth. In 2026, expansion in alternative assets and global markets could deepen its moat but rising competition threatens margin stability.
The Bank of New York Mellon Corporation: Operational Efficiency Moat
BNY Mellon relies on operational scale and technology-driven custody services, differing from BlackRock’s brand moat. Its growing ROIC and robust earnings growth show improving capital efficiency. The firm’s expanding fintech capabilities and global custody services offer upside but face margin pressure from rising interest expenses.
Brand Dominance vs. Operational Efficiency: The Moat Showdown
BlackRock’s intangible asset moat offers a wider competitive barrier, supported by strong market positioning and product diversity. BNY Mellon’s moat is narrower but deepening through efficiency gains. BlackRock remains better equipped to defend market share amid evolving industry dynamics in 2026.
Which stock offers better returns?
The past year shows strong upward momentum for both stocks, with notable price accelerations and contrasting volume trends, highlighting different trading dynamics.
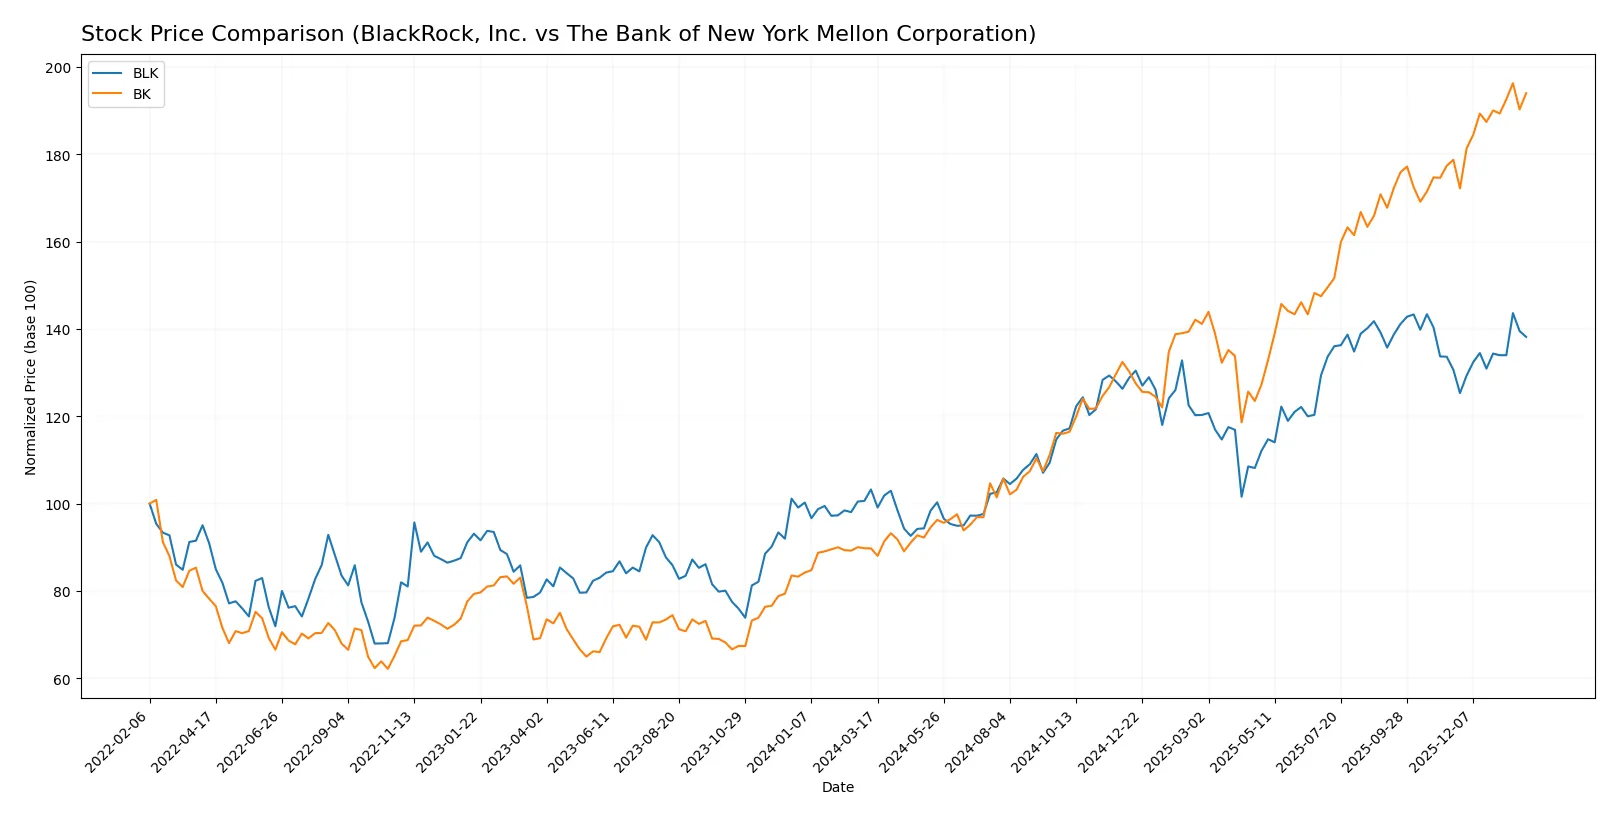
Trend Comparison
BlackRock, Inc. (BLK) shows a bullish trend with a 33.83% price increase over 12 months and accelerating gains. Prices peaked at 1,163 and bottomed at 750, reflecting high volatility.
The Bank of New York Mellon Corporation (BK) outperforms with a 116.19% gain over the same period, also accelerating. It exhibits lower volatility, ranging from 54 to 121 in price.
BK’s stock delivered the highest market performance, surpassing BLK’s gains by over 80 percentage points despite a decreasing volume trend.
Target Prices
Analysts project moderately bullish targets for BlackRock and BNY Mellon, indicating room for appreciation from current prices.
| Company | Target Low | Target High | Consensus |
|---|---|---|---|
| BlackRock, Inc. | 1,200 | 1,514 | 1,333.7 |
| The Bank of New York Mellon Corporation | 110 | 143 | 130.25 |
BlackRock’s consensus target of 1,334 suggests a 19% upside from its current 1,119 price. BNY Mellon’s target consensus at 130.25 implies an 8.5% gain over today’s 119.92 price.

Don’t Let Luck Decide Your Entry Point
Optimize your entry points with our advanced ProRealTime indicators. You’ll get efficient buy signals with precise price targets for maximum performance. Start outperforming now!
How do institutions grade them?
BlackRock, Inc. Grades
The following table summarizes recent grades from major financial institutions for BlackRock, Inc.:
| Grading Company | Action | New Grade | Date |
|---|---|---|---|
| UBS | Maintain | Neutral | 2026-01-16 |
| Keefe, Bruyette & Woods | Maintain | Outperform | 2026-01-16 |
| Barclays | Maintain | Overweight | 2026-01-16 |
| TD Cowen | Downgrade | Hold | 2026-01-14 |
| UBS | Maintain | Neutral | 2026-01-12 |
| Barclays | Maintain | Overweight | 2026-01-08 |
| Keefe, Bruyette & Woods | Maintain | Outperform | 2026-01-08 |
| Keefe, Bruyette & Woods | Maintain | Outperform | 2025-12-17 |
| Morgan Stanley | Maintain | Overweight | 2025-12-17 |
| Barclays | Maintain | Overweight | 2025-12-12 |
The Bank of New York Mellon Corporation Grades
The table below shows recent grades from credible firms for The Bank of New York Mellon Corporation:
| Grading Company | Action | New Grade | Date |
|---|---|---|---|
| Citigroup | Maintain | Neutral | 2026-01-14 |
| Morgan Stanley | Maintain | Overweight | 2026-01-14 |
| RBC Capital | Maintain | Sector Perform | 2026-01-14 |
| Wells Fargo | Maintain | Equal Weight | 2026-01-14 |
| Keefe, Bruyette & Woods | Maintain | Outperform | 2026-01-14 |
| Truist Securities | Upgrade | Buy | 2026-01-07 |
| TD Cowen | Maintain | Buy | 2026-01-07 |
| Barclays | Maintain | Overweight | 2026-01-05 |
| Morgan Stanley | Maintain | Overweight | 2025-12-17 |
| TD Cowen | Maintain | Buy | 2025-10-20 |
Which company has the best grades?
Both companies have strong institutional support, but BlackRock shows consistent high ratings like Outperform and Overweight from several firms. Bank of New York Mellon holds solid Buy and Overweight grades but also some Neutral and Equal Weight ratings. Investors may view BlackRock’s steadier positive grades as a sign of stronger analyst confidence.
Risks specific to each company
The following categories identify the critical pressure points and systemic threats facing both firms in the 2026 market environment:
1. Market & Competition
BlackRock, Inc.
- Operates in highly competitive asset management with pressure from low-cost ETFs and fintech disruptors.
The Bank of New York Mellon Corporation
- Faces intense competition across custody, wealth, and investment services, with margin pressure from digital transformation.
2. Capital Structure & Debt
BlackRock, Inc.
- Maintains a conservative debt profile with favorable debt-to-equity and interest coverage ratios.
The Bank of New York Mellon Corporation
- Moderate leverage with higher debt-to-equity ratio and very weak interest coverage signals financial strain.
3. Stock Volatility
BlackRock, Inc.
- Exhibits higher beta (1.48), indicating greater stock price sensitivity to market swings.
The Bank of New York Mellon Corporation
- More stable stock with beta at 1.11, reflecting comparatively less market volatility.
4. Regulatory & Legal
BlackRock, Inc.
- Subject to stringent global asset management regulations and fiduciary compliance risks.
The Bank of New York Mellon Corporation
- Faces complex regulatory demands across custody and banking, increasing compliance cost and legal exposure.
5. Supply Chain & Operations
BlackRock, Inc.
- Relies on robust global technology platforms and third-party data providers, vulnerable to cyber risks.
The Bank of New York Mellon Corporation
- Highly dependent on operational infrastructure and clearing systems, with elevated risk of disruptions.
6. ESG & Climate Transition
BlackRock, Inc.
- Leads in ESG investing but faces pressure to prove impact and manage transition risks.
The Bank of New York Mellon Corporation
- ESG initiatives growing but lagging peers, risking reputational and regulatory challenges.
7. Geopolitical Exposure
BlackRock, Inc.
- Extensive global presence exposes it to geopolitical tensions and currency fluctuations.
The Bank of New York Mellon Corporation
- Also globally diversified but more focused on U.S. and developed markets, with lower emerging market risk.
Which company shows a better risk-adjusted profile?
BlackRock’s strongest risk lies in market competition amid disruptive fintech trends, while BNY Mellon struggles most with financial leverage and operational risks. Despite BlackRock’s higher stock volatility, its superior debt management and regulatory positioning yield a more balanced risk-adjusted profile. BNY Mellon’s low interest coverage and distress-zone Altman Z-score raise red flags on financial stability. I am concerned by BNY Mellon’s weak interest coverage ratio of 0.34, signaling vulnerability to rising borrowing costs.
Final Verdict: Which stock to choose?
BlackRock, Inc. (BLK) excels as a cash-generating powerhouse with a strong income statement and a bullish price trend. Its main point of vigilance is a declining return on invested capital, which hints at potential challenges in sustaining long-term value creation. BLK fits well in portfolios targeting aggressive growth with resilience.
The Bank of New York Mellon Corporation (BK) offers a strategic moat through improving return on invested capital and a solid dividend yield. It carries a more conservative safety profile than BLK, despite a weaker current ratio. BK suits growth-at-a-reasonable-price (GARP) investors seeking steady profitability with value upside.
If you prioritize high cash flow efficiency and aggressive market positioning, BlackRock outshines due to its robust revenue growth and operational strength. However, if you seek better stability with improving capital returns, BK offers superior value creation prospects and a more balanced risk profile. Both present slightly unfavorable ratio snapshots, demanding careful risk management.
Disclaimer: Investment carries a risk of loss of initial capital. The past performance is not a reliable indicator of future results. Be sure to understand risks before making an investment decision.
Go Further
I encourage you to read the complete analyses of BlackRock, Inc. and The Bank of New York Mellon Corporation to enhance your investment decisions: